
Abstract
Objective: Liver fibrosis is traditionally graded into categorical stages with cirrhosis as the highest stage. However, cirrhosis stage may vary between individuals widely in terms of the amount of fibrosis which is not assessed by traditional staging systems. We aimed to utilise visual morphometry to quantify the amount of fibrosis in liver biopsy and compare how non-invasive methods of quantifying liver fibrosis correlated with histological measures.
Materials and methods: Liver biopsy specimens from 115 consecutive chronic liver disease patients were assessed by a single pathologist for fibrosis stage by the Clinical Research Network and METAVIR systems as well as percentage fibrosis by visual morphometry. Liver T1 relaxation times, liver stiffness measurement (LSM) by transient elastography and enhanced liver fibrosis (ELF) score were compared between fibrosis stages. In addition, these parameters were correlated with pathologist’s visual estimate of percentage fibrosis and their predictive ability for advanced fibrosis and cirrhosis assessed by area under receiver operating curve (AUROC).
Results: All four parameters increased sequentially from fibrosis stage F0 to F4 (p<.001 for each). AUROCs for advanced fibrosis and cirrhosis were 0.931 and 1.000 respectively for pathologist’s estimate of fibrosis, 0.707 and 0.926 for ELF score, 0.763 and 0.972 for T1 and 0.881 and 0.989 for LSM. LSM, ELF score and T1 correlated significantly with pathologist’s estimate of percentage fibrosis.
Conclusion: Non-invasive markers of fibrosis LSM, ELF and T1 relaxation time provide continuous surrogates for categorical histopathological staging of fibrosis which can be useful as markers of progression and regression of fibrosis on follow-up.
Introduction
The evaluation of degree of fibrosis in liver biopsy specimens has traditionally been divided into arbitrary categorical stages, four stages in the METAVIR [Citation1] and Clinical Research Network (CRN) [Citation2] systems or six stages in the Ishak system,[Citation3] based upon a pathologists estimate of the amount and pattern of fibrosis. There is potential for misclassification of these stages both due to inherent limitations of liver biopsy and due to inter- and intra-observer variability. The highest stage in each system is labelled as cirrhosis which is characterised by replacement of normal liver lobules with abnormal nodules surrounded by fibrous septa irrespective of the thickness of these septa.[Citation4] None of the histological systems attempt to grade the histological severity of fibrosis based upon the relative amounts of parenchyma and fibrous tissue. We now recognise that cirrhosis is not a static pathologic state, but is in fact a dynamic process with potential for both progression and reversal. All patients with cirrhosis do not behave similarly and the hemodynamic consequences have been shown to be dependent upon the pattern and amount of fibrosis using semi-quantitative evaluation of liver biopsies.[Citation5] Subsequently, the absolute amount of fibrous tissue, using quantitative digital image analysis, has been correlated with portal pressure and the presence of clinically significant portal hypertension.[Citation6] Hence, an accurate assessment of the amount of fibrous tissue in a liver biopsy specimen has clinical and prognostic importance.
In the past decade, a number of non-invasive methods have been developed, evaluated and validated in the evaluation of liver fibrosis. These include non-invasive methods such as transient elastography (TE) to determine liver stiffness measurement (LSM), serum markers of fibrosis like the enhanced liver fibrosis (ELF) score and quantitative magnetic resonance imaging (MRI) techniques.[Citation7] In each of these non-invasive methods, parameters estimating the degree of fibrosis are expressed as continuous variable although specific cut-offs have been described to identify patients with advanced fibrosis and cirrhosis.
We aimed to utilise pathologist visual estimate of the proportion of area of fibrous tissue within the liver biopsy (visual morphometry) to quantify the amount of fibrosis and compare it with to LSM, T1 relaxation time and ELF scores as non-invasive methods of quantifying liver fibrosis in a cohort of patients with chronic liver disease.
Materials and methods
Study population
This study data acquisition was conducted with approval from the Nottingham NHS Ethics Committee at Nottingham University Hospitals NHS Trust and Royal Derby Hospital between May 2009 and September 2012; all patients gave written, informed consent (National Research Register Document NCT01572064). We included consecutive patients investigated for chronic liver disease with interpretable liver biopsy specimens. MRI and TE were performed within three months of biopsy and patients received no therapeutic interventions between biopsy and imaging. One hundred and fifteen patients with liver biopsy were included in the study. Of these, technical issues associated with the MR scanner resulted in incomplete T1 data for three subjects, and four subjects did not have serum measurements for ELF score calculation. Transient elastography was performed in a subset of 49 patients.
Biopsy procedure
Liver biopsies were obtained via either the percutaneous or the transjugular route. Patients were fasted overnight before the procedure and biopsies were carried out by experienced operators. The majority of the biopsies acquired were percutaneous and these were all carried out with ultrasound guidance, with samples taken from the right lobe of the liver. No major complications from the liver biopsy were reported in this cohort.
MRI protocol and data analysis
Details of the MRI procedure and its analysis has been published.[Citation7] Briefly, all patients were scanned on a 1.5 T scanner (Achieva, Philips Medical Systems, Best, Netherlands). Longitudinal relaxation (T1) data for the whole liver were acquired using a respiratory-triggered spin–echo inversion recovery scheme, with image acquisition near the end of the expiration phase of the breathing cycle, avoiding the need for breath-holding. To avoid the influence of liver fat on the relaxation time measurements, fat saturation pulses were used. MRI data were analysed by observers blind to the histopathology results. Histogram analysis was used to assess the distribution of T1 across the whole liver and remove the need for complex ROIs to be drawn to avoid contamination of signal from blood vessels.
Histopathology
Biopsies were stained with hematoxylin and eosin, picrosirius red (PSR) and Perls’ Prussian blue stains. All biopsy data were analysed by a single experienced pathologist blinded to MRI, ELF and TE data. The percentage of fibrous tissue relative to the total biopsy area was estimated for each biopsy by visual morphometry. In summary, the total amount of fibrous tissue in each biopsy slide was assessed by the pathologist by visual estimation of the amount of tissue stained red by PSR stain. For calculating fibrosis percentage, the normal collagenous structures including liver capsule and large normal portal tracts that also stained red with PSR were disregarded; total area of fibrosis was expressed as a percentage area in relation to the area of the histological section being examined. In addition, fibrosis was graded as 0–4 as per the CRN staging system [Citation2] for non-alcoholic fatty liver disease (NAFLD) cases and by the METAVIR system [Citation1] for all other etiologies.
Transient elastography
Transient elastography was performed by Fibroscan® (Echosens, Paris, France) using either a medium or large probe after overnight fasting and adhered to quality control as recommended by manufacturer’s instructions.[Citation8] Results were reported as LSM in kilopascals (kPa) from the median of 10 valid readings. Liver stiffness estimates were considered valid and included in the study when they adhered to quality control as recommended.
Blood samples
Blood samples were taken to assess the ELF score. These serum samples were analyzed for levels of tissue inhibitor of metalloproteinase-1 (TIMP-1), hyaluronic acid (HA) and procollagen III amino-terminalpeptide (PIIINP) at an independent reference laboratory (iQur, London, UK) using an ADVIA Centaur and the manufacturer’s reagents in accordance with the manufacturer’s instructions (Siemens Healthcare Systems, Tarrytown, NY). ELF scores were calculated using the manufacturer’s published updated algorithm,[Citation9] where C indicates the concentration of the assay in ng/mL:
Statistical analysis
Statistical analysis was carried out using IBM SPSS® 20.0 (SPSS, Chicago, IL). Liver T1 relaxation times, ELF score, LSM value and pathologists visual morphometric estimate of percentage fibrosis were respectively compared between fibrosis groups using an ANOVA. These parameters were also compared between patients without and with advanced fibrosis (fibrosis score < F3 versus ≥ F3) and those without and with cirrhosis (fibrosis score < F4 versus F4) using an unpaired Student’s t-test for parametric and Mann–Whitney U test for non-parametric data. Areas under the receiver operator curves (AUROCs) were calculated for the four continuous variables for the prediction of advanced fibrosis and cirrhosis respectively and the cut-off values for best sensitivity and specificity were determined for each. Correlation between the four continuous variables was assessed using a Spearman’s rank correlation coefficient. A p value<.05 was considered statistically significant.
Results
The baseline demographic and histological data are shown in . The majority of the patients were male and the most common etiology of liver disease was NAFLD. All stages of fibrosis were represented with 51% patients having at least significant fibrosis and 30% having advanced fibrosis. Cirrhosis was present in 10% of the cohort.
Table 1. Baseline characteristics of study population.
Distribution of study parameters by fibrosis grade
Morphometric data, LSM, ELF scores and MRI T1 data are shown in . Pathologist’s visual morphometric estimate of fibrosis, ELF score, LSM and T1 relaxation times were all significantly different between advanced fibrosis and non-advanced fibrosis groups, and cirrhosis and non-cirrhosis groups, respectively (). All four of the continuous variables increased from F0 to F4 fibrosis ( and ).
Figure 1. Box plots of the distributions of (A) pathologists estimate of fibrosis, (B) LSM, (C) ELF score and (D) MRI T1 relaxation time with fibrosis stage.
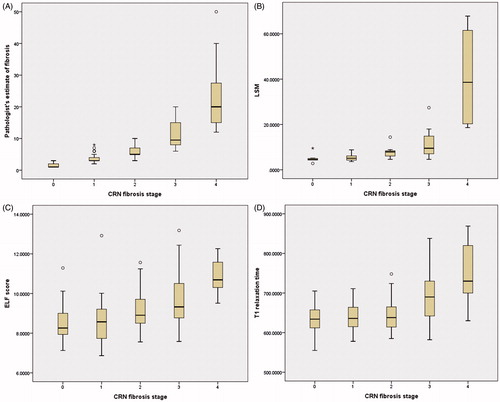
Table 2. Study parameters distribution by fibrosis stage.
Diagnostic ability of study parameters for advanced fibrosis
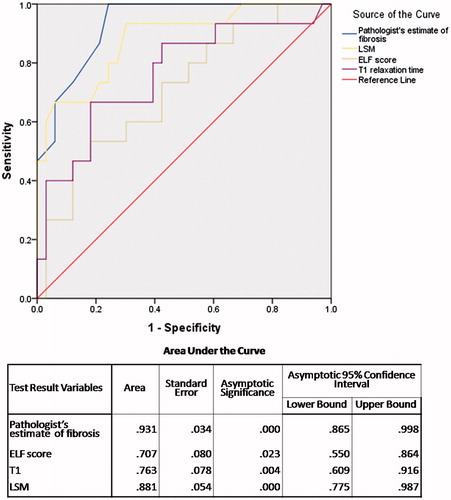
The AUROC for advanced fibrosis () is highest for pathologist’s visual estimate of fibrosis (0.931) as expected as the same pathologist staged the liver biopsy. This is followed by LSM value (0.881), T1 relaxation time (0.763) and ELF score (0.707). The best cut-off of LSM was 7.95 kPa with sensitivity of 73.3% and specificity of 78.8%, T1 relaxation time was 689 ms with sensitivity 66.7% and specificity 81.8%, and ELF was 9.29 with sensitivity 60.0% and specificity 69.7%.
Figure 2. Area under receiver operating curves (AUROC) of study variables for advanced fibrosis.
Diagnostic ability of study parameters for cirrhosis
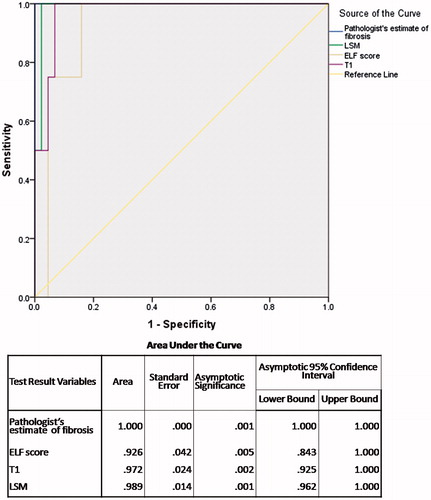
The AUROC for cirrhosis () is 100% for pathologist’s visual estimate of percent area of fibrosis (visual morphometry). This is followed by LSM value (0.989), T1 relaxation time (0.972) and ELF score (0.926). The best cut-off of LSM was 18.3 kPa with sensitivity of 100% and specificity of 97.7%, of T1 relaxation time was 716.5 ms with sensitivity 100% and specificity 93.2%, and of ELF was 10.12 with sensitivity 100% and specificity 84.1%.
Figure 3. Area under receiver operating curves (AUROC) of study variables for cirrhosis.
Correlation between the study parameters
LSM, T1 relaxation time and ELF score continuous variables correlated significantly with pathologist’s estimate of percentage fibrosis ( and ) for advanced fibrosis (F3–F4). However, only LSM and ELF significantly correlated with pathologist’s estimate of percent area of fibrosis for lower stages of fibrosis (F0–F2) although correlation was less strong ( and ).
Figure 4. Scatter plot of distribution of (A) LSM, (B) ELF score and (C) T1 relaxation time with pathologist’s estimate of fibrosis in F3–F4 group.
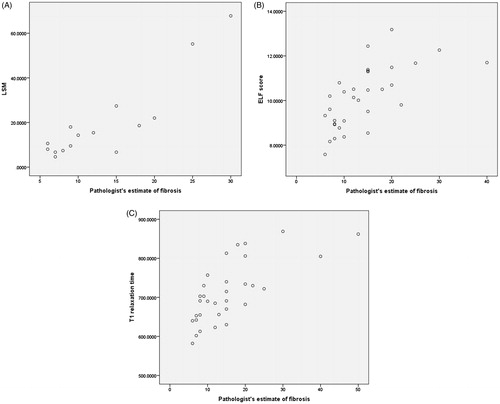
Figure 5. Scatter plot of distribution of (A) LSM, (B) ELF score and (C) T1 relaxation time with pathologist’s estimate of fibrosis in F0–F2 group.
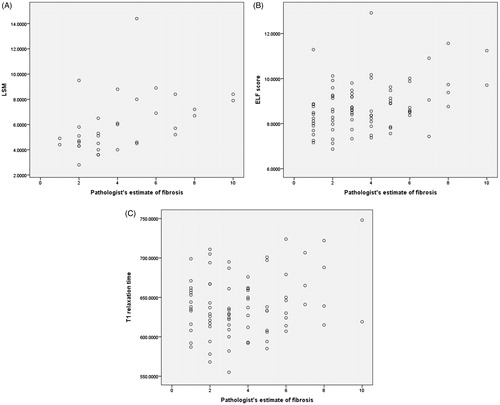
Table 3. Correlation of study parameters with pathologist’s estimate of fibrosis.
Discussion
This study evaluated four methods of quantifying fibrosis (percentage fibrosis on visual morphometry, LSM, T1 and ELF scores) across the full fibrosis spectrum of fibrosis from F0 to F4. Transient elastography LSM depends upon physical changes in the liver architecture, while the T1 relaxation time is based on alterations at molecular level in the fibrosis, and the ELF score is based on serum biomarkers. All three parameters are non-invasive surrogate measures of fibrosis. In contrast, visual morphometry directly measures collagen content in liver, but is invasive and requires liver biopsy. Unlike categorical fibrosis staging used in well-established CRN and METAVIR systems, visual morphometry described as percent area of by a pathologist does not depend upon purely on the architectural pattern of the fibrosis but the amount of fibrosis.
As expected, the pathologist’s estimate of percentage area of liver fibrosis had a very good AUROC for fibrosis stages as both are being estimated by the same individual. However, it is important to note that visual morphometry can be used as a continuous variable accurately quantifying the amount of fibrosis. We also demonstrated that all three non-invasive methods had excellent correlations with the pathologist’s estimate of percentage area of fibrosis on liver biopsy, particularly in patients with advanced fibrosis and cirrhosis (F3 and F4). This is the subgroup of patients which is most likely to benefit from close monitoring of progression or regression of fibrosis. Mean values of each parameter increased sequentially from F0 to F4 fibrosis stage. Also, all three non-invasive methods showed good ability in discriminating non-advanced (F0–F2) from advanced (F3–F4) fibrosis, and patients with no cirrhosis from cirrhotic patients. In addition, we observed a wide range of values of all three non-invasive parameters as well as visual morphometric estimate of percentage area of fibrosis within the cirrhotic F4 group, supporting the suggestion that amounts of fibrosis in all patients with cirrhosis are not histologically equivalent.
Previous studies have evaluated morphometry for fibrosis quantification and found good correlation with categorical fibrosis stages. However, most of these were limited to patients with chronic viral hepatitis,[Citation10–12] compared to the present study which evaluated various aetiologies of liver disease, representing routine clinical practice. Similar to our finding, discriminative ability of morphometry in these studies was better between advanced and lower graded of fibrosis rather than within lower grades of fibrosis.[Citation13] Studies have also shown correlation of morphometric estimation of fibrosis with portal hypertension among compensated cirrhotics,[Citation11,Citation14] indicating that this methodology may have value in clinical monitoring of patients.
We used the pathologist’s visual morphometric estimate of fibrosis rather than automated computerised morphometry as an automated method does not discriminate pathological fibrosis from normal fibrous tissue seen on histology slides as a result of tangential cuts, vasculature and capsule. The AUROCs for ELF score to diagnose significant and advanced fibrosis in this study are similar to those reported previously.[Citation15,Citation16] Also the best-cut-off estimated for significant and advanced fibrosis is within the range reported by previous studies.[Citation9,Citation17] Similarly the AUROCs of TE to predict cirrhosis are similar to previous studies.[Citation18] The cut-off values of TE for cirrhosis are widely variable between studies and between different aetiologies of liver disease, ranging from 9 to 26.5 kPa.[Citation19] A meta-analysis has suggested a best cut-off of 13.0 kPa,[Citation20] lower than the best cut-off seen in our study. However, several studies in patients with alcoholic and non-alcoholic liver disease as well as those with mixed etiologies [Citation21–24] have found ideal cut-off values similar to that reported in this study.
The T1 relaxation time did not correlate well with fibrosis percentage on visual morphometry in patients with lower grades of fibrosis (F0–F2) and LSM and ELF score also had a poor correlation. We have previously shown that other factors such as iron accumulation and inflammation affect the T1 relaxation time; with iron accumulation reducing and inflammation increasing T1 parameter.[Citation7] However these effects lessen once advanced fibrosis is present, and the increase in T1 relaxation time due to fibrotic changes in the liver tissue dominate.
This study is different from previous studies in that it directly compares three non-invasive methods of quantifying liver fibrosis and the pathologist’s assessment of the liver biopsy, both as a categorical and a continuous variable. Also, in this study the whole spectrum of fibrosis from F0 to F4 is well represented. All aetiologies of liver disease have been included in contrast to previous studies which have focussed on a single aetiology, typically chronic viral hepatitis. However, there are some limitations to this study. First, less than half of the patients in this study had TE assessment to define a LSM. We have not correlated any of the parameters with portal hypertension as we did not have hepatic venous pressure gradients (HVPG) for all the patients; however, we have recently demonstrated in another cohort, that T1 relaxation time correlates significantly with HVPG measurements.[Citation25] We have not analysed clinical outcomes or progression of disease based upon baseline fibrosis severity, as we do not have follow-up data of all the patients.
There is a need for quantitative non-observer dependant methods to grade fibrosis as a continuous variable to augment the categorical semi-quantitative observer dependant systems in place presently. This is important for studying the progression and reversal of fibrosis, where the current systems are insensitive to assess small changes over time. Also, cirrhosis is not one disease but a continuous spectrum ranging from patients without portal hypertension to those with compensated portal hypertension to those with decompensation. Current histological systems do not account for this spectrum and group all patients into one stage. In this study, histological heterogeneity of the cirrhosis population is reflected by a wide range of values of percentage fibrosis within this group, irrespective of the method employed to assess fibrosis. There is a need to further stratify patients with cirrhosis into sub-groups based upon the amount of fibrosis. By validating a continuous marker of fibrosis, clinical prognosis within the advanced fibrosis/cirrhosis group is likely to improve, especially if further studies are able to correlate quantity of fibrosis with clinical outcomes. We do not suggest that any of these three methods of fibrosis estimation replace liver biopsy as the initial means of staging liver fibrosis for clinical decision making. The chief utility would be in monitoring progression or regression of fibrosis, largely in the setting of clinical trials using the non-invasive methods that correlate with morphometry. If in the future these measures can be shown to predict clinical outcomes like decompensation and death, they can be used for prognostication and risk stratification of patients with liver cirrhosis.
In conclusion, this study shows that non-invasive methods are available to quantify liver fibrosis and correlate well with the pathologist’s estimates of percentage area of fibrosis on visual morphometry as well as the categorical stage of fibrosis. Further work is required to determine the utility of these markers in predicting clinical outcomes and monitoring progression/regression of fibrosis.
| Abbreviations | ||
| CRN | = | Clinical Research Network |
| TE | = | transient elastography |
| MRI | = | magnetic resonance imaging |
| ELF | = | enhanced liver fibrosis |
| AUROC | = | area under receiver operating curve |
| PSR | = | picrosirius red |
| LSM | = | liver stiffness measurement |
| kPa | = | kilopascals |
| TIMP-1 | = | tissue inhibitor of metalloproteinase-1 |
| HA | = | hyaluronic acid |
| PIIINP | = | procollagen III amino-terminalpeptide |
Disclosure statement
None of the authors have any conflict of interest to declare. The views expressed are those of the author(s) and not necessarily those of the NHS, the NIHR or the Department of Health.
References
- Poynard T, Bedossa P, Opolon P. Natural history of liver fibrosis progression in patients with chronic hepatitis C. The OBSVIRC, METAVIR, CLINIVIR, and DOSVIRC groups. Lancet. 1997;349:825–832.
- Kleiner DE, Brunt EM, Van Natta M, et al. Design and validation of a histological scoring system for nonalcoholic fatty liver disease alcoholic. Hepatology. 2005;41:1313–1321.
- Ishak K, Baptista A, Bianchi L, et al. Histological grading and staging of chronic hepatitis. J Hepatol. 1995;22:696–699.
- Anthony PP, Ishak KG, Nayak NC, et al. The morphology of cirrhosis. Recommendations on definition, nomenclature, and classification by a working group sponsored by the World Health Organization. J Clin Pathol. 1978;31:395–414.
- Nagula S, Jain D, Groszmann RJ, et al. Histological-hemodynamic correlation in cirrhosis – a histological classification of the severity of cirrhosis. J Hepatol. 2006;44:111–117.
- Sethasine S, Jain D, Groszmann RJ, et al. Quantitative histological-hemodynamic correlations in cirrhosis. Hepatology. 2012;55:1146–1153.
- Hoad CL, Palaniyappan N, Kaye P, et al. A study of T1 relaxation time as a measure of liver fibrosis and the influence of confounding histological factors. NMR Biomed. 2015;28:706–714.
- McCorry RB, Palaniyappan N, Chivinge A, et al. Development and evaluation of a nurse-led transient elastography service for the staging of hepatic fibrosis in patients with suspected chronic liver disease. QJM. 2012;105:749–754.
- Lichtinghagen R, Pietsch D, Bantel H, et al. The Enhanced Liver Fibrosis (ELF) score: normal values, influence factors and proposed cut-off values. J Hepatol. 2013;59:236–242.
- Caballero T, Perez-Milena A, Masseroli M, et al. Liver fibrosis assessment with semiquantitative indexes and image analysis quantification in sustained-responder and non-responder interferon-treated patients with chronic hepatitis C. J Hepatol. 2001;34:740–747.
- Calvaruso V, Burroughs AK, Standish R, et al. Computer-assisted image analysis of liver collagen: relationship to Ishak scoring and hepatic venous pressure gradient. Hepatology. 2009;49:1236–1244.
- Hui AY, Liew CT, Go MY, et al. Quantitative assessment of fibrosis in liver biopsies from patients with chronic hepatitis B. Liver Int. 2004;24:611–618.
- Xu S, Wang Y, Tai DC, et al. qFibrosis: a fully-quantitative innovative method incorporating histological features to facilitate accurate fibrosis scoring in animal model and chronic hepatitis B patients. J Hepatol. 2014;61:260–269.
- Isgro G, Calvaruso V, Andreana L, et al. The relationship between transient elastography and histological collagen proportionate area for assessing fibrosis in chronic viral hepatitis. J Gastroenterol. 2013;48:921–929.
- Parkes J, Guha IN, Roderick P, et al. Enhanced Liver Fibrosis (ELF) test accurately identifies liver fibrosis in patients with chronic hepatitis C. J Viral Hepat. 2011;18:23–31.
- Rosenberg WM, Voelker M, Thiel R, et al. Serum markers detect the presence of liver fibrosis: a cohort study. Gastroenterology. 2004;127:1704–1713.
- Cobbold JF, Crossey MM, Colman P, et al. Optimal combinations of ultrasound-based and serum markers of disease severity in patients with chronic hepatitis C. J Viral Hepat. 2010;17:537–545.
- Castera L. Invasive and non-invasive methods for the assessment of fibrosis and disease progression in chronic liver disease. Best Pract Res Clin Gastroenterol. 2011;25:291–303.
- Tsochatzis EA, Gurusamy KS, Ntaoula S, et al. Elastography for the diagnosis of severity of fibrosis in chronic liver disease: a meta-analysis of diagnostic accuracy. J Hepatol. 2011;54:650–659.
- Friedrich-Rust M, Ong MF, Martens S, et al. Performance of transient elastography for the staging of liver fibrosis: a meta-analysis. Gastroenterology. 2008;134:960–974.
- Gomez-Dominguez E, Mendoza J, Rubio S, et al. Transient elastography: a valid alternative to biopsy in patients with chronic liver disease. Aliment Pharmacol Ther. 2006;24:513–518.
- Foucher J, Chanteloup E, Vergniol J, et al. Diagnosis of cirrhosis by transient elastography (FibroScan): a prospective study. Gut. 2006;55:403–408.
- Yoneda M, Mawatari H, Fujita K, et al. Noninvasive assessment of liver fibrosis by measurement of stiffness in patients with nonalcoholic fatty liver disease (NAFLD)invasive alcoholic. Dig Liver Dis. 2008;40:371–378.
- Nguyen-Khac E, Chatelain D, Tramier B, et al. Assessment of asymptomatic liver fibrosis in alcoholic patients using fibroscan: prospective comparison with seven non-invasive laboratory tests. Aliment Pharmacol Ther. 2008;28:1188–1198.
- Palaniyappan N, Cox E, Bradley C, et al. Non-invasive assessment of portal hypertension using quantitative magnetic resonance imaging. J Hepatol. 2016. [Epub ahead of print]. doi: 10.1016/j.jhep.2016.07.021.