
Abstract
Objectives: The prevalence, gender distribution and clinical presentation of IBS differ between Asian and Western countries. This study aimed at studying and comparing enteroendocrine, Musashi 1 (Msi 1) and neurogenin 3 (neurog 3) cells in Thai and Norwegian IBS patients.
Material and methods: Thirty Thai and 61 Norwegian IBS patients as well as 20 Thai and 24 Norwegian controls were included. Biopsy samples were taken from each of the sigmoid colon and the rectum during a standard colonoscopy. The samples were immunostained for serotonin, peptide YY, oxyntomodulin, pancreatic polypeptide, somatostatin, Msi 1 and neurog 3. The densities of immunoreactive cells were determined with computerized image analysis.
Results: The densities of several enteroendocrine cell types were altered in both the colon and rectum of both Thai and Norwegian IBS patients. Some of these changes were similar in Thai and Norwegian IBS patients, while others differed.
Conclusions: The findings of abnormal densities of the enteroendocrine cells in Thai patients support the notion that enteroendocrine cells are involved in the pathophysiology of IBS. The present observations highlight that IBS differs in Asian and Western countries, and show that the changes in large-intestine enteroendocrine cells in Thai and Norwegian IBS patients might be caused by different mechanisms.
Introduction
Irritable bowel syndrome (IBS) is a chronic gastrointestinal disorder affecting a large number of people worldwide [Citation1–3]. In addition, 32–39% of patients with ulcerative colitis and 42–60% of patients with Crohn’s disease exhibit IBS symptoms under remission [Citation3]. Moreover, about 20–37% of patients with celiac disease suffer from IBS symptoms despite adhering to a gluten-free die [Citation3]. Patients with IBS suffer from recurrent abdominal pain/discomfort and altered bowel habits [Citation1]. Both the degree and time pattern of the symptoms vary between patients [Citation3]. While IBS is not associated with increased mortality, it can markedly reduce the quality of life [Citation3].
IBS differs considerably between Asian and Western countries (e.g., USA and Europe), including in its prevalence, gender distribution and clinical presentation. The prevalence of IBS is 5–9% in Asian countries compared to 10–20% in Western countries [Citation1,Citation4–6]. In contrast to Western IBS patients, there is no female predominance in Asian IBS patients [Citation5–9]. Furthermore, abdominal bloating is a more common clinical presentation than pain in Asian IBS patients, and abdominal pain (when it occurs) is localized to the upper abdomen rather than in the lower abdomen like it is in Western patients. In addition, alteration in bowel habits is much less prominent in Asian IBS patients than in Western patients [Citation5,Citation6,Citation10,Citation11].
The pathophysiology of IBS is not completely understood, but several factors such as genetics, diet, intestinal bacterial flora, low-grade inflammation and abnormalities of the gastrointestinal endocrine cells seem to play a central role [Citation1–3,Citation12,Citation13]. It was shown recently that the densities of stem Musashi 1 (Msi 1) and neurogenin 3 (neurog 3) cells are lower in the small intestine of European (Caucasian) patients with IBS [Citation14,Citation15]. Msi 1 is a transcription factor expressed by both intestinal stem cells and their early progenitors, which are located in the intestinal crypts [Citation16–18]. Neurog 3 is expressed in the endocrine cells progenitor originated from secretory progenitors, which subsequently differentiate into endocrine cells [Citation19]. Neurog 3−/− mice have normal densities of goblet and Paneth cells, but no pancreatic endocrine cells or enteroendocrine cells [Citation20,Citation21]. It has been concluded that the low densities of enteroendocrine cells in the small intestine is probably caused by abnormal intestinal stem cells and their differentiation into enteroendocrine cells in the small intestine [Citation14,Citation15].
This study aimed to measure and compare the densities of large-intestine enteroendocrine cells, stem cells as detected by Msi 1 and the differentiation progeny of stem cells toward enteroendocrine cells as detected by neurog 3 in Thai and Norwegian (Caucasian) IBS patients.
Material and methods
Patients and controls
Thirty Thai patients with IBS as diagnosed using the Rome III criteria for IBS were recruited at King Chulalongkorn Memorial Hospital, Bangkok, Thailand. These patients comprised 23 females and 7 males with a mean age of 56 years (range, 45–70 years), and their IBS subtypes were distributed as follows: 11 with diarrhea as the predominant symptom (IBS-D), 6 with mixed diarrhea and constipation (IBS-M) and 13 with constipation as the predominant symptom (IBS-C). Similarly, 61 Norwegian (Caucasian) patients with IBS were recruited at Stord Hospital, Stord, Norway. These patients comprised 48 females and 13 males with a mean age of 51 years (range, 27–67 years): 22 with IBS-D, 18 with IBS-M, and 21 with IBS-C. The onset of IBS symptoms was not associated with a gastrointestinal infection in any of the patients. Patients taking antibiotics, immunosuppressants or nonsteroidal anti-inflammatory agents within 1 month prior to study enrollment were excluded.
The Thai control group comprised 20 subjects (14 females and 6 males; mean age 50 years, range 36–69 years) who underwent a colonoscopy for colorectal cancer screening. The Norwegian (Caucasian) control group comprised 24 subjects (19 females and 5 males; mean age 50.3 years, range 38–67 years) who underwent a colonoscopy because of gastrointestinal bleeding, where the source of bleeding was identified as hemorrhoids (n = 9) or angiodysplasia (n = 1), and health worries caused by a relative being diagnosed with colon carcinoma (n = 14).
Colonoscopy, histopathology and immunohistochemistry
Both the patients and the controls underwent a standard colonoscopy, during which four biopsy samples were taken from the sigmoid colon at about 30 cm from the anus, and another four biopsy samples were taken from the rectum at about 15 cm from the anus. The biopsy sample sites were chosen because sigmoid colon is more accessible and previous studies showed that there is no difference in the enteroendocrine cell types or density between different segments of the colon [Citation22]. On the other hand rectum has a much higher cell density than the colon [Citation23]. The biopsy samples were fixed in 4% buffered paraformaldehyde, processed into paraffin blocks, and cut into 5 μm sections. The sections were stained with hematoxylin-eosin, and immunostained for serotonin, peptide YY (PYY), oxyntomodulin (enteroglucagon), pancreatic polypeptide (PP), somatostatin, Msi 1 and neurog 3. The ultraView Universal DAB Detection Kit version 1.02.0018 (Venata Medical Systems, Basel, Switzerland) was used for immunostaining, and the sections were processed using the BenchMark Ultra IHC/ISH staining module (Venata Medical Systems, Oro Valley, AZ). The sections were incubated with the primary antibodies for 35 min at 37 °C. The primary antibodies used are summarized in .
Table 1. Details of the primary antibodies used in immunostaining.
Measurements of cell densities
Cell densities were measured using a microscope (BX 43, Olympus, Tokyo, Japan) equipped with a camera (DP 26, Olympus) that was linked to a computer running imaging software version 1.7 (cellSens, Olympus). The morphometric method used has been validated previously [Citation24]. The numbers of immunoreactive cells were counted manually in each field by pointing and clicking the computer mouse. The area of epithelial cells was determined by manually drawing an enclosed region using the computer mouse. A × 40 objective was used, for which each field represented a tissue area of 0.035 mm2. The densities of enteroendocrine and neurog 3 cells were expressed as the number of cells per square millimeter of epithelium, and the density of Msi 1 cells was expressed as the number of immunoreactive cells per crypt. Measurements were performed in 10 randomly chosen microscopy fields. All measurements were made by the same person (MES) while he was unaware of the identities of the slides.
Statistical analysis
The Mann–Whitney nonparametric test was used to examine differences in the age distribution. The presence of a gender difference between patients and controls was tested using Fisher’s exact test. Differences between control subjects, all IBS (IBS-total) patients, and IBS-D, IBS-M and IBS-C patients were assessed using the Kruskal–Wallis nonparametric test with Dunn’s posttest. The data are presented as median with interquartile range values, and differences with p < .05 were considered to be statistically significant.
The study was approved by the Regional Committee for Medical and Health Research Ethics West, Bergen, Norway and the local Committee of Medical and Health Research Ethics at King Chulalongkorn Memorial Hospital, Bangkok, Thailand. All subjects gave informed oral and written consents to participate.
Results
Gender and age distributions of the patients and controls
The age distribution did not differ significantly between Thai IBS patients and controls (p = .3), between Norwegian IBS patients and controls (p = .7), between Thai and Norwegian controls (p = .4), or between Thai and Norwegian IBS patients (p = .5). The gender distribution did not differ between Thai IBS patients and controls (p = .7), between Norwegian IBS patients and controls (p = .3), between Thai and Norwegian controls (p = 1.0), or between Thai and Norwegian IBS patients (p = .5).
Colonoscopy, histopathology and immunohistochemistry
The colon and rectum of the patients and control subjects were both macroscopically and microscopically normal. Enteroendocrine, Msi 1 and neurog 3 cells were found in the colon and rectum of both patients and controls. Msi 1 cells were encountered in the crypts, whereas enteroendocrine cells and neurog 3 were found both in the crypts and alongside the epithelial cells.
Cell densities
Colon
The densities of enteroendocrine, Msi 1 and neurog 3 cells in the colon are illustrated in .
Figure 1. The densities of enteroendocrine, Musashi 1 and neurogenin 3 cells in controls and Thai and Norwegian IBS patients. *p < .05, **p < .01 and ***p < .0001.
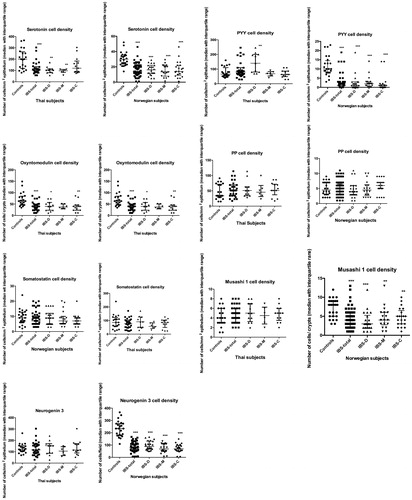
Serotonin: The Kruskal–Wallis nonparametric test revealed significant differences in the density of serotonin cells in the colon of Thai and Norwegian patients (p = .0016 and <.0001, respectively). The density of serotonin cells was lower in Thai IBS-total, IBS-D and IBS-M patients than in controls (p = .0002, .001 and .0036, respectively), and lower in Norwegian IBS-total, IBS-D, IBS-M and IBS-C patients than in controls (p < .0001 for all).
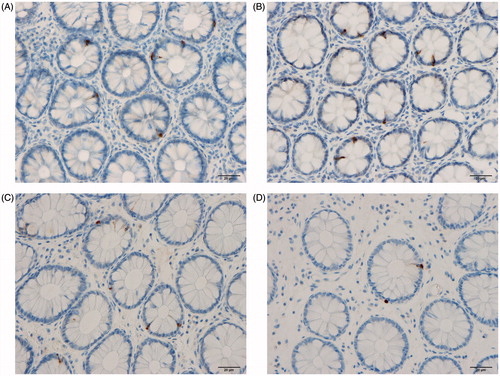
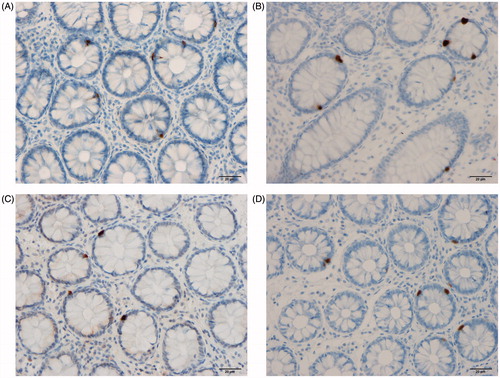
PYY: The Kruskal–Wallis test revealed significant differences in the PYY cell density in the colon of Thai patients (p = .01). The PYY cell density was higher in IBS-D patients than in controls (p = .002). In the Norwegian patients Kruskal–Wallis was test was also significant (p < .0001). The density of PYY cells was significantly lower in Norwegian IBS-total, IBS-D, IBS-M and IBS-C patients than in controls (p < .0001 for all) ().
Figure 2. PYY cells in the colon of a Thai control (A), in a Thai IBS-D patient (B), in a Norwegian control (C), and in a Norwegian IBS patient (D).
Oxyntomodulin: There were significant differences in the oxyntomodulin cell density in the colon between control subjects and IBS-total, IBS-D, IBS-M and IBS-C patients in both the Thai and Norwegian subjects (p = .001 and <.0001, respectively). The oxyntomodulin cell density was lower in Thai IBS-total, IBS-D, IBS-M and IBS-C patients than in controls (p < .0001, .01, .004 and .001, respectively), and lower in Norwegian IBS-total, IBS-D, IBS-M and IBS-C patients than in controls (p = .0009, <.0001, <.001 and .0001, respectively).
PP: There were no significant differences in the PP cell density in the colon between Thai and Norwegian control subjects, IBS-total patients, and IBS-subtype patients (p = .7 and .5, respectively).
Somatostatin: The Kruskal–Wallis test revealed no significant difference in the somatostatin cell density in the colon between both Thai and Norwegian controls and IBS patients (P=.6 for both).
Msi 1: There was no significant difference in the density of Msi 1 cells in the colon between Thai control subjects, IBS-total patients, and IBS-subtype patients (p = .7). However, the Kruskal–Wallis test revealed a significant difference in Msi 1 cell density between Norwegian controls and IBS patients (p < .0001). The density of Msi 1 cells was significantly lower in Norwegian IBS-total, IBS-D, IBS-M and IBS-C patients than in controls (p < .0001, <.0001, .002 and .003, respectively).
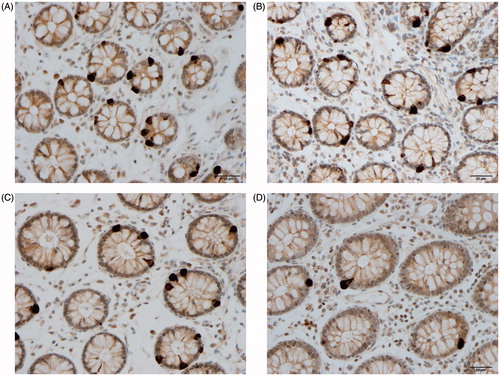
Neurog 3: The Kruskal–Wallis test revealed no significant differences in the neurog 3 cell density in the colon between Thai controls and IBS patients (p = .8). However, Kruskal–Wallis test was significant between Norwegian controls and IBS and IBS subtypes (p < .0001). The density of neurog 3 cells was lower in IBS-total, IBS-D, IBS-M and IBS-C patients than in controls (<.0001 for all) ().
Figure 3. Neurog 3 cells in the colon of a Thai control (A), in a Thai IBS patient (B), in a Norwegian control (C), and in Norwegian IBS patient (D).
Rectum
The densities of enteroendocrine, Msi 1 and neurog 3 cells in the rectum are given in .
Figure 4. The densities of rectal enteroendocrine, Musashi 1, and neurogenin 3 cells in controls and Thai and Norwegian IBS patients. *p < .05, **p < .01 and ***p < .0001.
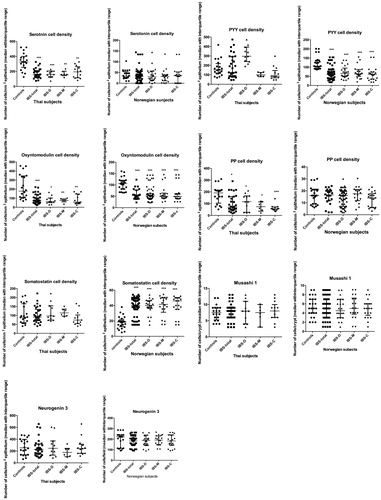
Serotonin: There were significant differences in the serotonin cell density in the rectum between Thai controls and IBS-total, IBS-D, IBS-M and IBS-C patients (p < .0001), but it did not differ between Norwegian control subjects, IBS-total patients and IBS-subtype patients (p = .8) (). The density of serotonin cells was lower in Thai IBS-total, IBS-D, IBS-M and IBS-C patients (p < .0001, <.0001, .001 and .0004, respectively).
Figure 5. Serotonin cells in the rectum of a Thai control (A), in a Thai IBS patient (B), in a Norwegian control (C), and in a Norwegian IBS patient (D).
PYY: The Kruskal–Wallis test revealed significant differences in the PYY cell density in the rectum of Thai subjects (p = .0002). The density of PYY cells was significantly higher in Thai IBS-D patients than in controls (p = .0001), but lower in IBS-M and IBS-C patients (p = .03 and .02, respectively). The density of PYY cells differed significantly between Norwegian controls and IBS-total, IBS-D, IBS-M and IBS-C patients (p < .0001). The density of PYY cells was significantly lower in Norwegian IBS-total, IBS-D, IBS-M and IBS-C patients than in controls (p < .0001 for all).
Oxyntomodulin: The density of oxyntomodulin cells in the rectum differed significantly in both the Thai and Norwegian control subjects and IBS-total, IBS-D, IBS-M and IBS-C patients (p = .0002 and <.0001, respectively). The density of oxyntomodulin cells was lower in IBS-total, IBS-D, IBS-M and IBS-C patients than in controls among both Thai subjects (p < .0001, .0002, .0006 and .0008, respectively) and Norwegian subjects (p < .0001 for all).
PP: The density of PP cells in the rectum differed significantly in Thai controls and IBS-total, IBS-D, IBS-M and IBS-C patients (p = .0004), whereas there was no difference in Norwegian subjects (p = .3). The PP cell density was significantly lower in Thai IBS-total, IBS-D, IBS-M and IBS-C patients than in controls (p = .001, .04, .005 and <.0001, respectively).
Somatostatin: The Kruskal–Wallis test revealed no significant differences in the somatostatin cell density in the rectum of Thai subjects (p = .2), while it differed significantly between Norwegian control subjects, IBS-total patients and IBS-subgroup patients (p < .0001). The somatostatin cell density was significantly higher in IBS-total, IBS-D, IBS-M and IBS-C patients than in controls (p < .0001 for all).
Msi 1: The Msi 1 cell density in the rectum did not differ significantly between controls and IBS-total, IBS-D, IBS-M and IBS-C patients in both Thai and Norwegian subjects (p = .9 for both).
Neurog 3: The Kruskal–Wallis test revealed no significant differences in the neurog 3 cell density in the rectum between controls and IBS patients in both Thai and Norwegian subjects (p = .6 and .9, respectively).
Discussion
It was reported recently that the total density of large-intestine enteroendocrine cells (as detected by chromogranin A) is much higher in both Thai healthy subjects and IBS patients than in Norwegians (Caucasians) [Citation25]. This difference has been attributed to racial differences, a high exposure of Thai subjects to infections in childhood, and differences in microbiota and diet habits [Citation25]. This study found that the densities of all of the enteroendocrine cell types were higher in Thai than Norwegian subjects, which is probably due to the same factors as speculated previously. The density of large-intestine enteroendocrine cells was abnormal in both Thai and Norwegian IBS patients, but the affected enteroendocrine cell types differed between these two populations.
The serotonin cell density in the colon was lower in both Thai and Norwegian IBS patients. This decrease was present in all Norwegian IBS-subtype patients, but not in Thai IBS-C patients. While the density of serotonin cells in the rectum was decreased in all Thai IBS-subtype patients, it was normal in Norwegian IBS patients. The finding that serotonin cells are affected in both Thai and Norwegian IBS patients suggests that this amine plays a key role in the pathophysiology of IBS. Serotonin is released from serotonin cells into the surrounding tissues in response to luminal stimuli such as increases in the luminal pressure and gut contents and it subsequently activates the sensory branch in the submucosal plexus as well as the myenteric plexus [Citation26,Citation27]. These sensory branches convey sensation from the gut to the CNS via the sympathetic and parasympathetic nervous systems, which in turn activate the cerebral cortex via the thalamus leading to the sensation of visceral pain. Serotonin also stimulates intestine motility and decreases the transit times in the small and large intestines [Citation13]. The changes in serotonin cell densities seen in this study in both Thai and Norwegian IBS patients may be connected to the visceral hypersensitivity and dysmotility described previously in IBS patients [Citation13].
The PYY cell densities in both the colon and rectum were decreased in the present Norwegian IBS patients, which is consistent with previous observations [Citation28,Citation29]. The density of PYY cells was increased in the colon of Thai IBS-D patients while being unchanged in the rectum of all IBS-subtype patients. PYY stimulates the absorption of water and electrolytes, and regulates the ileal brake [Citation13,Citation29,Citation30]. Since the changes in PYY cell density were more prominent in Norwegian than Thai IBS patients, it seems that PYY plays a more prominent role in the pathophysiology of IBS in Norwegian than Thai patients. PYY cells are present in the distal small intestine as well as in the large intestine [Citation31]. PYY coexists and is expressed together with oxyntomodulin by L-cells [Citation32]. The oxyntomodulin cell densities in both the colon and rectum were lower in all IBS subtypes in both Thai and Norwegian patients. Oxyntomodulin inhibits gastric and pancreatic secretion, reduces gastric motility, and shows incretin activity [Citation12].
The PP cell densities in the colon of both Thai and Norwegian IBS patients were unchanged. The density of PP cells in the rectum was reduced in Thai IBS patients but unchanged in Norwegian IBS patients. PP stimulates the motility of the stomach and small intestine as well as gastric acid secretion, relaxes the gallbladder and inhibits pancreatic secretion [Citation12]. The somatostatin cell densities in the colon of both Thai and Norwegian IBS patients were unchanged. The density of somatostatin cells in the rectum was unchanged in Thai IBS patients but elevated in Norwegian IBS Patients. Somatostatin inhibits intestine contraction and gut exocrine and neuroendocrine secretion [Citation12].
The epithelial cells lining the intestinal lumen originate from stem cells located at the base of each crypt [Citation33,Citation34]. Each crypt contains four to six stem cells on average, which divide into new stem cells (self-renewal; clonogeny) so as to keep their number constant [Citation33,Citation34]. Some of the stem cells differentiate via two lineages into all mucosal epithelial cell types (differentiation progeny): secretory and absorptive lineages. The secretory lineage gives rise to goblet, endocrine, and Paneth cells, while the absorptive lineage gives rise to absorptive enterocytes [Citation33–35].
Msi 1 is a marker for both intestinal stem cells and their early progeny, and neurog 3 is a marker for early intestinal endocrine cell progenitors [Citation16–18,Citation36–39]. The total density of enteroendocrine cells in the colon (as detected by chromogranin A) was previously found to be reduced in Norwegian IBS patients [Citation40]. In this study, the densities of Msi 1 and neurog 3 cells in the colon were reduced in Norwegian IBS patients. Similar results have been found in the small intestine of Norwegian IBS patients [Citation14]. Reductions of intestinal endocrine cells in patients with congenital malabsorptive diarrhea in patients with small-intestine allograft rejection and in neurog-3-knockout mice were accompanied by reductions in neurog 3 cells [Citation19,Citation20,Citation37]. Furthermore, the reduction in neurog 3 cell density appears to be caused by neurog 3 gene mutation [Citation19,Citation41,Citation42]. It is therefore likely that the reduction in the total density of enteroendocrine cells in the colon of Norwegian IBS patients is caused by reductions in Msi 1 and neurog 3.
The total densities of enteroendocrine cells (as detected by chromogranin A) were unchanged in the colon and rectum of Thai IBS patients and in the rectum of Norwegian IBS patients [Citation25,Citation43]. It was therefore not surprising to find in this study that the densities of Msi 1 and neurog 3 cells were unchanged in the colon of Thai IBS patients and in the rectum of both Thai and Norwegian IBS patients. However, the proportions of enteroendocrine subtypes in these segments differed between IBS patients and control subjects. Mature enteroendocrine cells are able to express up to seven hormones [Citation44–46]. It has been proposed that these changes are caused by switching off the expression of a certain (X) hormone of an enteroendocrine cell and switching on the expression of another (Y) hormone, such that the density of hormone X cells decreases and that of hormone Y cells increases without changing the total endocrine cell density [Citation3].
In conclusion, the prevalence, gender distribution and clinical presentation of IBS, and abnormalities of the enteroendocrine cells differ between IBS patients in Thailand (and probably also other countries in Asia) and Norway (and probably also other Western countries). Abnormality in intestinal stem cells in and their progeny differentiation toward enteroendocrine cells occur in Norwegian IBS patients, but not in Thai IBS patients. In both Norwegian and Thai IBS patients the mature endocrine cells seem to switch off the expression of certain hormones and switch on others.
Disclosure statement
The authors have no conflicts of interest to declare.
Additional information
Funding
References
- El-Salhy M. Irritable bowel syndrome: diagnosis and pathogenesis. World J Gastroenterol. 2012;18:5151–5163.
- El-Salhy M. Recent developments in the pathophysiology of irritable bowel syndrome. World J Gastroenterol. 2015;21:7621–7636.
- El-Salhy M, Hausken T, Gilja OH, et al. The possible role of gastrointestinal endocrine cells in the pathophysiology of irritable bowel syndrome. Expert Rev Gastroenterol Hepatol. 2017;11:139–148.
- Xiong LS, Chen MH, Chen HX, et al. A population-based epidemiologic study of irritable bowel syndrome in South China: stratified randomized study by cluster sampling. Aliment Pharmacol Ther. 2004;19:1217–1224.
- Gwee KA, Lu CL, Ghoshal UC. Epidemiology of irritable bowel syndrome in Asia: something old, something new, something borrowed. J Gastroenterol Hepatol. 2009;24:1601–1607.
- Ghoshal UC, Abraham P, Bhatt C, et al. Epidemiological and clinical profile of irritable bowel syndrome in India: report of the Indian Society of Gastroenterology Task Force. Indian J Gastroenterol. 2008;27:22–28.
- Thompson WG, Irvine EJ, Pare P, et al. Functional gastrointestinal disorders in Canada: first population-based survey using Rome II criteria with suggestions for improving the questionnaire. Dig Dis Sci. 2002;47:225–235.
- Boyce PM, Koloski NA, Talley NJ. Irritable bowel syndrome according to varying diagnostic criteria: are the new Rome II criteria unnecessarily restrictive for research and practice? Am J Gastroenterol. 2000;95:3176–3183.
- Mearin F, Badia X, Balboa A, et al. Irritable bowel syndrome prevalence varies enormously depending on the employed diagnostic criteria: comparison of Rome II versus previous criteria in a general population. Scand J Gastroenterol. 2001;36:1155–1161.
- Hoseini-Asl MK, Amra B. Prevalence of irritable bowel syndrome in Shahrekord, Iran. Indian J Gastroenterol. 2003;22:215–216.
- Shah SS, Bhatia SJ, Mistry FP. Epidemiology of dyspepsia in the general population in Mumbai. Indian J Gastroenterol. 2001;20:103–106.
- El-Salhy M, Gundersen D, Gilja OH, et al. Is irritable bowel syndrome an organic disorder? World J Gastroenterol. 2014;20:384–400.
- El-Salhy M, Seim I, Chopin L, et al. Irritable bowel syndrome: the role of gut neuroendocrine peptides. Front Biosci (Elite Ed). 2012;4:2783–2800.
- El-Salhy M, Hatlebakk JG, Hausken T. Reduction in duodenal endocrine cells in irritable bowel syndrome is associated with stem cell abnormalities. World J Gastroenterol. 2015;21:9577–9587.
- El-Salhy M, Gilja OH. Abnormalities in ileal stem, neurogenin 3, and enteroendocrine cells in patients with irritable bowel syndrome. BMC Gastroenterol. 2017;17:90.
- Montgomery RK, Breault DT. Small intestinal stem cell markers. J Anat. 2008;213:52–58.
- Potten CS, Booth C, Tudor GL, et al. Identification of a putative intestinal stem cell and early lineage marker; musashi-1. Differentiation. 2003;71:28–41.
- Kayahara T, Sawada M, Takaishi S, et al. Candidate markers for stem and early progenitor cells, Musashi-1 and Hes1, are expressed in crypt base columnar cells of mouse small intestine. FEBS Lett. 2003;535:131–135.
- Wang J, Cortina G, Wu SV, et al. Mutant neurogenin-3 in congenital malabsorptive diarrhea. N Engl J Med. 2006;355:270–280.
- Jenny M, Uhl C, Roche C, et al. Neurogenin3 is differentially required for endocrine cell fate specification in the intestinal and gastric epithelium. EMBO J. 2002;21:6338–6347.
- Lee CS, Perreault N, Brestelli JE, et al. Neurogenin 3 is essential for the proper specification of gastric enteroendocrine cells and the maintenance of gastric epithelial cell identity. Genes Dev. 2002;16:1488–1497.
- El-Salhy M, Danielsson A, Stenling R, et al. Colonic endocrine cells in inflammatory bowel disease. J Intern Med. 1997;242:413–419.
- El-Salhy M, Mazzawi T, Hausken T, et al. Interaction between diet and gastrointestinal endocrine cells. Biomed Rep. 2016;4:651–656.
- El-Salhy M, Sandstrom O, Nasstrom E, et al. Application of computer image analysis in endocrine cell quantification. Histochem J. 1997;29:249–256.
- El-Salhy M, Patcharatrakul T, Hatlebakk JG, et al. Chromogranin A cell density in the large intestine of Asian and European patients with irritable bowel syndrome. Scand J Gastroenterol. 2017;52:691–697.
- Gershon MD. Plasticity in serotonin control mechanisms in the gut. Curr Opin Pharmacol. 2003;3:600–607.
- Gershon MD. 5-Hydroxytryptamine (serotonin) in the gastrointestinal tract. Curr Opin Endocrinol Diabetes Obes. 2013;20:14–21.
- El-Salhy M, Hatlebakk JG, Gilja OH, et al. Densities of rectal peptide YY and somatostatin cells as biomarkers for the diagnosis of irritable bowel syndrome. Peptides. 2015;67:12–19.
- Spiller RC, Trotman IF, Adrian TE, et al. Further characterisation of the ‘ileal brake’ reflex in man–effect of ileal infusion of partial digests of fat, protein, and starch on jejunal motility and release of neurotensin, enteroglucagon, and peptide YY. Gut. 1988;29:1042–1051.
- Spiller RC, Trotman IF, Higgins BE, et al. The ileal brake–inhibition of jejunal motility after ileal fat perfusion in man. Gut. 1984;25:365–374.
- El-Salhy M, Grimelius L, Wilander E, et al. Immunocytochemical identification of polypeptide YY (PYY) cells in the human gastrointestinal tract. Histochemistry. 1983;77:15–23.
- Spangeus A, Forsgren S, el-Salhy M. Does diabetic state affect co-localization of peptide YY and enteroglucagon in colonic endocrine cells? Histol Histopathol. 2000;15:37–41.
- Barker N, Clevers H. Tracking down the stem cells of the intestine: strategies to identify adult stem cells. Gastroenterology. 2007;133:1755–1760.
- Barker N, van de Wetering M, Clevers H. The intestinal stem cell. Genes Dev. 2008;22:1856–1864.
- Cheng H, Leblond CP. Origin, differentiation and renewal of the four main epithelial cell types in the mouse small intestine. V. Unitarian Theory of the origin of the four epithelial cell types. Am J Anat. 1974;141:537–561.
- He XC, Yin T, Grindley JC, et al. PTEN-deficient intestinal stem cells initiate intestinal polyposis. Nat Genet. 2007;39:189–198.
- Fishbein TM, Novitskiy G, Lough DM, et al. Rejection reversibly alters enteroendocrine cell renewal in the transplanted small intestine. Am J Transplant. 2009;9:1620–1628.
- Schonhoff SE, Giel-Moloney M, Leiter AB. Minireview: development and differentiation of gut endocrine cells. Endocrinology. 2004;145:2639–2644.
- Schonhoff SE, Giel-Moloney M, Leiter AB. Neurogenin 3-expressing progenitor cells in the gastrointestinal tract differentiate into both endocrine and non-endocrine cell types. Dev Biol. 2004;270:443–454.
- El-Salhy M, Gilja OH, Gundersen D, et al. Duodenal chromogranin a cell density as a biomarker for the diagnosis of irritable bowel syndrome. Gastroenterol Res Pract. 2014;2014:462856.
- Unlusoy AA, Egritas Gurkan O, Sari S, et al. Mutant neurogenin-3 in a Turkish boy with congenital malabsorptive diarrhea. Pediatr Int. 2016;58:379–382.
- Jensen JN, Rosenberg LC, Hecksher-Sorensen J, et al. Mutant neurogenin-3 in congenital malabsorptive diarrhea. N Engl J Med. 2007;356:1781–1782.
- El-Salhy M, Mazzawi T, Gundersen D, et al. Chromogranin A cell density in the rectum of patients with irritable bowel syndrome. Mol Med Rep. 2012;6:1223–1225.
- Svendsen B, Holst JJ. Regulation of gut hormone secretion. Studies using isolated perfused intestines. Peptides. 2016;77:47–53.
- Svendsen B, Pedersen J, Albrechtsen NJ, et al. An analysis of cosecretion and coexpression of gut hormones from male rat proximal and distal small intestine. Endocrinology. 2015;156:847–857.
- Egerod KL, Engelstoft MS, Grunddal KV, et al. A major lineage of enteroendocrine cells coexpress CCK, secretin, GIP, GLP-1, PYY, and neurotensin but not somatostatin. Endocrinology. 2012;153:5782–5795.