
Abstract
Objectives: To quantify healthcare resource use (HRU) and costs in relation to carcinoid syndrome (CS) and carcinoid heart disease (CHD) in a real-world setting, and to provide perspective on treatment patterns.
Materials and methods: Patient data and HRU were collected retrospectively from three Swedish healthcare registers. Adult patients diagnosed with metastatic gastroenteropancreatic neuroendocrine tumors (GEP-NETs) grade 1 or 2 and CS who purchased somatostatin analogs (SSAs), and experienced controlled (defined by SSAs use) and uncontrolled (defined by SSAs dose escalation) CS for ≥8 months during the study period were included. Patients diagnosed with CHD from the date of the GEP-NET diagnosis were included in the CHD study group.
Results: Overall, total HRU cost increased with uncontrolled CS and CHD. Total resource cost was 15,500€/patient during controlled CS (8 months), rising to 21,700€/patient during uncontrolled CS (8 months), representing an increase of ∼40% (6200€/patient). Costs/patient were driven mainly by SSA use, tumor-related medical interventions and examinations. The total mean cost/year of disease was 1100€/patient without CHD, compared to 4600€/patient with CHD, a difference of 3500€/patient. Excluding SSA cost burden, the main drivers of increased cost in CHD patients were surgical interventions and echocardiography.
Conclusions: This study provides a comprehensive overview of the treatment patterns and burden of uncontrolled CS symptoms and CHD using Swedish national register data. Increases in medical interventions and examinations HRU and increased SSA use suggest that SSA dose escalation alone may not effectively control the symptoms associated with uncontrolled CS, highlighting an unmet treatment need in this patient group.
Introduction
Gastroenteropancreatic neuroendocrine tumors (GEP-NETs) are a rare form of neoplasms found predominantly in the gastrointestinal tract, representing approximately 2% of all gastrointestinal malignant tumors [Citation1]. The approximate prevalence of GEP-NETs is 0.048% [Citation2,Citation3]. Approximately 6–19% [Citation4–6] of patients diagnosed with GEP-NETs will develop carcinoid syndrome (CS), a condition resulting from the secretion of serotonin and other vasoactive substances by the tumor. CS is characterized by a range of symptoms, including flushing episodes and diarrhea, that can have a profound impact on quality of life [Citation7,Citation8].
Between 20% and 50% of CS patients may also develop carcinoid heart disease (CHD) [Citation9], characterized by right-sided valvular lesions. Though the pathogenetic mechanisms of CHD have yet to be fully elucidated, it is now believed that the secretion of serotonin by the tumor leads to the deposition of plaques primarily on the right side of the heart. These plaques are composed of myofibroblasts, smooth muscle cells and extracellular matrix components, resulting in fibrosis, and can potentially lead to right heart valve dysfunction and life-threatening heart failure [Citation8].
Somatostatin analogs (SSAs) are currently the standard of care in CS, as their anti-proliferative effect can inhibit tumor growth and their inhibition of hormone secretion relieves CS symptoms [Citation7,Citation10]. Long-acting SSAs are typically prescribed, with short-acting SSAs used as rescue therapy. Dose escalation of SSAs is possible, based on the severity of symptoms [Citation7,Citation10–19]. However, approximately 10–30% of patients may become refractory to treatment and experience recurrent diarrhea and/or flushing episodes whilst on SSAs [Citation20]. Recently, telotristat ethyl, a novel tryptophan hydroxylase inhibitor, was approved in the US and EU for the treatment of patients with CS whose diarrhea symptoms are inadequately controlled by SSAs [Citation21]. It is likely that this treatment may be used increasingly to control refractory symptoms [Citation17].
Currently, limited data are available on the clinical practice, healthcare resource burden and costs associated with uncontrolled/refractory (i.e., requiring escalation of SSAs) CS or CHD particularly in the real-world setting. A number of studies have examined the healthcare resource use (HRU) and costs associated with the treatment of GEP-NETs and CS in the US, but published data from the European setting, particularly with a focus on CS and CHD, are scarce [Citation22–27]. We conducted an observational, retrospective study to explore and quantify HRU and costs in relation to both controlled and uncontrolled CS, and CHD in the real-world setting, among patients diagnosed with metastatic GEP-NETs grade 1 or 2, in Sweden. The study also examined the treatment patterns of uncontrolled CS and CHD, where the treatment of patients is usually individualized.
Methods
Study design and patient inclusion criteria
This retrospective, observational study was performed in Sweden due to the comprehensive individual level data in national registers and databases, and the use of unique national personal identification numbers enabling register-linkage with high precision. The study was based on data collected for the Swedish Observational study on Neuroendocrine tumors of the Gastroenteropancreatic organs (SONG) project, which was approved by the Regional Ethical Review Board in Gothenburg (Dnr 218-15). No further ethical review was required.
Adults with a diagnosis of metastatic GEP-NETs of grade 1 or 2 during the study period, and a main/secondary diagnosis of CS (ICD-10 code E34.0) who also used short- or long-acting SSAs (i.e., octreotide/lanreotide), and whose CS symptoms were controlled (during ≥8 months) and uncontrolled (during ≥8 months) were included. Patients with a diagnosis of CHD (ICD-10 code I36, I37 or I39.2; at any date from GEP-NET diagnosis) were excluded from the principal analyses, but included in the sub-study.
The principal analyses examined treatment patterns, HRU and costs of controlled and uncontrolled CS by assessing and comparing resource use and costs during the 8-month period before and the 8-month period after CS of patients on SSAs became uncontrolled. A sub-group analysis examined treatment patterns, HRU and costs of CHD by assessing and comparing resource use and costs in CS patients with and without a diagnosis of CHD.
Study definitions
Patients were generally initiated on short-acting SSAs, and a gradual switch to long-acting SSAs occurred during the study period. In patients with uncontrolled CS, guidelines endorse SSA dose escalation [Citation17]. In Sweden, a dose escalation in response to uncontrolled CS for patients on short-acting SSAs is usually to (at least) double the dose, and for long-acting SSAs, to shorten the time interval between injections from 28 days to 21 days. Rescue use with add-on of short-acting SSAs may also be used.
Patients with a diagnosis of CS who were using SSAs were, by default, defined as experiencing controlled CS; those with SSA dose escalation were defined as experiencing uncontrolled CS. Patients could not be defined as uncontrolled during the first 8 months after SSA initiation (the baseline period), to avoid the misclassification of initial dose titration as a dose increase in response to uncontrolled CS. The start date of controlled CS was set as the date of the first SSA purchase (if this occurred after the first CS diagnosis), or the first diagnosis of CS (if the first SSA purchase occurred before this date). Dose escalation of SSAs was defined as a ≥50% increase of dose amount/day (short-acting SSAs), or ≥25% increase of dose amount/day (long-acting SSAs), over a 4-month period compared to baseline, if the amount/day was not lower than baseline for subsequent periods.
Following fulfillment of the SSA dose escalation criteria, the start of uncontrolled CS was set as the date of: purchase of a prescribed antidiarrheal therapy, higher strength of same-type SSA than previously purchased, short-acting SSA fulfilling the definition of ‘rescue use’ (defined below); liver-directed therapy (i.e., surgery, hepatic artery embolization, radiofrequency ablation) or healthcare visit with main diagnosis of CS, primary tumor or liver metastases. For patients without any of these events (within the first 4-month period of dose escalation or within 2 months prior to the start of the first dose escalation time period), the start date of uncontrolled CS was defined as the median time from the date of dose escalation among the patients who had any of the above listed events.
Rescue use was defined among patients who had initiated/switched to long-acting SSAs, and ≥6 months thereafter purchased short-acting SSAs, and also required that after the purchase of short-acting SSAs, long-acting SSAs were purchased again, and that one or more additional purchases of short-acting SSAs were made within 2 months from the previous short-acting SSA purchase.
Data sources
The following three national Swedish registries were used to obtain data covering the period 1 July 2005–31 December 2013:
The Cancer Register provided data on cancer diagnoses, patient demographics, clinical characteristics and time and cause of death.
The National Patient Register provided HRU data on:
surgical interventions (primary tumor and/or metastatic sites [primary analysis], valve replacement [CHD sub-analysis]),
tumor- or CHD-related medical interventions (i.e., locoregional interventions, such as hepatic artery embolization and radiofrequency ablation, peptide receptor radionuclide therapy, external radiotherapy, drug administration [primary analysis]; drug administration, electrical cardioversion [CHD sub-analysis]),
tumor- or CHD-related examinations (e.g., laboratory tests, laparotomy, biopsy, colonoscopy [primary analysis]; electrocardiogram, blood pressure, telemetry, orthostatic tests, percutaneous oximetry, spirometry [CHD sub-analysis]),
imaging (e.g., scintigraphy, computerized tomography [CT] scans, ultrasound, liver angiography [primary analysis]; CT scans, echocardiography, X-rays, ultrasound, coronary angiography, magnetic resonance tomography [CHD sub-analysis]),
outpatient visits with none of the above defined procedures (i.e., where the main diagnosis was GEP-NETs, metastasis, or CS [primary analysis]; with the main diagnosis as CHD, atrial fibrillation, right-sided or unspecified heart failure [CHD sub-analysis]),
inpatient admissions with none of the above defined procedures (i.e., where the main diagnosis was GEP-NETs, metastasis or CS [primary analysis]; with the main diagnosis as CHD, atrial fibrillation, right-sided or unspecified heart failure [CHD sub-analysis]).
It should be noted that any procedures (i.e., surgical or medical interventions) requiring hospital care were counted and costed under the intervention category, and not double-counted as outpatient or inpatient admissions.
3. The Swedish Prescribed Drug Register was used to obtain all data on prescribed drugs purchased at a pharmacy (i.e., SSAs, interferon α, chemotherapy, targeted therapy, antidiarrheals [primary analysis]; digitalis glycosides, class III antiarrhythmics, diuretics, angiotensin-converting enzyme inhibitors, angiotensin II antagonists [CHD sub-analysis]).
All codes for diagnoses, procedures and treatments were validated by clinicians. All costs were collected in Swedish kronor (SEK) and converted to Euros (€), using the 2015 exchange rate (1€ = 9.357 SEK). Linkage between registers was performed using the Swedish national personal identification numbers (personnummer), which were replaced with neutral numbers to protect patients’ privacy before the data were received by the researchers.
Statistical analyses
The difference in resource use and costs per patient during 8 months before and 8 months after the start of uncontrolled CS was tested using the Wilcoxon Signed Rank test for continuous variables. The 8-month period was chosen because the sample size was considered too small when requiring a 1-year follow-up. In the sub-analysis, the Mann–Whitney U test for continuous variables, Fisher’s exact test for dichotomous variables, or Chi-square test for non-ordinal categorical variables were used to test the difference in resource use and costs between patients with and without CHD.
All tests were exploratory, two-tailed, and conducted at the α = 0.05 significance level. All analyses were performed using SAS® v9.4 software (Cary, NC).
Results
Patient disposition, characteristics and treatment patterns
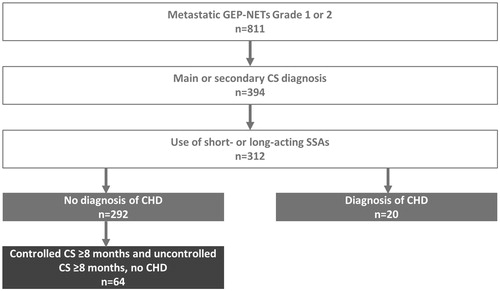
During the study period, 811 patients were identified in Sweden as having a diagnosis of metastatic GEP-NET of grade 1 or 2 (). In this population, 312 patients had a main or secondary diagnosis of CS, and used short- or long-acting SSAs. Of these patients, 21% (n = 64/312) experienced at least 8 months of both controlled and uncontrolled CS symptoms, did not have a diagnosis of CHD, and were included in the principal analyses ().
Figure 1. Selection of the study population. CHD: carcinoid heart disease; CS: carcinoid syndrome; GEP-NETs: gastroenteropancreatic neuroendocrine tumors; SSAs: somatostatin analogs.
The mean (SD) age of patients when they became uncontrolled in their CS was 65.5 (12.2) years; 53% (n = 34/64) were 65 years of age or older (). The median (min; max) time from diagnosis of GEP-NET to the diagnosis of CS was 0.9 (0.0; 37.0) months, and the median time from CS diagnosis to the start of uncontrolled CS was 24.0 (8.4; 74.9) months (). The majority (n = 59/64; 92%) of the patients had small intestinal NETs, and 71% (n = 25/35) had a diagnosis of liver metastases within 6 months of receiving the GEP-NETs diagnosis (). Our data show that one-third (n = 103/312; 33%) of CS patients who had purchased SSAs experienced dose escalation during the study period. At the start of experiencing CS symptoms, three-quarters (n = 48/64) of patients were on long-acting SSAs, with the remaining one-quarter (n = 16/64) of patients using short-acting SSAs ().
Table 1. Patient demographics and characteristics.
In the CHD sub-analysis, we found that 6.4% (n = 20/312) of CS patients had a diagnosis of CHD (). The mean (SD) age of patients with CHD when they were diagnosed with CS was 61.1 (11.4) years, with 35% (n = 7/20) of patients 65 years of age or older. Just over half (n = 12/20, 60%) were male (). The median (min; max) time from GEP-NETs diagnosis to CHD diagnosis was 9.2 (1.3; 63.3) months, with the median time from CHD diagnosis to death 13.4 (1.3; 54.9, [n = 8]) months (). The majority of patients (≥75%; exact numbers not reported to protect patient privacy) with CHD had their primary tumor in the small intestine (). Most patients with CHD purchased SSAs at the start of their CS, with 25–50% and 50–75% (exact numbers not reported) on short-acting and long-acting SSAs, respectively ().
Healthcare resource use and cost burden in controlled and uncontrolled CS
In the 8 months that patients were controlled in their CS symptoms, the total healthcare resource costs were €992,600, representing a cost of €15,500 per patient. Of the total healthcare resource costs during the 8-month controlled period, SSAs (64.9%; €664,054), inpatient admissions with none of the defined procedures (13.4%; €133,158) and interferon α drugs (7.1%; €70,441) comprised the majority of costs (). There was a general trend of total healthcare resource cost increases when patients experienced uncontrolled CS, with total healthcare resource costs rising to €1,388,700, representing a cost of €21,700 per patient. Although the absolute cost was higher, the relative contribution of the cost of SSAs (56.1%; €779,000) and inpatient admissions (9.7%; €135,037) was lower than during the controlled period, and the relative contribution of the cost were higher for medical interventions (13.4%; €185,859, from 5.8% and €57,725 in the controlled period), tumor-related examinations (5.2%; €71,589, from 0.4% and €4367 in the controlled period), and surgical interventions (4.8%; €67,093 from 1.6% and €15,793 in the controlled period) (; Supplementary Table 1).
Figure 2. Distribution of total healthcare resource costs in controlled and uncontrolled carcinoid syndrome. (A) Controlled and uncontrolled carcinoid syndrome (n = 64). (B) Total healthcare resource costs per patient (n = 64). Other includes: inpatient admissions (during which no tumor-related interventions were performed) and some prescribed drugs (chemotherapy, targeted therapy, therapy for diarrhea). CI: confidence interval; CS: carcinoid syndrome; SSAs: somatostatin analogs; IFNα: interferon alpha.
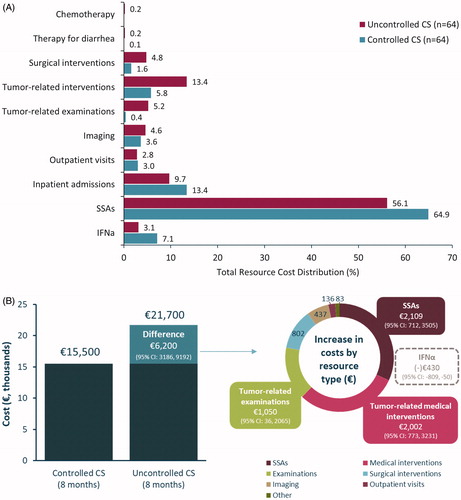
On a per-patient basis, the increase in cost burden represented a rise from €15,500 to €21,700 per patient, and a difference of €6200 (95% CI: 3186, 9292), i.e., an increase of approximately 40% compared to the period of controlled CS. The largest increase in absolute cost was observed for SSAs (€2109; 95% CI: 712, 3505; p < .0001), followed by tumor-related medical interventions (€2002; 95% CI: 773, 3231; p = .0003) and tumor-related examinations (€1050; 95% CI: 36, 2065; p = .070) ( and ). There was a decrease in costs seen in interferon α drugs during the 8 months that patients experienced uncontrolled CS, both with regards to the total cost burden (3.1%; €42,949, from 7.1%; €70,441 during the controlled period) (Supplementary Table 1), as well as the mean per-patient cost difference (−430€; 95% CI: −809.3, −49.8; p = .010) (). In addition to increases seen in the cost burden of HRU, a general increase in per-patient resource use between the controlled to the uncontrolled periods was observed. Few changes were statistically significant, except for the increase observed in tumor-related medical interventions (mean [SD] resources per patient; controlled CS: 0.172 [0.490]; uncontrolled CS: 0.438 [0.906]; p = .0061) (Supplementary Table 2). One-third (33%; n = 21/64) of patients during the controlled CS period and 39% (25/64) of patients during the uncontrolled CS period were using antidiarrheals. One-third (33%; 21/64) of patients were using interferon α drugs during the controlled CS period, compared to 20% (13/64) of patients during the uncontrolled CS period, which explains the decrease in costs observed during the uncontrolled CS period (Supplementary Table 3).
Table 2. Healthcare resource costs (€) per patient for controlled and uncontrolled carcinoid syndrome.
Healthcare resource use and cost burden in CHD
Healthcare resource costs were generally higher in patients with CHD compared to patients without CHD (). The main contributors of cost burden (per patient) in those without CHD were imaging (echocardiography: €112, all other imaging: €526) and examinations (€367) ( and ). In patients with CHD, imaging continued to contribute to a high proportion of the annual cost, with both echocardiography (€1034) and all other imaging (€840) costs increased. The cost burden of surgical interventions (such as valve replacement surgery) was also high in CHD patients (€2068), in comparison to the cost of surgical interventions (valve replacement surgery) in patients without CHD, which was zero (). Excluding the cost burden of SSAs, the mean cost per patient per year of disease for patients without CHD was €1100, and €4600 with CHD, a difference of €3500. The main drivers of elevated costs (excluding SSAs) in CHD were surgical interventions (i.e., valve replacement surgery) and echocardiography (). Mean resource use in patients with CHD tended to be higher than in those without CHD, with statistically significant differences seen in surgical interventions (p < .001), CHD-related examinations (p = .047), imaging (including echocardiography [p < .001]), outpatient visits (p = .002) and prescribed digitalis glycosides (p = .009), antiarrhythmics (p = .012) and diuretics (p < .001) (Supplementary Table 4). The total number of resources and the number of patients using each resource, by CHD disease status, are presented in Supplementary Table 5.
Figure 3. Healthcare resource use costs (€) per year of disease in patients with and without CHD. (A) Distribution of mean cost per year/patient in those without (n = 292) and with CHD (n = 20). (B) Total average cost per year of CHD per patient. Other imaging includes: carcinoid heart disease-related CT scans, X-rays, and other; Other medications include: digitalis glycoside, antiarrhythmics (class III), diuretics, beta-blocking agents, ACE inhibitors, and angiotensin II antagonists; SSAs are not included in these results. ACE: angiotensin-converting enzyme; CHD: carcinoid heart disease; CT: computed tomography; SSA: somatostatin analogs.
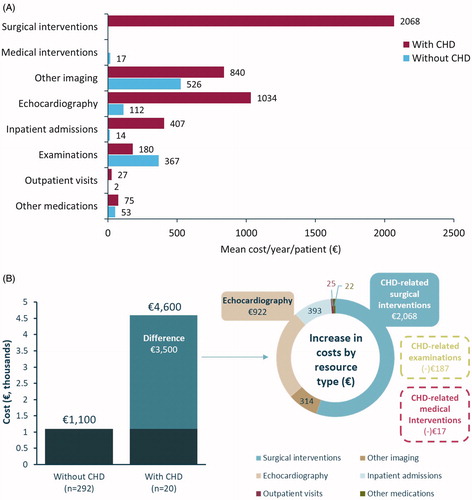
Table 3. Healthcare resource costs (€) per patient per year by carcinoid heart disease status.
Discussion
One-third of patients with CS who purchased SSAs appeared to experience dose escalation, a figure consistent with previous reports that 30% of patients experience inadequate control of their CS symptoms whilst on SSAs [Citation20]. The recently approved telotristat ethyl has been shown to reduce bowel movement frequency in patients whose symptoms are inadequately controlled by SSAs [Citation21]; the increasing use of this treatment may begin to address this unmet need.
Our study found that the cost burden of uncontrolled CS symptoms was considerably greater (40%) compared to controlled CS (€6200 per patient), and was mainly driven by SSAs (by definition), but an associated rise in tumor-related examinations and medical interventions was also seen. Over time, patient response to the effects of SSAs may diminish [Citation21]. Due to a lack of effective treatment options, invasive medical interventions targeting the tumor load are likely to be used to decrease the serotonin secretion and control symptoms. However, there are only a few small, retrospective studies that have evaluated the efficacy of surgically reducing tumor volume [Citation28]. Patients may undergo more examinations if their condition deteriorates, hence a rise in tumor-related examinations is seen. If tumor progression is identified, there is likely to be an associated rise in tumor-related interventions to stabilize tumor growth and control symptoms.
Despite the burden of diarrhea, only 33% of patients with controlled CS and 39% of patients with uncontrolled CS were using antidiarrheals, and the absolute number of prescribed drug purchases for antidiarrheals increased by 50 purchases during the uncontrolled CS period. The increase between the two periods could be perceived as lower than expected; the antidiarrheals may not have had an effect during the early stages of treatment, which could have led to a negative connotation with treatment. Patients may also have been purchasing antidiarrheals without a prescription, for example, loperamide. Alternatively, patients may have stopped taking antidiarrheals if the medication was no longer effective as the disease progressed.
We also found that patients with CHD had a higher cost burden of disease (€3500 per year) compared to patients without CHD. The increases in costs were driven mainly by surgical interventions (i.e., valve replacement) and echocardiography in CHD patients. Of the patients diagnosed with CHD, only 30% (n = 6/20) received surgical intervention (i.e., valve replacement) – the only curative option for affected valves and improves CHD-related symptoms [Citation8]. Diuretics were the cardiac drug most commonly used by CHD patients (85%).
The general trend was an increase in resource use both from the controlled to the uncontrolled period, and in patients with CHD compared to those without, for nearly all resource categories. However, few of these increases were statistically significant, perhaps due to the limited number of patients (292 patients without CHD, compared to only 20 CHD patients) and resources, which must be considered when interpreting the data. It should also be noted that costs and resource burden of inpatient admissions appears low; any interventions (e.g., surgery) requiring an inpatient stay were counted as that intervention, and not double-counted as an inpatient admission.
The main strength of our study was the use of real-world data from national registers, with high precision linkage between registers. The patterns of resource use are generally in agreement with expected patterns, thus strengthening the validity of the applied definitions and diagnostic codes, which were validated by clinical experts.
Limitations of this study included the fact that the register data on healthcare use includes specialized healthcare only, therefore, the costs of primary healthcare are not covered. Data on drugs encompassed the drugs prescribed and purchased by the patient at a pharmacy (e.g., SSAs), with limited or no data available on drugs provided directly in connection with administration (e.g., chemotherapy). Anecdotal evidence suggests that interferon α use may be (or was during the study period) higher in Sweden than in the rest of the world. Data on non-prescription drugs purchased over-the-counter were not available.
The Swedish Prescribed Drug Register does not give detail on the intended dosage of medications; therefore, it is difficult to discern precisely when the dose of SSA increased and what factors contributed to this rise. The Swedish reimbursement system allows patients to purchase 3 months’ supply of medicines at each occasion, and make their next purchase when two-thirds of the previously purchased amount has assumedly been consumed. The level of subsidy increases in a step-wise fashion; once a patient has paid ∼€200 during a reimbursement period (1 year from first purchase), additional medicines are then purchased at no cost during the remainder of the period. Patients may stockpile medicines during periods of high subsidy, which could lead to variations in drug purchase patterns that may not be driven by medical, but instead by economic reasons.
Furthermore, the use of drug purchase patterns from the Swedish Prescribed Drug Register to define the start of uncontrolled CS symptoms may have resulted in the misclassification of controlled CS patients as uncontrolled CS patients, particularly as the indication for SSAs expanded to include its anti-tumor/anti-proliferative effects for small intestinal NETs in 2009 [Citation29] and other types of NETs in 2014 [Citation30]. When prescribed for anti-tumor effects, the maximum SSA dose is recommended. This may partially account for any increases in SSA purchases. Nevertheless, our findings are similar to the 30% of patients experiencing uncontrolled CS as reported in the literature [Citation7], so it is possible that the SSA label expansion did not contribute in a meaningful manner to our observations. There was also a risk of bias due to the potentially higher level of tumor progression among patients with uncontrolled or refractory CS that could have affected resource use and cost burden.
We were not able to include primary healthcare costs or any visits to healthcare providers other than physicians; this was not recorded in the registries. It is therefore possible that we may have underestimated the overall cost burden of the disease to the healthcare system. It is also possible that inaccuracies in medical coding and the limited range of ICD-10 codes may have led to under- or overestimations of resource use, cost burden, as well as size of the target population. Finally, due to the rarity of GEP-NET, CS and CHD, the limited number of patients and events we were able to include in our study limited the range of statistical analysis, which may explain the lack of statistical significance. Equally, no power calculations were performed, and all tests were exploratory in nature.
We also note that the data collection period of this study (1 July 2005–31 December 2013) is a limitation. Access to up-to-date data was not possible, due to time taken to process data requests and the time required for the most recent data to become available in the registers. Since 2013, clinical practice for the treatment of GEP-NETs, CS and CHD has evolved [Citation31,Citation32]. Nevertheless, this study provides a comprehensive overview of the treatment patterns, and burden of uncontrolled CS symptoms and CHD using Swedish national register data. These are rare diseases, and treatment choices are generally individualized; thus, our results provide a valuable and novel insight into disease management in the real-world setting. Our finding that increases in HRU of medical interventions and examinations in parallel with increased SSA use suggest that SSA dose escalation alone may not be enough to effectively control the range of symptoms associated with uncontrolled CS. This highlights an unmet need in this patient group that may be addressed by new treatments targeting these symptoms.
Supplemental Material
Download PDF (111.7 KB)Acknowledgements
The authors thank Sarah Dawson, PhD, and Julia Bárdos, PhD (Costello Medical, Cambridge, UK), for medical writing support and editorial assistance in preparing this manuscript for publication, based on the authors’ input and direction, with funding from Ipsen Pharma (Boulogne-Billancourt, France).
Disclosure statement
Åse Björstad and Ingela Björholt: Employees of PharmaLex, previously known as Nordic Health Economics AB.
Eva Lesén and Tom Marlow: Employees of Nordic Health Economics AB, at the time of study conduct and development of the manuscript.
Entela Bollano: None declared.
Marion Feuilly and Florence Marteau: Employees of Ipsen.
Staffan Welin: None declared.
Anna-Karin Elf: None declared.
Viktor Johanson: None declared.
Additional information
Funding
References
- Warner RR. Enteroendocrine tumors other than carcinoid: a review of clinically significant advances. Gastroenterology. 2005;128:1668–1684.
- Dasari A, Shen C, Halperin D, et al. Trends in the incidence, prevalence, and survival outcomes in patients with neuroendocrine tumors in the United States. JAMA Oncol. 2017;3:1335–1342.
- Modlin IM, Oberg K, Chung DC, et al. Gastroenteropancreatic neuroendocrine tumours. Lancet Oncol. 2008;9:61–72.
- Soga J. Carcinoids and their variant endocrinomas. An analysis of 11842 reported cases. J Exp Clin Cancer Res. 2003;22:517–530.
- Tomassetti P, Migliori M, Lalli S, et al. Epidemiology, clinical features and diagnosis of gastroenteropancreatic endocrine tumours. Ann Oncol. 2001;12:S95–S99.
- Halperin DM, Shen C, Dasari A, et al. Frequency of carcinoid syndrome at neuroendocrine tumour diagnosis: a population-based study. Lancet Oncol. 2017;18:525–534.
- Dimitriadis GK, Weickert MO, Randeva HS, et al. Medical management of secretory syndromes related to gastroenteropancreatic neuroendocrine tumours. Endocr Relat Cancer. 2016;23:R423–R436.
- Grozinsky-Glasberg S, Grossman AB, Gross DJ. Carcinoid heart disease: from pathophysiology to treatment – 'something in the way it moves'. Neuroendocrinology. 2015;101:263–273.
- Davar J, Connolly HM, Caplin ME, et al. Diagnosing and managing carcinoid heart disease in patients with neuroendocrine tumors: an expert statement. J Am Coll Cardiol. 2017;69:1288–1304.
- Faiss S, Pape UF, Bohmig M, et al. Prospective, randomized, multicenter trial on the antiproliferative effect of lanreotide, interferon alfa, and their combination for therapy of metastatic neuroendocrine gastroenteropancreatic tumors – the International Lanreotide and Interferon Alfa Study Group. J Clin Oncol. 2003;21:2689–2696.
- Broder MS, Beenhouwer D, Strosberg JR, et al. Gastrointestinal neuroendocrine tumors treated with high dose octreotide-LAR: a systematic literature review. World J Gastroenterol. 2015;21:1945–1955.
- Khan MS, El-Khouly F, Davies P, et al. Long-term results of treatment of malignant carcinoid syndrome with prolonged release Lanreotide (Somatuline Autogel). Aliment Pharmacol Ther. 2011;34:235–242.
- National Comprehensive Cancer Network. Neuroendocrine Tumors. NCCN Clinical Practice Guidelines in Oncology. 2017 [cited Sep 2017]. Available from: https://www.nccn.org/professionals/physician_gls/pdf/neuroendocrine.pdf.
- Strosberg J, Weber J, Feldman M, et al. Above-label doses of octreotide-LAR in patients with metastatic small intestinal carcinoid tumors. Gastrointest Cancer Res. 2013;6:81–85.
- Strosberg JR, Benson AB, Huynh L, et al. Clinical benefits of above-standard dose of octreotide LAR in patients with neuroendocrine tumors for control of carcinoid syndrome symptoms: a multicenter retrospective chart review study. Oncologist. 2014;19:930–936.
- Weber JM, Feldman M, Kvols L, et al. Above-label doses of octreotide-LAR in patients with metastatic small-intestinal carcinoid tumors. J Clin Oncol. 2012;30:e14579.
- Pavel M, O’Toole D, Costa F, et al. ENETS consensus guidelines update for the management of distant metastatic disease of intestinal, pancreatic, bronchial neuroendocrine neoplasms (NEN) and NEN of unknown primary site. Neuroendocrinology. 2016;103:172–185.
- Oberg K, Kvols L, Caplin M, et al. Consensus report on the use of somatostatin analogs for the management of neuroendocrine tumors of the gastroenteropancreatic system. Ann Oncol. 2004;15:966–973.
- de Herder WW. When and how to use somatostatin analogues. Endocrinol Metab Clin North Am. 2018;47:549–555.
- Pavel M, Baudin E, Couvelard A, et al. ENETS consensus guidelines for the management of patients with liver and other distant metastases from neuroendocrine neoplasms of foregut, midgut, hindgut, and unknown primary. Neuroendocrinology. 2012;95:157–176.
- Kulke MH, O'Dorisio T, Phan A, et al. Telotristat etiprate, a novel serotonin synthesis inhibitor, in patients with carcinoid syndrome and diarrhea not adequately controlled by octreotide. Endocr Relat Cancer. 2014;21:705–714.
- Ayyagari R, Neary M, Li S, et al. Comparing the cost of treatment with octreotide long-acting release versus lanreotide in patients with metastatic gastrointestinal neuroendocrine tumors. Am Health Drug Benefits. 2017;10:408–415.
- Ortendahl JD, Pulgar SJ, Mirakhur B, et al. Budget impact of somatostatin analogs as treatment for metastatic gastroenteropancreatic neuroendocrine tumors in US hospitals. ClinicoEconomics and Outcomes Research: CEOR. 2017;9:495–503.
- Budget impact of somatostatin analogs (SSAs) as treatment for metastatic gastroenteropancreatic neuroendocrine tumors (mGEP-NETs) in US hospitals. Clin Adv Hematol Oncol. 2016;14:10–11.
- Broder MS, Cai B, Chang E, et al. First-line systemic treatment adherence, healthcare resource utilization, and costs in patients with gastrointestinal neuroendocrine tumors (GI NETs) in the USA. J Med Econom. 2018;21:821–826.
- Joish VN, Frech F, Lapuerta P. Budgetary impact of telotristat ethyl, a novel treatment for patients with carcinoid syndrome diarrhea: a US health plan perspective. Clin Ther. 2017;39:2338–2344.
- Joish VN, Frech F, Lapuerta P. Cost-effectiveness analysis of telotristat ethyl for treatment of carcinoid syndrome diarrhea inadequately controlled with somatostatin analogs. J Med Econom. 2018;21:182–188.
- Riechelmann RP, Pereira AA, Rego JFM, et al. Refractory carcinoid syndrome: a review of treatment options. Ther Adv Med Oncol. 2017;9:127–137.
- Rinke A, Müller H-H, Schade-Brittinger C, et al. Placebo-controlled, double-blind, prospective, randomized study on the effect of octreotide LAR in the control of tumor growth in patients with metastatic neuroendocrine midgut tumors: a report from the PROMID study group. J Clin Oncol. 2009;27:4656–4663.
- Caplin ME, Pavel M, Ćwikła JB, et al. Lanreotide in metastatic enteropancreatic neuroendocrine tumors. N Engl J Med. 2014;371:224–233.
- Zandee WT, de Herder WW. The evolution of neuroendocrine tumor treatment reflected by ENETS guidelines. Neuroendocrinology. 2018;106:357–365.
- Garcia-Carbonero R, Sorbye H, Baudin E, et al. ENETS consensus guidelines for high-grade gastroenteropancreatic neuroendocrine tumors and neuroendocrine carcinomas. Neuroendocrinology. 2016;103:186–194.
- ICD.Codes: ICD-10-CM Code K59.1 [cited March 2018]. Available from: https://icd.codes/icd10cm/K591