
Abstract
Objective: Glycoproteomics is an emerging subfield of proteomics. Tumor-specific variations in protein glycosylation might be potential targets for the development of new cancer diagnostics. Here, we performed high-throughput screening and targeted verification of glycome alterations in serum samples from patients with pancreatic cancer and the precancerous lesion intraductal papillary mucinous neoplasm (IPMN).
Material and methods: The glycosylation profile of 1000 proteins was mapped in a discovery cohort comprising serum samples from 16 individuals, including 8 patients with pancreatic cancer and 8 healthy controls. The top 10 glycoprotein biomarker candidates with the highest signal intensity difference in glycosylation levels were evaluated in a cohort consisting of 109 serum samples, including 49 patients with resectable pancreatic cancer, 13 patients with resectable noninvasive IPMN and 47 healthy controls, using a targeted assay.
Results: Multivariable analysis defined sets of panels comprising CA19-9 and distinctively glycosylated proteins for discrimination between pancreatic cancer, IPMN and healthy controls. A panel including CA 19-9, IL.17E, B7.1 and DR6 gave an AUC of 0.988 at 100% sensitivity at 90% specificity for the discrimination of stage 1 pancreatic cancer and healthy controls. B7.1 was found to be a valuable biomarker for differentiating between IPMN and healthy controls, with better performance alone than CA 19-9.
Conclusions: Measurement of protein glycosylation profiles in serum may aid in the early detection of pancreatic cancer and precursor lesions.
Introduction
Pancreatic cancer has the lowest survival rate among all major cancers. In Europe, the combined median survival for pancreatic cancer is less than 5 months and only 3% of patients survive beyond 5 years [Citation1]. The aggressive biology, resistance to therapy and the lack of valid screening methods contribute to the dismal prognosis [Citation2,Citation3]. Surgery is the only potentially curative treatment option, yet only about 15% of patients are deemed operable at the time of diagnosis [Citation4]. In the best scenario, with surgery and recent improvements in adjuvant chemotherapy, a median survival of 28 months is achievable [Citation5].
Intraductal papillary mucinous neoplasm (IPMN) is a cystic lesion of the pancreas that is considered a precursor to pancreatic cancer [Citation6]. Most IPMN cases are detected incidentally in asymptomatic individuals and the true prevalence is not known. IPMN may represent a clue to the early diagnosis and timely intervention of pancreatic cancer, as the resection of the lesion prior to the development of manifest cancer may significantly improve prognosis [Citation7]. However, currently there are no reliable noninvasive markers for pancreatic cancer or IPMN that can be used in a screening setting.
Carbohydrate antigen 19-9 (CA19-9) is the only clinically used blood-based biomarker for pancreatic cancer. CA 19-9 is a sialylated lacto-N-fucopentanose II sugar that is part of mucin-like molecules [Citation8]. As a conjunction to imaging, CA 19-9 can aid in the diagnostic workup for pancreatic cancer as well as for determining surgical intervention in suspected IPMN [Citation8,Citation9]. However, CA 19-9 is not recommended as a screening tool due to the relatively low sensitivity and specificity [Citation8].
Glycosylation is one of the most common posttranslational modifications of proteins in serum [Citation10]. The degree of glycosylation can be altered by various conditions, including cancer [Citation11–13]. Aberrant protein glycosylation may also be present prior to the diagnosis of manifest cancer [Citation14] and as such may represent a potential target for improving disease management. However, in routine clinical settings, large-scale evaluation of glycoprotein profiles in biological samples is still a challenge. In this study, we applied lectin array technology for screening of protein glycosylation moieties in serum to aid in early diagnosis of pancreatic cancer and precursor lesions.
Methods
Serum samples
Serum samples were prospectively collected from patients undergoing pancreatic resection for pancreatic cancer and IPMN at Skåne University Hospital, Lund, Sweden, between 2012 and 2017. Patients that had undergone preoperative radio- or chemotherapy were excluded. Invasive lesions were classified according to the American Joint Committee on Cancer TNM staging system, 8th edition [Citation15]. As controls, serum samples from healthy donors were obtained from the local blood donation center. Serum samples were stored in the local biobank at −80 °C until analysis. The study was approved by the Regional Human Ethics Committee at Lund University (dnr Ref 2017/320). Written informed consent was obtained from all subjects taking part in the study. The STROBE [Citation16] and STARD [Citation17] guidelines were followed where possible.
Glycosylation array
High-density screening was performed to simultaneously detect the glycosylation protein profile of 1000 human serum proteins using RayBio® Human Glycosylation Antibody Array 1000 (RayBiotech, Inc. Norcross, GA). Briefly, equal volumes of respective serum sample were incubated with glycan-deprived capturing antibodies arrayed on individual glass slides. Thereafter, a mixture of unique biotinylated lectins containing αMan, αGlc, αGalNAc, GalβGalNAc, αFuc and GlcNAc were incubated with the array to allow binding to the glycans present on the captured target proteins. Streptavidin-conjugated fluorescence dye corresponding Cy3 was then applied to the array. Finally, the dried glass slides were scanned using an Axon GenePix scanner to obtain fluorescence intensities and acquire images of the array spots. An excel-based analysis software tool provided by RayBiotech, Inc. was used for the automatic computation of the extracted numerical data obtained from the array image to semi-quantify the glycosylation levels of the captured target proteins. Pancreatic cancer associated biomarker candidates were selected for further evaluation using a costume made RayBio® Human Glycosylation Antibody Array 10 (RayBiotech, Inc.) The analysis was performed as described above in an extended external sample cohort comprising three experimental groups, pancreatic cancer, noninvasive IPMN and controls.
Statistical analysis
The analysis was conducted using the statistical programing language R [Citation18]. Logistic regression (LR) was conducted, using the R function lrm, from the package rms [Citation19], on all possible combinations of the variables. Receiver operator characteristic (ROC) curves were calculated using the R function pROC [Citation20]. LR models were held to be valid if the p-value for the model, and the p-value for each variable within the model, were all less than 0.05. Models not meeting the above criteria were discarded, and the remainder ordered in decreasing order of AUC. The most promising LR models were investigated further, with dotplots, boxplots and ROC curve plots generated using the ggplot2 package [Citation21].
The following comparisons were considered to have enough samples to train LR models: pancreatic cancer versus healthy (49 vs. 47 samples), pancreatic cancer and IPMN versus healthy (62 vs. 47) and pancreatic cancer versus IPMN and healthy (49 vs. 60). In order to analyze a further set of comparisons: pancreatic cancer Stage 1 versus Healthy (9 vs. 47), IPMN versus healthy (13 vs. 47) and pancreatic cancer versus IPMN (49 vs. 13), which did not have enough samples to train LR models, models were trained on comparisons with larger numbers of values, and then applied to the above comparisons to see how many of the samples on each side of the comparison were identified by the larger models.
Results
Study design
The initial discovery phase of the study was conducted to identify and select possible biomarker candidates. The sample cohort comprised in total 16 representative serum samples. Eight samples, obtained from resectable pancreatic cancer patients and 8 matched healthy controls were evaluated using a high-throughput screening strategy. The verification phase was performed to assess the diagnostic performance of the top 10 selected biomarker candidates. The external sample cohort consisted of serum samples from 109 individuals, including 49 patients with resectable pancreatic cancer, 13 patients with resectable noninvasive IPMN and 47 healthy controls. The median lesion size was 3.4 cm in the pancreatic cancer group and 3 cm in the IPMN group. On histopathological examination, 12 patients were classified as mixed-type IPMN and 1 patient as main-duct IPMN. The baseline clinical characteristics are reported in .
Table 1. Demographics of the study group.
Glycosylation profiling
The glycosylation profile of 1000 serum proteins was analyzed in the discovery phase. Signal intensities between pancreatic cancer samples and healthy controls were compared to determine glycosylation changes on the surface of each target protein. Pancreatic cancer associated glycoproteins Eotaxin-2/MPIF-2, IL-17E, CD163, DKK-1, BMP-3b/GDF-10, B7-1/CD80, IL12Rβ2, PDGF-AA, DR6/TNFRSF21 and IL-R4/ST2 demonstrated the highest levels of glycosylation and were selected as the top ten candidates for additional analysis.
Pancreatic cancer versus healthy
For discrimination of pancreatic cancer and healthy controls, two panels outperformed the use of CA19-9 alone.
The first panel included CA19-9, IL.17E, B7.1 and DR6 and had an AUC of 0.974, identifying 47 out of 49 cancers at 90% specificity. When applied to the differentiation of pancreatic cancer stage 1 from healthy controls the AUC was 0.988, identifying all nine stage 1 cancers at 90% specificity (; ).
Figure 1. Diagnostic performance of CA 19-9, IL.17E, B7.1 and DR6 for discrimination of pancreatic cancer and healthy controls.
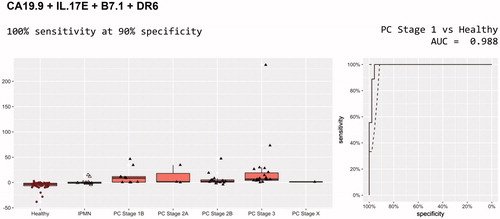
Table 2. Best models for pancreatic cancer versus healthy.
When CA19-9 was removed, the panel IL.17E, B7.1 and DR6 was still considered valid, with significant p-values for all variables and an AUC of 0.830, identifying 34 of 49 cancers including seven of nine stage 1 cancers, at 80% specificity.
The second panel comprised CA19-9, Eotaxin.2 and DR6. It had an AUC for pancreatic cancer versus healthy of 0.946, identifying 44 of 49 cancers including eight of nine stage 1 cancers, at 90% specificity. Eotaxin.2 and DR6 without CA19-9 also produced a valid LR model, with an AUC of 0.704, identifying 28 of 49 cancers at 80% specificity, including five of nine stage 1 cancers.
IPMN versus healthy
These models were trained on pancreatic cancer and IPMN versus healthy and then applied to IPMN versus healthy. A total of 22 models were identified with performance better than CA19-9 alone (0.747 AUC) for the discrimination of IPMN from healthy controls. The best of these included CA19-9, Eotaxin.2, CD163 and BMP.3b (). The AUC was 0.915 with 92.3% sensitivity (12 out of 13) at 80% specificity ().
Figure 2. Diagnostic performance of CA 19-9, Eotaxin.2, CD163 and BMP.3b for discrimination of IPMN and healthy controls.
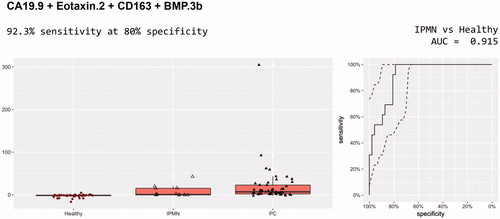
Table 3. Best models for IPMN versus healthy.
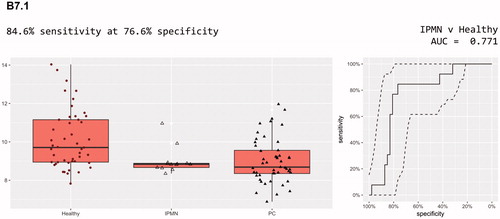
Simpler models are always preferred to more complex models, especially where the number of samples is low. One biomarker, B7.1, had better performance alone than CA19-9, with an AUC of 0.771. It identified 10 out of 13 IPMN cases at 80% specificity. In combination with CA19-9 it had a slightly improved AUC of 0.812, but identified fewer (nine) of the IPMN cases. CA19-9 alone only identified five of the 13 IPMN cases at this specificity. B7.1 was a member of 13 of the 22 panels whose models outperformed CA19-9 alone ().
Figure 3. Diagnostic performance of B7.1 for discrimination of IPMN and healthy controls.
Pancreatic cancer versus IPMN
These models were trained on pancreatic cancer versus IPMN and healthy and then applied to pancreatic cancer versus IPMN. There were four models with performance better than CA19-9 alone (0.778 AUC) for discrimination of pancreatic cancer from IPMN, all of whose panels included CA19-9. The best of these included CA19-9, IL.17E, B7.1 and IL.12RBeta2, yielding an AUC of 0.832 with 79.6% sensitivity (39 out of 49, five more than CA19-9 alone) at 80% specificity (; ).
Figure 4. Diagnostic performance of CA 19-9, IL.17E, B7.1 and IL.12RBeta2 for discrimination of pancreatic cancer and IPMN.
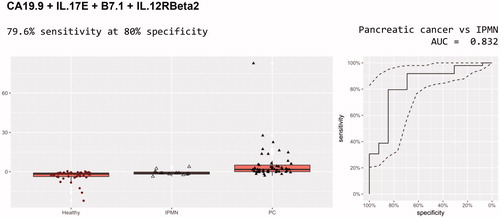
Table 4. Best models for pancreatic cancer versus IPMN.
Discussion
In this study, we conducted large-scale profiling of serum glycoproteins from patients with pancreatic cancer and IPMN with regard to glycosylation levels of the target proteins. We further developed specific biomarker panels by combining CA19-9 and N-glycan profiles of selected serum glycoproteins that could aid in the clinical management of these disease conditions.
Early detection is likely the most crucial step for improving prognosis of pancreatic cancer [Citation22]. We found that stage 1 cancers could be detected with superior accuracy, using a biomarker panel consisting of B7-1, IL-17E, DR6 and CA19-9, with an AUC of 0.988 with 100% sensitivity at 90% specificity. The same test panel was able to discriminate all stages of pancreatic cancer from healthy controls with an AUC of 0.974 with a sensitivity of 96% at 90% specificity.
A more radical improvement of prognosis may be achievable by diagnosing precursor lesions of pancreatic cancer, the most important being IPMN. We found that the glycoprotein B7.1 had better performance alone than CA19-9, with an AUC of 0.771. This is the first time that B7.1 has been linked to IPMN. In a previous study, the protein marker B7-1 was included in a serum biomarker panel for pancreatic cancer outcome prediction [Citation23]. Overexpression of B7-1 and B7-H1 has also been observed in pancreatic cancer tissues compared to normal pancreas [Citation24].
The findings of the present study are in agreement with previous studies, reporting improved diagnostic accuracy in discriminating pancreatic cancer by combining N-glycan markers in serum and CA19-9 [Citation25]. The serum N-glycan profile has also been studied in patients with IPMN. Nine glycans were highly expressed in patients with invasive IPMN compared to noninvasive IPMN [Citation26].
Importantly, the carcinoma-associated glycosylations may appear at the noninvasive stages of IPMN. Early glycosylation changes have been observed in low-grade IPMN such as a decrease of αGlcNAc expression relative to MUC6, which is thought to play a role in pancreatic cancer development [Citation27].
The limitations of this study need to be acknowledged. The diagnostic performance of our biomarker panels was high. In this cohort, CA19-9 alone had an AUC of 0.903 for detection of pancreatic cancer, which is higher than usually reported in the literature. Healthy individuals were used as controls. Chronic pancreatitis was not included in the evaluation. Conceivably, a diagnostic test for pancreatic cancer is intended for application in asymptomatic individuals. Patients with chronic pancreatitis are usually symptomatic. Most importantly, extensive validation of the biomarker candidates is needed to confirm the diagnostic performance. It is also of great importance to recognize that many patients diagnosed with malignant disease in the pancreas display various health conditions, requiring diverse pharmaceutical treatment. It has been shown that hyperglycemia can be noted several months prior to diagnosis [Citation28] and hyperglycemia was found to increase the glycosylation of several N-glycans in different diseases [Citation29]. In our cohort, a total of 16 patients (all with pancreatic cancer) had manifest diabetes mellitus and 7 out of these cases were considered new-onset. Unfortunately, fasting glucose levels were not routinely measured and the glycemic status was not adjusted for in our analysis. Furthermore, the analytical method used in the present study measured the glycosylation levels of serum proteins and no additional characterization of the individual glycans was performed. In the future, additional analysis can be applied to the biomarker candidates in order to characterize the glycan features in detail.
Conclusions
The assessment of protein glycosylation profiles in serum provides an opportunity for early and noninvasive detection of pancreatic cancer. We have identified a number of glycosylated biomarkers that can be investigated further in a larger trial, and which might be able to augment the performance of CA19-9 for the detection of pancreatic cancer. In addition, the N-glycan profile of B7.1 could be investigated further as a biomarker for the detection of IPMN, a precancerous condition of the pancreas for which no effective noninvasive biomarkers currently exist.
Disclosure statement
No potential conflict of interest was reported by the authors.
Additional information
Funding
References
- Carrato A, Falcone A, Ducreux M, et al. A systematic review of the burden of pancreatic cancer in Europe: real-world impact on survival, quality of life and costs. J Gastrointest Canc. 2015;46:201–211.
- Ansari D, Bauden M, Bergstrom S, et al. Relationship between tumour size and outcome in pancreatic ductal adenocarcinoma. Br J Surg. 2017;104:600–607.
- Ansari D, Tingstedt B, Andersson B, et al. Pancreatic cancer: yesterday, today and tomorrow. Future Oncol. 2016;12:1929–1946.
- Huang L, Jansen L, Balavarca Y, et al. Resection of pancreatic cancer in Europe and USA: an international large-scale study highlighting large variations. Gut. 2017. DOI:10.1136/gutjnl-2017-314828
- Neoptolemos JP, Palmer DH, Ghaneh P, et al. Comparison of adjuvant gemcitabine and capecitabine with gemcitabine monotherapy in patients with resected pancreatic cancer (ESPAC-4): a multicentre, open-label, randomised, phase 3 trial. Lancet. 2017;389:1011–1024.
- Aronsson L, Andersson R, Ansari D. Intraductal papillary mucinous neoplasm of the pancreas - epidemiology, risk factors, diagnosis, and management. Scand J Gastroenterol. 2017;52:803–815.
- Lennon AM, Wolfgang CL, Canto MI, et al. The early detection of pancreatic cancer: what will it take to diagnose and treat curable pancreatic neoplasia? Cancer Res. 2014;74:3381–3389.
- Duffy MJ, Sturgeon C, Lamerz R, et al. Tumor markers in pancreatic cancer: a European Group on Tumor Markers (EGTM) status report. Ann Oncol. 2010;21:441–447.
- European Study Group on Cystic Tumours of the Pancreas. European evidence-based guidelines on pancreatic cystic neoplasms. Gut. 2018;67:789–804.
- Apweiler R, Hermjakob H, Sharon N. On the frequency of protein glycosylation, as deduced from analysis of the SWISS-PROT database. Biochim Biophys Acta. 1999;1473:4–8.
- Rodrigues JG, Balmana M, Macedo JA, et al. Glycosylation in cancer: Selected roles in tumour progression, immune modulation and metastasis. Cell Immunol. 2018. DOI:10.1016/j.cellimm.2018.03.007
- Pinho SS, Reis CA. Glycosylation in cancer: mechanisms and clinical implications. Nat Rev Cancer. 2015;15:540–555.
- Pan S, Brentnall TA, Chen R. Glycoproteins and glycoproteomics in pancreatic cancer. World J Gastroenterol. 2016;22:9288–9299.
- Krishnan S, Whitwell HJ, Cuenco J, et al. Evidence of altered glycosylation of serum proteins prior to pancreatic cancer diagnosis. Int J Mol Sci. 2017;18:2670.
- Brierley J, Gospodarowicz M, Wittekind C. TNM classification of malignant tumours. 8th ed. Oxford: John Wiley & Sons; 2017.
- von Elm E, Altman DG, Egger M, et al. The Strengthening the Reporting of Observational Studies in Epidemiology (STROBE) statement: guidelines for reporting observational studies. J Clin Epidemiol. 2008;61:344–349.
- Bossuyt PM, Reitsma JB, Bruns DE, et al. Towards complete and accurate reporting of studies of diagnostic accuracy: the STARD initiative. Standards for Reporting of Diagnostic Accuracy. Clin Chem. 2003;49:1–6.
- R Core Team. R: A language and environment for statistical computing. Vienna (Austria): R Foundation for Statistical Computing; 2017. Available from: https://www.R-project.org/
- Frank EH, Jr. rms: Regression Modeling Strategies. R package version 5.1-2. 2018. Available from: https://CRAN.R-project.org/package=rms
- Robin X, Turck N, Hainard A, et al. pROC: an open-source package for R and S + to analyze and compare ROC curves. BMC Bioinformatics. 2011;12:77.
- Wickham H. ggplot2: elegant graphics for data analysis [Database]. New York: Springer-Verlag; 2009.
- Reid-Lombardo KM, Fridley BL, Bamlet WR, et al. Survival is associated with genetic variation in inflammatory pathway genes among patients with resected and unresected pancreatic cancer. Ann Surg. 2013;257:1096–1102.
- Torres C, Linares A, Alejandre MJ, et al. Prognosis relevance of serum cytokines in pancreatic cancer. Biomed Res Int. 2015;2015:518284.
- Wang L, Ma Q, Chen X, et al. Clinical significance of B7-H1 and B7-1 expressions in pancreatic carcinoma. World J Surg. 2010;34:1059–1065.
- Zhao YP, Zhou PT, Ji WP, et al. Validation of N-glycan markers that improve the performance of CA19-9 in pancreatic cancer. Clin Exp Med. 2017;17:9–18.
- Akimoto Y, Nouso K, Kato H, et al. Serum N-glycan profiles in patients with intraductal papillary mucinous neoplasms of the pancreas. Pancreatology. 2015;15:432–438.
- Ohya A, Yamanoi K, Shimojo H, et al. Gastric gland mucin-specific O-glycan expression decreases with tumor progression from precursor lesions to pancreatic cancer. Cancer Sci. 2017;108:1897–1902.
- Sharma A, Smyrk TC, Levy MJ, et al. Fasting blood glucose levels provide estimate of duration and progression of pancreatic cancer before diagnosis. Gastroenterology. 2018;155:490–500.e2.
- Dias WB, Hart GW. O-GlcNAc modification in diabetes and Alzheimer's disease. Mol Biosyst. 2007;3:766–772.