
Abstract
Background: Golimumab (GLM) is approved for the treatment of moderate to severe ulcerative colitis (UC). Higher serum concentrations of anti-tumor necrosis factor (TNF) agents are associated with improved clinical and endoscopic outcomes. Correlations between GLM serum concentrations and clinical and endoscopic outcomes were investigated during induction and maintenance treatment. In addition, a population pharmacokinetic model was developed to identify factors associated with the pharmacokinetics of GLM in UC.
Methods: A prospective observational trial (GO-KINETIC) was conducted in patients with moderate to severe UC receiving induction and maintenance treatment with GLM. Clinical and endoscopic outcomes were evaluated, fecal GLM concentrations were measured and pharmacokinetic data were analyzed.
Results: A total of 20 patients were enrolled. At week 8 (after induction treatment), 12 out of 20 patients (60%) showed an endoscopic response (≥1 point reduction in endoscopic Mayo score). Patients with endoscopic response at week 8 had numerically higher median GLM serum concentrations at week 2 compared to endoscopic non-responders: 9.1 µg/ml [5.9–12.3] vs. 7.1 µg/mL [5.2–9.0]; p = .384, respectively. At week 52, 3/20 patients (15%) achieved endoscopic remission (endoscopic Mayo score ≤1) and continued GLM treatment. Population pharmacokinetic analysis showed an inverse association between albumin concentrations and GLM clearance. GLM concentrations were undetectable in fecal samples.
Conclusions: After induction therapy, 60% of the patients showed endoscopic response. During maintenance therapy, about one third of patients discontinued GLM treatment because of loss of response. These patients might benefit from dose optimization.
Introduction
For ulcerative colitis (UC), three different anti-tumor necrosis factor (TNF) agents are registered: infliximab, adalimumab and golimumab (GLM). In European countries, the induction schedule of GLM consists of 200 mg, administered subcutaneously (SC), at week 0 followed by 100 mg at week 2. During maintenance treatment with GLM, patients receive 50 or 100 mg SC every 4 weeks, depending on their body weight (<80 kg or ≥80 kg, respectively). The PURSUIT trials were the pivotal trials which led to regulatory approval of GLM in UC [Citation1–3]. Safety and efficacy of GLM induction therapy were studied in the randomized, double blind and placebo controlled PURSUIT-SC study. Induction therapy with GLM resulted in a significant greater proportion of patients achieving clinical response, clinical remission and mucosal healing at week 6 compared to placebo [Citation2]. In addition, a placebo-controlled phase III maintenance trial (PURSUIT-M) evaluated safety and efficacy of GLM. At week 54 (week 60 after starting induction treatment), 28% and 23% of the patients receiving 100 and 50 mg GLM were in clinical remission, respectively, compared to 16% in the placebo group. Although these trials showed a greater efficacy of GLM compared to placebo, up to 40% lost their response during maintenance therapy (i.e., secondary loss of response). Secondary loss of response might be caused by underexposure to the drug. Higher GLM trough concentrations (i.e., the lowest drug concentration before the next dose) during maintenance therapy have been related to clinical remission and GLM trough concentrations >1.4 mg/L were associated with clinical remission during maintenance therapy [Citation4]. Also, during induction therapy it has been shown that GLM serum concentrations are significantly higher in clinical responders compared to complete non-responders at week 2 and 6 [Citation5].
The aim of this prospective trial was to study associations between GLM exposure (serum concentrations and area under the curve (AUC)) and clinical and endoscopic outcomes during induction and maintenance therapy in patients with moderate to severe UC. In addition, we developed a population pharmacokinetic model to identify covariates that influence the pharmacokinetics of GLM in UC.
Methods
Study design
This multicenter, prospective and observational trial (GO-KINETIC trial; clinicaltrials.gov NCT02277470) was performed at Amsterdam UMC (location Meibergdreef and location Boelelaan), and at the ‘Onze Lieve Vrouwe Gasthuis’ in Amsterdam, Netherlands. The study was conducted according to the Declaration of Helsinki and approved by the ethics committee. Written informed consent was obtained from all patients before the first study visit. All authors had access to the study data and reviewed and approved the final manuscript.
Adult patients (≥18 years) with a confirmed diagnosis of UC starting GLM induction treatment were screened. Severity of the disease was assessed with endoscopy at baseline and patients with moderate to severe UC (endoscopic Mayo score ≥2) were considered eligible. Both anti-TNF naïve and previously anti-TNF exposed patients could enter this study. The main exclusion criteria were imminent need for surgery and contraindications for GLM such as tuberculosis, severe infections or congestive heart failure. After endoscopic evaluation at the end of the induction phase (at week 8), patients could continue GLM treatment based on the treating physician’s decision and in consultation with the patient.
Endpoints and definitions
The primary goal was to study associations between drug exposure (GLM trough levels and AUC) and clinical and endoscopic outcomes at week 8 and 52 after starting GLM therapy, using the simple clinical colitis activity index (SCCAI) and endoscopic Mayo score, respectively. Additionally, a population pharmacokinetic model was developed to identify covariates that influence the pharmacokinetics of GLM. Secondary endpoints included the proportion of patients with detectable antibodies to GLM, evaluation of fecal GLM concentrations and biochemical response to GLM treatment (fecal calprotectin, serum C-reactive protein (CRP) and albumin) during GLM treatment. All patients started induction treatment with 200 mg GLM SC at day 1 and 100 mg SC at day 14, according to the registered label. From week 6, maintenance treatment followed with 50 mg SC (body weight <80 kg) or 100 mg SC (≥80 kg) every 4 weeks. Serum samples were collected at day 0 (before starting GLM treatment), and at day 4, 7, 14, 18, 28, 42 and 56 to measure GLM serum concentrations, anti-GLM antibody levels, CRP and albumin concentrations. Simultaneously, fecal samples were collected for the measurement of fecal calprotectin (Bühlmann fCal® ELISA, Bühlmann Laboratories AG, Schönenbuch, Switzerland; upper limit 1800 µg/g) and fecal GLM concentrations. During maintenance treatment, follow-up occurred at 6 additional study visits, at week 18, 21, 30, 33, 42, 45 and 52. Total follow-up was 52 weeks. Endoscopic response was defined as ≥1 point reduction in endoscopic Mayo score compared to baseline and endoscopic remission was defined as an endoscopic Mayo score ≤1. Endoscopic response and remission were assessed after induction treatment at week 8 and 52. Clinical activity was assessed during each study visit using the SCCAI. Clinical response and clinical remission were defined as a decrease in SCCAI of ≥3 points compared to baseline and a SCCAI score ≤2, respectively, without addition of immunomodulators and/or corticosteroids.
GLM serum concentrations and GLM-antibodies
GLM serum concentrations were measured using TNF for capture and rabbit anti-GLM for detection (lower limit of quantification (LLOQ) 0.005 mg/L) [Citation6,Citation7]. Anti-GLM antibodies in serum were measured using the standard antigen-binding test, which is a drug-sensitive assay [Citation8]. Measurements were performed by Sanquin Diagnostic Services, Biologics Lab (Amsterdam, the Netherlands). Fecal samples were prepared for GLM concentration measurements, as previously described by Brandse et al. [Citation9]. After preparation, fecal samples were shipped to Sanquin Diagnostic Services for measuring GLM concentrations with the same ELISA test that was used for GLM serum measurements.
Statistical analysis
All statistics were performed using SPSS version 24 (IBM, New York, NY). Patient characteristics were described by their median and interquartile range (IQR) values for continuous variables and by frequency and percentages for categorical variables. Differences between two groups were compared using the non-parametric Mann–Whitney U test. AUCs were calculated using Bayesian analysis based on the developed population pharmacokinetic model. Correlations between serum concentration and AUC at different time points were assessed using Pearson’s correlation coefficient. p Values <.05 were considered significant.
Population pharmacokinetics
Population pharmacokinetic parameters of GLM were assessed using nonlinear mixed-effects modeling, NONMEM® version 7.3 (ICON Development Solutions, Dublin, Ireland). Individual concentration–time curves were simultaneously analyzed and variability between patients was quantified. Relationships between pharmacokinetic parameters and potentially influencing covariates were evaluated and included: age, body weight, height, albumin, CRP, SCCAI, fecal calprotectin, disease duration, anti-TNF naïve/exposed status, induction/maintenance treatment phase (<42 days and ≥42 days), use of concomitant immunomodulators (i.e., thiopurines or methotrexate), anti-GLM antibodies (binary and quantitative) and smoking status. For missing time-varying covariates, the last observation was carried forward. For missing time-invariant covariates, median value of the covariate was imputed. Goodness-of-fit was assessed by evaluation of the objective function value (OFV), precision of the parameter estimates and visual inspection of diagnostic plots including visual predictive checks. The stability and robustness of the final model were tested by bootstrap analysis. All covariates were evaluated using forward inclusion and backward elimination. During forward inclusion, a drop in OFV of ≥6.63 (p value <.01) was considered significant. During backward elimination, a stricter p value of <.001 was used requiring a drop in OFV ≥ 10.83. More details about the pharmacokinetic analysis are described in the Supplementary Method section.
Results
In total 20 patients with moderate to severe UC were included between September 2014 and December 2016. Forty-five percent were male and the median [IQR] age was 46 years [36–58]. Median disease duration was 5 years [3.0–12 years] and 9 patients (45%) failed on prior anti-TNF therapy. Four out of nine patients stopped prior IFX therapy due to secondary loss of response. Two out of them had elevated anti-drug antibodies and in the other two patients IFX trough concentration were low (no anti-drug antibodies were tested, probably because therapeutic drug monitoring was not very commonly performed at that time). Patient characteristics and demographics are summarized in .
Table 1. Patient characteristics at baseline.
Clinical and endoscopic outcomes
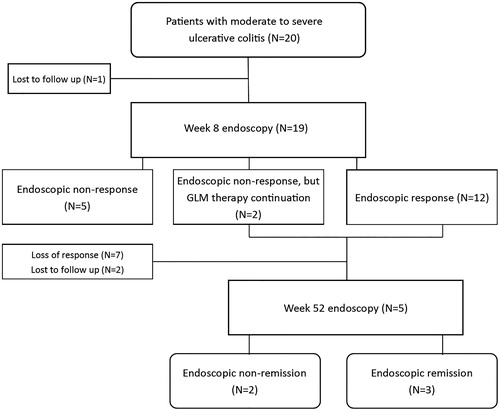
Clinical and endoscopic response and remission rates were assessed at week 8 after starting GLM therapy. After 8 weeks, 9 out of 20 patients (45%) showed clinical response and 6 patients (30%) were in clinical remission. Endoscopic outcomes were evaluated in 19 patients, because 1 patient was lost to follow-up before the week 8 endoscopy. Endoscopic response at week 8 was observed in 12 out of 20 patients (60%), and 10/20 (50%) achieved endoscopic remission after 8 weeks. In two patients, no endoscopic response was seen, but based on clinical improvement it was decided to continue GLM treatment. In total, 14 patients continued GLM maintenance treatment. During maintenance therapy, 7 out of 14 patients (50%) lost their response after a median [IQR] treatment duration of 12 weeks [9–21 weeks]. Out of these 7 patients who lost their response during maintenance treatment, 4 patients received GLM 50 mg every 4 weeks and 3 received 100 mg every 4 weeks. Because 2 patients were lost to follow-up, 5/14 patients underwent the week 52 endoscopy. At week 52, 3 out of the initially included 20 patients (15%) were in clinical and endoscopic remission while continuing GLM treatment. One patient had detectable anti-GLM antibodies at repeated measurements. This patient continued GLM maintenance treatment, but was lost to follow-up. Clinical and endoscopic outcomes are shown in .
Figure 1. Patient flowchart. N: number of patients.
Biochemical outcomes
At baseline, median [IQR] serum CRP, serum albumin and fecal calprotectin levels were 3.5 mg/L [1.0–13.7 mg/L], 44 g/L [41–45 g/L] and 1300 μg/g [521–1800 μg/g], respectively (). Median fecal calprotectin levels decreased after 2 weeks of treatment, but variability between patients remained high. Changes in fecal calprotectin levels and serum CRP over time are shown in .
Figure 2. (a) Median [interquartile range] fecal calprotectin over time. n: number of patients. (b) Median [interquartile range] CRP over time. CRP: C-reactive protein.
![Figure 2. (a) Median [interquartile range] fecal calprotectin over time. n: number of patients. (b) Median [interquartile range] CRP over time. CRP: C-reactive protein.](/cms/asset/5c7d7ca7-4be4-4e03-a0b8-1a1cfe344c70/igas_a_1619828_f0002_b.jpg)
Population pharmacokinetics
From 20 patients, a total of 190 serum GLM concentrations were available (114 samples were obtained during induction and 76 during maintenance therapy). Median [IQR] GLM concentrations at week 2 and 6 were 7.9 [5.7–9.9 mg/L] and 3.5 mg/L [2.3–5.9 mg/L], respectively (n = 20) (). At week 18, representing the first GLM trough concentration during maintenance treatment, the median [IQR] GLM trough concentration was 1.9 mg/L [1.1–2.4 mg/L] (n = 10). Using NONMEM, concentration–time data were described with a two-compartment model. Evaluation of covariates associated with pharmacokinetic parameters showed a significant association between serum albumin concentrations and clearance of GLM. Clearance varied between 1.57 and 0.77 L/day for albumin levels of 29 and 52 g/L, respectively. An overview of the population pharmacokinetic parameters is presented in Supplementary Table 1. Goodness-of-fit of the population pharmacokinetic model was assessed using a visual predictive check (Supplementary Figure 1).
Figure 3. Median [interquartile range] GLM concentrations. GLM: golimumab.
![Figure 3. Median [interquartile range] GLM concentrations. GLM: golimumab.](/cms/asset/fe07258d-9f53-4960-ace6-4c9869fb25c3/igas_a_1619828_f0003_b.jpg)
Exposure–response relationships
For each individual patient, AUC for the first 2 (AUC0–2w) and 6 weeks (AUC0–6w) after starting GLM therapy were obtained by Bayesian analysis using the developed population pharmacokinetic model. Results for AUC0–2w and AUC0–6w correlated strongly with trough concentrations at week 2 and 6 with Pearson’s correlation coefficients of 0.86 and 0.77, respectively. No significant differences were seen between trough concentrations or AUCs for clinical responders vs. non-responders (Supplementary Table 2). At week 2 and 6, GLM concentrations were higher in endoscopic responders versus non-responders, but significance was not reached ().
Figure 4. Week 2 and 6 median [interquartile range] GLM concentrations and area under the curve in endoscopic responders and non-responders at week 8. GLM: golimumab.
![Figure 4. Week 2 and 6 median [interquartile range] GLM concentrations and area under the curve in endoscopic responders and non-responders at week 8. GLM: golimumab.](/cms/asset/0fd40738-1ed0-43a1-ae63-d5bebdd8fa57/igas_a_1619828_f0004_b.jpg)
Fecal GLM concentrations
Fecal samples were collected and measured at day 0, 4 and 7, because the highest fecal GLM concentrations are expected within the first days after starting GLM treatment, which is based on earlier work with infliximab [Citation9]. Fecal GLM concentrations were below the LLOQ of 0.005 mg/L in all fecal samples at all-time points.
Discussion
In this real life prospective study, we evaluated clinical and endoscopic outcomes in UC patients receiving GLM therapy. Based on an intention to treat analysis, 10 out of 20 patients achieved endoscopic remission at week 52 and continued GLM treatment. Patients with an endoscopic response had numerically higher GLM trough concentrations compared to patients without an endoscopic response. A population pharmacokinetic model showed an inverse association between serum albumin levels and GLM clearance. These results reflect what is often seen in daily practice, in which GLM is frequently discontinued after induction therapy because of loss of response. At baseline, patients had confirmed active endoscopic disease with an endoscopic Mayo score of two or three. On the other hand, SCCAI scores were relatively low at baseline, which made it difficult to study possible correlations between serum GLM concentrations and clinical response. Most patients lost their response after induction therapy, which is in line with the PURSUIT data, although different definitions were used for loss of response [Citation1–3]. It can be hypothesized that UC patients, depending on disease severity, might need higher GLM doses during maintenance treatment. Out of 7 patients who lost response after induction therapy, 4 patients received 50 mg GLM as maintenance therapy. These 4 patients could potentially benefit from a dose increase to 100 mg GLM. Of note, the label of GLM recently changed, hence patients with a body weight <80 kg who do not respond to induction treatment with GLM 200 and 100 mg at week 0 and 2, respectively, can receive 100 mg GLM as maintenance treatment as from week 6.
Detrez et al. demonstrated that UC patients with more severe disease at baseline were less likely to respond to GLM compared to patients with mild disease [Citation5]. They also showed that clinical responses to GLM were related to serum GLM concentrations; i.e., patients with higher GLM serum levels had higher clinical remission rates compared to patients with lower serum levels. Adedokun et al. reported median GLM serum concentrations of 6.27 mg/L at week 2 and 1.78 mg/L at week 6 in patients who participated in the PURSUIT study [Citation4]. In our study, median [IQR] GLM concentrations were 7.9 [6.0–9.6 mg/L] and 3.7 mg/L [2.3–6.0 mg/L] at week 2 and 6, respectively. Thus, we found slightly higher median GLM concentrations compared to PURSUIT, despite using the same GLM induction scheme. This difference might, at least partly, be explained by different laboratory assays that were used [Citation10]. At week 18 (i.e., the first GLM trough concentration during maintenance treatment), the median GLM serum concentration, was 1.9 mg/L [1.1–2.4 mg/L], which is in line with previous work [Citation4]. Patients with an endoscopic response at week 8 had higher median [IQR] GLM serum levels (9.1 mg/L [5.9–12.3]) at week 2 compared to patients without an endoscopic response (7.1 mg/L [5.2–9.0]) (p = .384). Although not statistically significant, this finding emphasizes the importance of achieving adequate serum drug levels and is in line with previous studies with infliximab [Citation11–16]. Patients factors such as a high body weight, high serum CRP, low serum albumin and presence of anti-drug antibodies are associated with increased infliximab clearance, which in turn can result in inadequate serum levels [Citation17,Citation18]. In line with previous findings obtained with infliximab, we found an association between low serum albumin concentrations and increased clearance of GLM [Citation18,Citation19]. In only one patient, anti-GLM antibodies could be detected with a drug-sensitive assay. Therefore, the potential effect of immunogenicity on the pharmacokinetics of GLM could not be assessed in our study.
Severe mucosal inflammation in UC is associated with high TNF tissue concentrations [Citation20]. In these circumstances, standard anti-TNF doses may be insufficient to effectively block all mucosal and systemic TNF and to compensate for drug loss through proteolytic breakdown and fecal loss [Citation9,Citation20]. To our knowledge, this is the first study that investigated fecal loss of a SC administered anti-TNF agent. However, GLM could not be detected in fecal samples in our patients. This may be explained by the fact that maximum serum concentrations after SC administration with GLM are lower compared to infliximab, which is intravenously administered. Of note, the inflammatory load of patients enrolled in this study was lower compared to the study of Brandse et al. [Citation9]. Furthermore, intestinal degradation of GLM may also play a role [Citation20].
There are several limitations for our study. First of all, an uncontrolled study was conducted and the sample size was relatively small. Moreover, endoscopic procedures were analyzed by the site readers, hence they were not blinded. On the other hand, objective endoscopic end-points were used and outcomes were correlated to GLM serum concentrations that were measured at multiple time points. Due to the limited sample size, no firm conclusions can be drawn regarding possible associations between drug exposure and clinical and endoscopic outcomes. In addition, patients enrolled in our study had a relative low inflammatory burden, reflected by low CRP levels and normal albumin levels at baseline. As a result, less variability was observed in these inflammatory markers which could have potentially limited the identification of covariates in the population pharmacokinetic analysis. Also, as mentioned before, this might also contribute to the fact that fecal GLM concentrations could not be detected.
In conclusion, combined clinical and endoscopic remission with GLM was achieved in only 15% of UC patients at week 52. The majority of patients discontinued treatment after a median follow-up of 12 weeks due to insufficient response. Whether dose intensification, based on serum GLM measurements, can further improve outcome remains to be seen in dose-optimization studies.
Supplemental Material
Download Zip (178.5 KB)Acknowledgments
S. Berends (SB), A. Strik (AS), P. van Egmond (PE) and J. Brandse (JB) collected data. SB and AS analyzed data and wrote the manuscript. SB developed the population pharmacokinetic model under supervision of R. Mathôt (RM). PE, JB, M. Löwenberg (ML), G. D’Haens (GD), J. Jansen (JJ), N. de Boer (NB) and R. Mathôt (RM) contributed to manuscript preparation. ML supervised manuscript preparation.
Disclosure statement
SB: none declared.
AS: none declared.
JJ: served as consultant for Ferring, Abbvie, Janssen, Pfizer, Amgen and Fresenius.
NB: served as a speaker for AbbVie and MSD and as a consultant and principal investigator for TEVA Pharma BV and Takeda.
PE: none declared.
JB: none declared.
RM: served as advisor for Bayer, CSL Behring, Merck Sharp & Dohme, Shire and Zeria (all honoraria/fees paid to the department).
ML: served as speaker and/or principal investigator for: Abbvie, Celgene, Covidien, Dr. Falk, Ferring Pharmaceuticals, Gilead, GlaxoSmithKline, Janssen-Cilag, Merck Sharp & Dohme, Pfizer, Protagonist therapeutics, Receptos, Takeda, Tillotts and Tramedico.
GD: served as advisor for Abbvie, Ablynx, Allergan, Amakem, Amgen, AM Pharma, Arena Pharmaceuticals, AstraZeneca, Avaxia, Biogen, Bristol Meiers Squibb, Boerhinger Ingelheim, Celgene/Receptos, Celltrion, Cosmo, Covidien/Medtronics, Ferring, DrFALK Pharma, Eli Lilly, Engene, Galapagos, Genentech/Roche, Gilead, Glaxo Smith Kline, Hospira/Pfizer, Immunic, Johnson and Johnson, Lycera, Medimetrics, Millenium/Takeda, Mitsubishi Pharma, Merck Sharp Dome, Mundipharma, Nextbiotics, Novonordisk, Otsuka, Pfizer/Hospira, Photopill, Prometheus laboratories/Nestle, Progenity, Protagonist, Robarts Clinical Trials, Salix, Samsung Bioepis, Sandoz, Seres/Nestle, Setpoint, Shire, Teva, Tigenix, Tillotts, Topivert, Versant and Vifor; received speaker fees from Abbvie, Biogen, Ferring, Johnson and Johnson, Merck Sharp Dome, Mundipharma, Norgine, Pfizer, Samsung Bioepis, Shire, Millenium/Takeda, Tillotts and Vifor.
Additional information
Funding
Related Research Data
References
- Rutgeerts P, Feagan BG, Marano CW, et al. Randomised clinical trial: a placebo-controlled study of intravenous golimumab induction therapy for ulcerative colitis. Aliment Pharmacol Ther. 2015;42:504–514.
- Sandborn WJ, Feagan BG, Marano C, et al. Subcutaneous golimumab induces clinical response and remission in patients with moderate-to-severe ulcerative colitis. Gastroenterology. 2014;146:85–95.
- Sandborn WJ, Feagan BG, Marano C, et al. Subcutaneous golimumab maintains clinical response in patients with moderate-to-severe ulcerative colitis. Gastroenterology. 2014;146:96–109.e1.
- Adedokun OJ, Xu Z, Marano CW, et al. Pharmacokinetics and exposure–response relationship of golimumab in patients with moderately-to-severely active ulcerative colitis: results from phase 2/3 PURSUIT induction and maintenance studies. J Crohns Colitis. 2017;11:35–46.
- Detrez I, Dreesen E, Stappen TV, et al. Variability in golimumab exposure: a ‘Real-Life’ observational study in active ulcerative colitis. J Crohns Colitis. 2016;10:575–581.
- Bartelds GM, Krieckaert CLM, Nurmohamed MT, et al. Development of antidrug antibodies against adalimumab and association with disease activity and treatment failure during long-term follow-up. JAMA. 2011;305:1460–1468.
- Kneepkens EL, Plasencia C, Krieckaert CL, et al. Golimumab trough levels, antidrug antibodies and clinical response in patients with rheumatoid arthritis treated in daily clinical practice. Ann Rheum Dis. 2014;73:2217–2219.
- van Schie KA, Hart MH, de Groot ER, et al. The antibody response against human and chimeric anti-TNF therapeutic antibodies primarily targets the TNF binding region. Ann Rheum Dis. 2015;74:311–314.
- Brandse JF, van den Brink GR, Wildenberg ME, et al. Loss of infliximab into feces is associated with lack of response to therapy in patients with severe ulcerative colitis. Gastroenterology. 2015;149:350–355.e2.
- Paul S, Duru G, De Vries A, et al. P226 comparison of four different immunoassays for measuring golimumab and anti-golimumab antibody concentration in patients with ulcerative colitis. J Crohns Colitis. 2017;11:S192.
- Gibson DJ, Heetun ZS, Redmond CE, et al. An accelerated infliximab induction regimen reduces the need for early colectomy in patients with acute severe ulcerative colitis. Clin Gastroenterol Hepatol. 2015;13:330–335.e1.
- Adedokun OJ, Sandborn WJ, Feagan BG, et al. Association between serum concentration of infliximab and efficacy in adult patients with ulcerative colitis. Gastroenterology. 2014;147:1296–1307.e5.
- Yarur AJ, Kanagala V, Stein DJ, et al. Higher infliximab trough levels are associated with perianal fistula healing in patients with Crohn’s disease. Aliment Pharmacol Ther. 2017;45:933–940.
- Papamichael K, Van Stappen T, Vande Casteele N, et al. Infliximab concentration thresholds during induction therapy are associated with short-term mucosal healing in patients with ulcerative colitis. Clin Gastroenterol Hepatol. 2016;14:543–549.
- Ungar B, Mazor Y, Weisshof R, et al. Induction infliximab levels among patients with acute severe ulcerative colitis compared with patients with moderately severe ulcerative colitis. Aliment Pharmacol Ther. 2016;43:1293–1299.
- Seow CH, Newman A, Irwin SP, et al. Trough serum infliximab: a predictive factor of clinical outcome for infliximab treatment in acute ulcerative colitis. Gut. 2010;59:49–54.
- Dotan I, Ron Y, Yanai H, et al. Patient factors that increase infliximab clearance and shorten half-life in inflammatory bowel disease. Inflamm Bowel Dis. 2014;20:2247–2259.
- Brandse JF, Mould D, Smeekes O, et al. A real-life population pharmacokinetic study reveals factors associated with clearance and immunogenicity of infliximab in inflammatory bowel disease. Inflamm Bowel Dis. 2017;23:650–660.
- Fasanmade AA, Adedokun OJ, Blank M, et al. Pharmacokinetic properties of infliximab in children and adults with Crohn’s disease: a retrospective analysis of data from 2 phase III clinical trials. Clin Ther. 2011;33:946–964.
- Yarur AJ, Jain A, Sussman DA, et al. The association of tissue anti-TNF drug levels with serological and endoscopic disease activity in inflammatory bowel disease: the ATLAS study. Gut. 2016;65:249–255.