
Abstract
Background: Fecal calprotectin (FC) and serum C-reactive protein (CRP) are biomarkers of disease activity in Crohn’s disease (CD) and ulcerative colitis (UC). We assessed FC, CRP, Harvey–Bradshaw index (HBi), partial Mayo Clinic Scoring (pMCS) and a cytokine panel during infliximab induction to predict therapy outcome.
Methods: FC, CRP and clinical indices were evaluated in 123 (76 CD, 47 UC) patients before infliximab induction and after 12 weeks. Responders were monitored 48 weeks for an ‘incident’ (dosage increase, shortened dosage interval, surgery). Cutoff values for FC and CRP were obtained using receiver-operating characteristics (ROC). Disease progression was analyzed with Kaplan–Meier survivals, log-rank test and logistic regression for combined biomarkers. Cytokines were analyzed with Luminex multiplexing system.
Results: Following infliximab, FC and CRP declined (p < .0001) along with HBi for CD and pMCS for UC. Simultaneously, IL-6 and TNF-α decreased, while IL-10 increased. Optimal FC ROC cutoff was 221 µg/g (sensitivity 66%, specificity 67%, AUC 0.71) and CRP ROC cutoff 2.1 mg/L (sensitivity 54%, specificity 60%, AUC 0.58). In CD, FC > 221 µg/g (p < .0001), but not CRP > 2.1 mg/L predicted an ‘incident’. However, combined FC and CRP also predicted an ‘incident’ (p < .042). In UC, both FC > 221 µg/g (p < .0005) and CRP > 2.1 mg/L (p = .0334) predicted ‘incident’, as did combined biomarkers (p < .005).
Conclusions: Clinical disease activity is reduced by treatment with infliximab. In CD, persistently high FC, but not CRP, predict a treatment ‘incident’, whereas in UC both high FC and high CRP predict ‘incident’. Combined FC and CRP values also predict an ‘incident’.
Introduction
Long-term experience with standard therapies for inflammatory bowel disease (IBD) suggests diverse limitations and shortcomings as regards prediction of treatment response. The neutrophil-derived protein calprotectin is used as a fecal biomarker of inflammatory activity in CD and UC. Although not IBD specific, calprotectin is a cytosolic protein that increases during inflammation, has bacteriostatic and fungistatic properties and is released from activated granulocytes undergoing necrosis [Citation1]. In clinical practice, increased fecal calprotectin (FC) excretion is strongly correlated with intestinal inflammation [Citation2], and is a useful marker of IBD [Citation3]. As estimates of FC and CRP show correlations with endoscopic assessments, and disease activity indices [Citation4–7]. Under treatment, progressively decreasing of biomarkers are considered to predict mucosal healing, and FC can discriminate between treatment responders and non-responders [Citation8–13]. Conversely, regular prospective monitoring of FC has been shown to be able predict IBD relapse [Citation14].
Several studies focus on the correlation between FC and disease activity. Jones et al. [Citation15] found increased FC to correlate with endoscopic disease but not with clinical activity in CD patients. Schoepfer et al. saw a weak correlation between Crohn’s disease activity index (CDAI) and FC, but stronger correlation between FC and endoscopic activity in CD patients [Citation16]. In UC patients, the FC correlation to clinical disease activity turned out to be stronger than in CD, but still inferior to the correlation with endoscopic activity [Citation17]. In patients with CD, CRP levels are often well correlated to disease activity, whereas in UC patients CRP levels can be normal or only modestly elevated despite high disease activity [Citation18].
There is yet limited data published on the use of FC in monitoring anti-TNF induction therapy. Sipponen et al. [Citation19] concluded significantly lower levels of FC and lactoferrin as another fecal biomarker in response to infliximab infusions, whereas Laharie et al. [Citation20] concluded that FC does not predict clinical relapse in infliximab responding CD patients. CRP has repeatedly been studied in conjunction with anti-TNF treatment and shown to be a biomarker of therapeutic response [Citation21].
Over time, FC and CRP have been implemented in the clinical routine in order to monitor therapy response and outcome. The validity of FC and CRP as biomarkers of disease activity in IBD patients treated with anti-TNF agents are still not fully confirmed. Our hypothesis was that early FC or CRP determinations could be used to predict the clinical response to infliximab, and at which cutoff levels FC and CRP indicate forthcoming therapy adjustments. The aim of this cross-sectional study with longitudinal follow-up with data from the Swedish SWIBREG IBD registry of responders to infliximab treatment was to assess how FC and CRP best can be implemented in the clinical routine for monitoring sustained treatment response and the need of therapy adjustments or surgery over 48 weeks. The performance of the biochemical biomarkers was compared to clinical evaluation by the Harvey–Bradshaw index (HBi) for CD [Citation22] and the partial Mayo Clinic score (pMCS) for UC [Citation23].
Methods
Patients
The Karolinska University Hospital and Uppsala University Hospital were two independent study sites for patient recruitment. Patients were referred for IBD flare, or steroid-dependent or steroid-refractory disease between 2008 and 2016. A total of 182 patients were recruited for the study, 123 of which fulfilled all inclusion criteria but no exclusion criteria. Ninety-eight were naïve to infliximab treatment. For inclusion, patients should be 18–75 years of age, diagnosed with CD or UC at least 1 year before study, maximum dosage of mesalazine up to 4.8 grams per day, devoid of glucocorticosteroids, receiving infliximab induction therapy according to the standard protocol at weeks 0, 2 and 6 at a dose of 5 mg/kg followed by maintenance therapy every 8 weeks (other biological agents were not included). Patients should be adherent to the clinical routine with blood and fecal samples before and after induction therapy with available values of CRP and FC prior to induction therapy and at 12 and 36 weeks after the first dose. Patients should also be evaluable for disease activity according to HBi or pMCS prior to infliximab induction therapy and after 12 weeks, as well as clinical data up to 48 weeks after the initial treatment to detect possible clinical ‘incidents’ defined as an increase of infliximab dosage, shortening of infliximab dosage interval, or surgery.
Exclusion criteria were: age over 75 years, on-going glucocorticosteroid treatment and failure to collect provided stool and blood samples according to current clinical standards, stricturing disease and an infectious complication (septicemia, abscess). Seventy-six patients had CD and 47 UC. Of the CD patients, 10 had disease located to the terminal ileum (L1), 33 had colonic disease alone (L2), 24 ileo-colonic disease (L3) and one disease located in the colon and stomach (L2, L4); concurrent fistulizing disease ileo-colonic (B3) was present in 9 patients. Of the UC patients, 32 had extensive colitis (E3) and 15 left-sided colitis (E2). The all-over median disease duration was 4.5 (IQR 2–9) years. The decision of starting infliximab induction therapy was due to either glucocorticosteroid resistance or dependence and based on the physicians’ global assessment, in combination with endoscopic findings and laboratory results. Twenty of the patients received their first induction infusion as in-patients due to acute exacerbation and 103 as elective out-patients. At baseline, 45 patients had azathioprine and corticosteroids in combination, four had azathioprine alone and 66 had corticosteroid as single treatment. Eight had no IBD-related pharmacological treatment before induction therapy.
All patients underwent ileocolonoscopic examination by an experienced gastroenterologist using Olympus CV-180 or CV-190 endoscopes. Endoscopy findings were graded immediately after the procedure and prior to anti-TNF induction therapy. The endoscopic findings in CD patients were scored according to the simple endoscopic score for CD (SES-CD) and the Mayo endoscopic subscore for UC.
Clinical response was defined as a decrease of ≥ 3 points of either HBi or pMCS, and clinical remission as <5 and ≤1 in HBi and pMCS, respectively [Citation24,Citation25]. FC, CRP and clinical indices were evaluated on two occasions: at baseline before introduction of infliximab therapy and after 12 (±2) weeks. This time period was chosen to properly assess therapy response following induction therapy at weeks 0, 2 and 6. The patients were then followed 42 weeks, thus covering 48 weeks in a row for a treatment ‘incident’ to appear.
Fecal calprotectin and serum C-reactive protein
Patients provided stool samples for FC analysis and blood samples were drawn for serum CRP analysis at baseline and at 12 weeks. FC was analyzed quantitatively by ELISA with cutoff for normal values <50 µg/g (Bühlmann, Laboratories AG, Schönenbuch, Basel, Switzerland). CRP was analyzed with near-infrared particle immunoassay (NIPIA, UniCel DxC 800, Beckman Coulter, Inc., Brea, CA) with lower limit of detection 0.2 mg/L. The measured FC and CRP values were normally distributed.
Cytokine and chemokine substudy
In a separate substudy of 18 responders (13 men, 5 women, 11 CD, 7 UC) to infliximab induction therapy, a cytokine and chemokine protein array analysis was done before and after infliximab induction treatment. The aim was to find supplementary biomarkers to infliximab treatment response in IBD. Plasma samples were investigated in duplicate for 22 cytokines and chemokines: interleukin-1α (IL-1α), IL-1β, IL-2, IL-4, IL-5, IL-6, IL-7, IL-8, IL-10, IL-12, IL-13, IL-15, IL-17, interferon gamma (IFN-γ), TNF-α, granulocyte colony-stimulating factor (G-CSF), granulocyte-macrophage colony-stimulating factor (GM-CSF), monocyte chemoattractant protein-1 (MCP-1), eotaxin, macrophage inflammatory protein-1α (MIP-1α), IFN-γ-inducible 10-kDa protein (IP-10), and IL-1 receptor antagonist (IL-1ra) (Linco Research, Inc., St Louis, MO). Data acquisition and analysis were performed using a Luminex 100 instrument (Luminex, Austin, TX; carried out at Clinical Chemistry, St Göran Hospital, Stockholm, Sweden). The assays were performed according to the supplier's instructions. Briefly, 25 μl plasma samples were diluted 1:1 with kit serum matrix and added to the plate with all the 22 individual cytokines or chemokines. The plate was incubated for 1 h on shaker 300 RPM (room temperature). After washing, 25 μl of detection antibody was added per well and incubated for 1 h. Then, 50 μl strepatavidin-phycoerythrin conjugate was added per well and incubated for 30 min (room temperature). After washing, 150 μl sheath fluid was added to each well, read by Luminex 100/200 multiplexing system and data analyzed by Luminex 100 IS software version 2.3.182 (Luminex Corp., Austin, TX).
Ethics
The study was approved by the Ethics committee of Karolinska Institutet, Stockholm (2009-10-21 no. 2009/1510-31/1; updated 2015-04-02 no. 2015/555-32).
Statistics
Data were analyzed using Prism GraphPad 6.0 (San Diego, CA) and JASP 0.9.2 (Amsterdam, Netherlands). Values are means and standard error of the mean, or medians and interquartile range as appropriate using the Kolmogorov–Smirnov test for normal distribution. Statistical differences of results before and after induction treatment were calculated using the paired Student’s t-test. Receiver operating characteristics (ROCs) were used to analyze the likelihood ratio, sensitivity and specificity for FC and CRP. Optimal cutoffs for FC and CRP were determined from the combined maximum sensitivity and specificity for each parameter employing Youden’s index. Kaplan–Meier analysis was used to create survival curves for defined ’incidents’. The log-rank test was used for evaluation of statistical differences between survival curves. For evaluation of the biomarkers FC and CRP in combination a logistic regression was used. p < .05 was considered a statistically significant difference. A post hoc power analysis at the α = 0.05 level showed 83.1% for FC and 82.8% for CRP.
Results
Based on HBi and pMCS, 93 patients (76%) responded to infliximab, 48 (39%) of which achieving clinical remission after induction therapy. Among the CD patients, 63 (83%) responded (p < .0001), and of UC patients 30 (64%) responded (p < .0001) to infliximab therapy. Thirty patients (24%, 16 CD and 14 UC) did not respond.
In the total group of CD and UC patients, baseline HBi was 9 (6.5–14) and pMCS 6 (5–7.25). After induction therapy, HBi decreased to 4 (2–7) (p < .0001) and pMCS to 3 (2–4) (p < .0001) (). The FC levels were 2610 ± 396 µg/g at baseline and decreased to 552 ± 93 µg/g after induction therapy (p < .0001); corresponding CRP values were 26.7 ± 3.5 and 4.9 ± 0.8 mg/L (p < .0001).
Figure 1. Reduction of Harvey-Bradshaw index (left) and partial Mayo clinic score (right) in response to infliximab induction treatment.
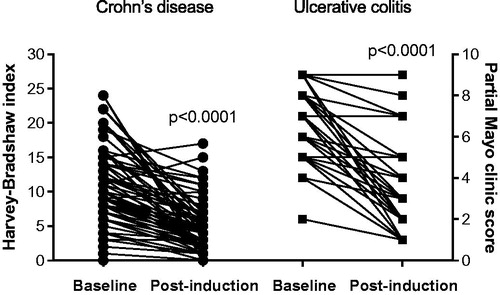
For the separate diagnoses CD and UC, the results of clinical indices, FC and CRP in response to treatment are shown in . There was a significant decline of all HBi and pMCS estimates with treatment (both p < .0001), in parallel with FC (p < .0001) and CRP (p < .0001). By employing multiple comparisons test there was an overall significant decline of biomarkers in the remission and the responder groups, but not in non-responders (, ).
Figure 2. Fecal calprotectin (top) and serum C-reactive protein (bottom) values before and after infliximab induction treatment.
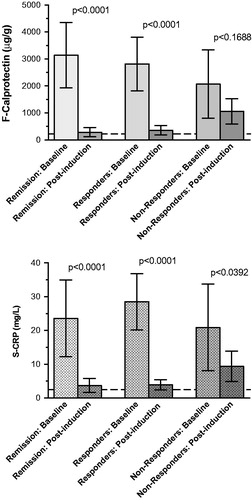
Table 1. Estimated clinical indices of Crohn’s disease with Harvey–Bradshaw index and ulcerative colitis with partial Mayo clinic sore, fecal calprotectin and serum C-reactive protein.
The array of cytokines and chemokines that was analyzed displayed a change of only a few interleukins in response to infliximab treatment. Primarily IL-6 and TNF-α decreased significantly, while IL-10 increased. The overall variability of the responses was considerable ().
Table 2. Cytokine and chemokine array of plasma samples from representative responders to infliximab treatment.
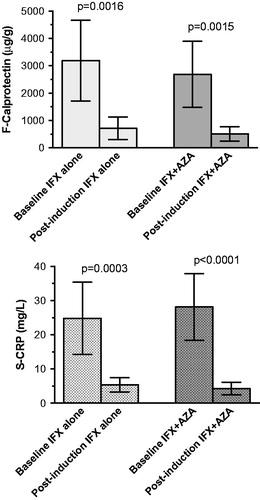
FC and CRP values of patients treated with azathioprine in combination with infliximab compared with those treated with infliximab alone showed similar decrements of both FC and CRP after 12 weeks treatment (FC, p < .0016 and .0015; UC, p < .0001 and .0001). There were no significant differences between the groups treated with or without azathioprine ().
Figure 3. Comparison of fecal calprotectin (top) and serum C-reactive protein (bottom) values before and after infliximab induction treatment without and with the addition of azathioprine as immunosuppressant.
Clinical responders were monitored for 48 weeks in order to identify ‘incidents’. In total, 38 patients had an ‘incident’; 30 of which had a shortened dose interval, four patients had increased dosage 10 mg/kg body weight and another four needed surgery. When separated by diagnosis, 21% of patients with CD had an ‘incident’, while the corresponding number among UC patients was 47%. We found that the HBi and pMCS after therapy induction fell from 12 (9–16) to 3 (1–3.25) and from 8 (8–9) to 2 (1–2), respectively, in those who later developed an ‘incident’. The FC levels among patients who experienced an ‘incident’ decreased from 2351 ± 718 to 533 ± 94 µg/g (p < .001). At the same time, the CRP levels were 22 ± 15.2 and 6.0 ± 1.7 mg/L (p < .05) in those with and without any ‘incident’, respectively.
The FC ROC analysis optimal cutoff point was 221 µg/g with a likelihood ratio of 2.1 (sensitivity 66%, specificity 67%, positive and negative predictive values 56% and 74%) () and an area under the curve (AUC) of 0.71 ± 0.07. The Kaplan–Meier survival curve in shows that FC levels exceeding 221 µg/g after induction therapy were associated with an ‘incident’ within 48 weeks after induction (p < .05).
Figure 4. Receiver operating characteristics curves of fecal calprotectin (top) and serum C-reactive protein (bottom).
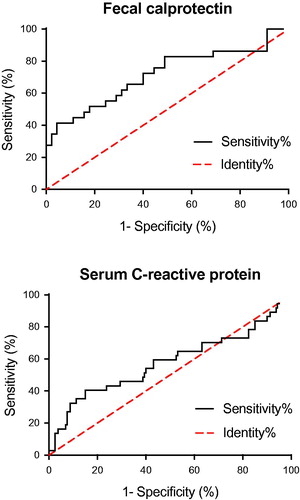
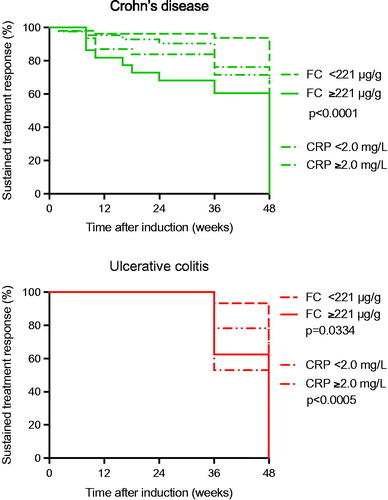
Figure 5. Kaplan–Meier survival analysis of the biomarkers fecal calprotectin and serum C-reactive protein as discriminative biomarker in Crohn’s disease (top) and ulcerative colitis (bottom). In Crohn’s disease the optimized cutoff value of fecal calprotectin 221 μg/g was associated with a treatment ‘incident’ within 48 weeks after infliximab induction treatment (p < .0001), whereas the corresponding optimized C-reactive protein cutoff 2.1 mg/L was not. In ulcerative colitis the optimized cutoff value of fecal calprotectin 221 μg/g was associated with a treatment ‘incident’ within 48 weeks after infliximab induction treatment (p < .0005), as was the corresponding optimized C-reactive protein cutoff level at 2.1 mg/L (p = .0334).
The corresponding CRP ROC analysis optimal cutoff point was 2.1 mg/L with a likelihood ratio of 1.4 (sensitivity 54%, specificity 60%, positive and negative predictive values 38 and 73%) () and an AUC of 0.58 ± 0.06. The Kaplan–Meier survival curve in shows that a CRP level above 2.1 mg/L after induction therapy was associated with an ‘incident’ within 48 weeks (p < .05).
Among the CD patients 50% with elevated FC and CRP levels had an ‘incident’ within 48 weeks, whereas in UC patients, the therapy response was sustained up to 36 weeks, but thereafter 70% of the UC patients experienced an ‘incident’ during the forthcoming 24 weeks. When monitoring FC related to sustained treatment response at 48 weeks, our data showed that in CD, FC ≥ 221 µg/g (p < .0001), but not CRP ≥ 2.1 mg/L, could separate patients developing an ‘incident’ from those who did not. In UC, however, not only FC ≥ 221 µg/g (p < .0005), but also CRP ≥ 2.1 mg/L (p = .0334) was able to separate and predict patients with or without an ‘incident’ over 48 weeks. Combination of the biomarkers FC and CRP using logistic regression with the optimal cutoffs, was significantly discriminating for CD (p < .042), as well as for UC (p < .005).
Discussion
Our present study shows that patients responding to infliximab treatment, clinical indices, as well as FC and CRP levels all decreased significantly during the induction period. In CD, high FC levels were associated with increased symptoms and signs of flare within the following 48 weeks, whereas in UC both high FC and CRP in the induction period was associated with worsening of disease and a need of therapy adjustment. This was further shown by combination of the two biomarkers. As an extension of this, IL-6 and TNF-α decreased, while IL-10 increased in response to treatment. IL-6 has a role as pro-inflammatory cytokine mediating its effect through TNF-α and IL-1, and inhibition of IL-1ra and IL-10 [Citation26–28]. In agreement with this, in our study IL-6, TNF-α and IL-10 reacted to treatment, whereas IL-1α and IL-β numerically decreased and IL-1ra numerically increased.
Anti-TNF therapy is a major achievement in the treatment of IBD. However, anti-TNF therapy is expensive, up to one-third of patients do not respond to treatment, and about 10% lose their therapeutic response or develop intolerance over the course of therapy. Hence, there is need for reliable biomarkers to early identify non-responders from responders in order to better monitor the therapeutic response and outcome of treatment [Citation24].
There is little data published on FC in response to anti-TNF therapy. Sipponen et al. have studied FC levels in relation to CDAI and endoscopy findings during anti-TNF induction therapy in CD patients and found a close correlation between FC and CDEIS [Citation19]. However, the reported findings did not employ the standard induction schedule at 0, 2 and 6 weeks, but instead a modified treatment schedule with infliximab administrations at 0 and 8 weeks. Due to the invasiveness of endoscopy, with confirmative histological healing of the gut mucosa, this is not a realistic option in order to verify treatment results in the clinical setting. Other studies present evidence implicating FC in monitoring the result of anti-TNF induction therapy. In 2015, Boschetti et al. [Citation25] studied the use of FC in CD patients to assess the response to anti-TNF induction therapy and to predict relapse during a 1-year maintenance therapy. They found that a drop in FC levels correlates with the therapeutic response to anti-TNF induction and a correlation between FC and disease outcome after maintenance therapy. However, their results must be confirmed by further studies, since their patient sample size was small and selected, and carried out before common use of FC as a prognostic marker in clinical practice is applicable [Citation25]. Our data fit with those of the recent CALM study [Citation29] where treatment escalation was based on treatment failure criteria; FC ≥ 250 μg/g and CRP ≥ 5 mg/L. To this end, a recent meta-analysis verifies that FC can be used as a reliable biomarker to predict relapse with high sensitivity and specificity in patents with both UC and CD [Citation30]. These results together with ours implicate that FC serves its function to monitor anti-TNF therapy. However, 80% of our patients were naïve for Infliximab therapy, meaning that 20% of the patients had been treated with infliximab earlier. It is well known that episodic treatment with infliximab, after a period of treatment discontinuation, might cause anti-infliximab antibody formation associated with low infliximab trough levels, which is a well-known cause of loss of response and might be an independent factor for a defined ‘incident’, outside of the FC and CRP values.
We found that patients responding to treatment with sustained elevated FC levels should be closely monitored since there seems to be an increased risk of incidental flare-up over the next 48 weeks. At variance with this, Laharie et al. [Citation20] published data showing no predictive value of FC as a marker of relapse in CD patients. Albeit, Louis et al. later concluded FC to be a prognostic marker when combined with other clinical and biological markers [Citation31]. This is also in line with Vieira et al. [Citation4] who showed that FC is a specific and sensitive marker for intestinal inflammation in both CD and UC, and that increased FC correlates with the degree of mucosal inflammation. Based on the results of our present study we conclude that FC can be used to predict a long-term therapeutic response to infliximab, whereas CRP is of less value. However, the optimal cutoff value for predicting outcome was surprisingly low, only little over four times the diagnostic level of FC (50 μg/g). Yet, there is no firmly established FC cutoff level to predict relapse in UC and CD, even though limits of e.g. 167, 130, 250 and 321 µg/g have been suggested [Citation32–35]. In line with our findings, Garcia-Sanchez et al. [Citation36] showed that IBD patients in remission with FC levels exceeding 150 µg/g had a 6-fold greater risk of relapse compared with patients with lower levels.
FC levels below the diagnostic cutoff level after anti-TNF induction therapy were rare. Only twelve patients had normal FC after 12 weeks, even though 35 reached clinical remission. This is in line with reports of other groups studying different kinds of IBD therapy. Røseth et al. showed that values less than 50 mg/L (equal to 250 μg/g) are regularly reached approximately 4 weeks after onset of infliximab therapy [Citation7]. These observations are commensurate with review data by Konikoff and Denson [Citation32] who further claim FC to be useful in determining whether clinical symptoms in patients diagnosed with IBD are caused by a true inflammatory flare or by other non-inflammatory symptoms of functional origin. A reduced FC is considered as objective evidence of response to treatment. As an alternative, in a recent publication Monteiro et al. [Citation37] concluded that FC is more useful in predicting maintenance of remission than relapse in CD patients with values <327 μg/g excluding relapse for 6 months.
In recent years serum calprotectin has been forwarded as a supplementary feasible biomarker with predictive properties in IBD [Citation38]. We have previously reported of calprotectin levels in serum during infliximab therapy in CD patients, which show a decline but not to levels as low as in healthy controls [Citation39].
Little is known about CRP in monitoring anti-TNF induction therapy and whether CRP concentrations can predict the clinical response in patients with CD and UC. In our study, the CRP levels correlated to FC and the clinical response, indicating that these validated biomarkers of inflammation can be implemented in clinical routine when monitoring therapy response after infliximab induction in IBD. However, our results also showed that only 25% of the IBD population had elevated values of CRP. Therefore, FC would be more robust as compared to CRP in order to correctly assess clinical therapeutic response. The SONIC study [Citation21], of patients with CD receiving infliximab and/or azathioprine, showed that patients with elevated baseline CRP levels had a better clinical response to infliximab therapy, speaking for the possible use of CRP as a predictor of anti-TNF therapy response. Meuwis et al. also found that CRP complimented by FC can be used to predict relapse after withdrawal of anti-TNF therapy in patients with CD [Citation38]. In our hands, CRP as compared to FC, showed less capability of predicting a defined ‘incident’. The best cutoff point (2.1 mg/L) lies within the normal range (<3 mg/L) and therefore requires a high sensitivity CRP analysis to be used.
Even if the appropriateness of immunosuppressive drugs in combination with anti-TNF drugs in IBD is undebatable, the FC and CRP responses in infliximab-treated patients with or without concurrent azathioprine treatment were similar in our present study. This is different from data reported by Sokol et al. [Citation40] in IBD patients treated with scheduled infliximab infusions. This difference may be due to the relatively short observation period of 12 weeks which may not have given sufficient time for a full azathioprine response to appear.
To conclude, in CD a treatment ‘incident’ under infliximab treatment (dose adjustment, surgery) was predicted by high FC but not CRP values, whereas in UC both high FC and CRP values were predictive of a treatment incidence. However, the predictive value of the biomarkers came about at remarkably low cutoffs. Hence, the prediction of an infliximab therapy response finds support in inflammatory biomarkers with a clear relationship to IBD.
Author contributions
J.E.: data collection, data analysis and writing up of the second draft of manuscript; M.L.: data collection, data analysis and writing up of first draft of manuscript; R.B.: patient recruitment; T.L.: study design, data analysis and critical review of manuscript; H.D-T.: data collection and analysis; M.H.: study design, data analysis, critical review of manuscript; P.M.H.: study design, data analysis, critical review, final writing and submission of manuscript.
Disclosure statement
No conflicts to declare by any of the authors.
Correction Statement
This article has been republished with minor changes. These changes do not impact the academic content of the article.
Additional information
Funding
References
- Steinbakk M, Naess-Andresen CF, Lingaas E, et al. Antimicrobial actions of calcium binding leucocyte L1 protein, calprotectin. Lancet. 1990;336(8718):763–765.
- D'Inca R, Dal Pont E, Di Leo V, et al. Calprotectin and lactoferrin in the assessment of intestinal inflammation and organic disease. Int J Colorectal Dis. 2007;22(4):429–437.
- Røseth AG, Aadland E, Jahnsen J, et al. Assessment of disease activity in ulcerative colitis by faecal calprotectin, a novel granulocyte marker protein. Digestion. 1997;58(2):176–180.
- Vieira A, Fang CB, Rolim EG, et al. Inflammatory bowel disease activity assessed by fecal calprotectin and lactoferrin: correlation with laboratory parameters, clinical, endoscopic and histological indexes. BMC Res Notes. 2009;2(1):221.
- Sipponen T, Savilahti E, Kolho KL, et al. Crohn's disease activity assessed by fecal calprotectin and lactoferrin: correlation with Crohn's disease activity index and endoscopic findings. Inflamm Bowel Dis. 2008;14(1):40–46.
- Solem CA, Loftus EV, Jr, Tremaine WJ, et al. Correlation of C-reactive protein with clinical, endoscopic, histologic, and radiographic activity in inflammatory bowel disease. Inflamm Bowel Dis. 2005;11(8):707–712.
- Røseth AG, Aadland E, Grzyb K. Normalization of faecal calprotectin: a predictor of mucosal healing in patients with inflammatory bowel disease. Scand J Gastroenterol. 2004;39(10):1017–1020.
- Sipponen T, Björkesten CG, Färkkilä M, et al. Faecal calprotectin and lactoferrin are reliable surrogate markers of endoscopic response during Crohn's disease treatment. Scand J Gastroenterol. 2010;45(3):325–331.
- Zittan E, Kelly OB, Kirsch R, et al. Low fecal calprotectin correlates with histological remission and mucosal healing in ulcerative colitis and colonic Crohn's disease. Inflamm Bowel Dis. 2016;22(3):623–630.
- af Björkesten CG, Nieminen U, Turunen U, et al. Surrogate markers and clinical indices, alone or combined, as indicators for endoscopic remission in anti-TNF-treated luminal Crohn's disease. Scand J Gastroenterol. 2012;47(5):528–537.
- De Vos M, Dewit O, D'Haens G, et al. Fast and sharp decrease in calprotectin predicts remission by infliximab in anti-TNF naïve patients with ulcerative colitis. J Crohns Colitis. 2012;6(5):557–562.
- Molander P, af Björkesten CG, Mustonen H, et al. Fecal calprotectin concentration predicts outcome in inflammatory bowel disease after induction therapy with TNFα blocking agents. Inflamm Bowel Dis. 2012;18(11):2011–2017.
- Guidi L, Marzo M, Andrisani G, et al. Faecal calprotectin assay after induction with anti-tumour necrosis factor α agents in inflammatory bowel disease: prediction of clinical response and mucosal healing at one year. Dig Liver Dis. 2014;46(11):974–979.
- Wright EK, Kamm MA, De Cruz P, et al. Measurement of fecal calprotectin improves of fecal calprotectin improves monitoring and detection of recurrence of Crohn's disease after surgery. Gastroenterology. 2015;148(5):938–947.
- Jones J, Loftus EV, Jr, Panaccione R, et al. Relationships between disease activity and serum and fecal biomarkers in patients with Crohn's disease. Clin Gastroenterol Hepatol. 2008;6(11):1218–1224.
- Schoepfer AM, Beglinger C, Straumann A, et al. Fecal calprotectin correlates more closely with the Simple Endoscopic Score for Crohn's disease (SES-CD) than CRP, blood leukocytes, and the CDAI. Am J Gastroenterol. 2010;105(1):162–169.
- Schoepfer AM, Beglinger C, Straumann A, et al. Ulcerative colitis: correlation of the Rachmilewitz endoscopic activity index with fecal calprotectin, clinical activity, C-reactive protein, and blood leukocytes. Inflamm Bowel Dis. 2009;15(12):1851–1858.
- Vermeire S, Van Assche G, Rutgeerts P. C-reactive protein as a marker for inflammatory bowel disease. Inflamm Bowel Dis. 2004;10(5):661–665.
- Sipponen T, Savilahti E, Kärkkäinen P, et al. Fecal calprotectin, lactoferrin, and endoscopic disease activity in monitoring anti-TNF-alpha therapy for Crohn's disease. Inflamm Bowel Dis. 2008;14(10):1392–1398.
- Laharie D, Mesli S, El Hajbi F, et al. Prediction of Crohn's disease relapse with faecal calprotectin in infliximab responders: a prospective study. Aliment Pharmacol Ther. 2011;34(4):462–469.
- Peyrin-Biroulet L, Reinisch W, Colombel JF, et al. Clinical disease activity, C-reactive protein normalisation and mucosal healing in Crohn's disease in the SONIC trial. Gut. 2014;63(1):88–95.
- Vermeire S, Schreiber S, Sandborn WJ, et al. Correlation between the Crohn's disease activity and Harvey-Bradshaw indices in assessing Crohn's disease severity. Clin Gastroenterol Hepatol. 2010;8(4):357–363.
- Lewis JD, Chuai S, Nessel L, et al. Use of the noninvasive components of the Mayo score to assess clinical response in ulcerative colitis. Inflamm Bowel Dis. 2008;14(12):1660–1666.
- Bernstein CN, Eliakim A, Fedail S, et al. World Gastroenterology Organisation global guidelines inflammatory bowel disease: update August 2015. J Clin Gastroenterol. 2016;50(10):803–818.
- Boschetti G, Garnero P, Moussata D, et al. Accuracies of serum and fecal S100 proteins (calprotectin and calgranulin C) to predict the response to TNF antagonists in patients with Crohn's disease. Inflamm Bowel Dis. 2015;21(2):331–336.
- Grundström J, Linton L, Thunberg S, et al. Altered immunoregulatory profile during anti-tumour necrosis factor treatment of patients with inflammatory bowel disease. Clin Exp Immunol. 2012;169(2):137–147.
- Yao X, Huang J, Zhong H, et al. Targeting interleukin-6 in inflammatory autoimmune diseases and cancers. Pharmacol Ther. 2014;141(2):125–139.
- Al-Saffar AKh, Meijer CH, Gannavarapu VR, et al. Parallel changes in Harvey-Bradshaw index, TNFα, and intestinal fatty acid binding protein in response to infliximab in Crohn's disease. Gastroenterol Res Pract. 2017;2017:1745918.
- Colombel JF, Panaccione R, Bossuyt P, et al. Effect of tight control management on Crohn's disease (CALM): a multicentre, randomised, controlled phase 3 trial. Lancet. 2017;390(10114):2779–2789.
- Mao R, Xiao YL, Gao X, et al. Fecal calprotectin in predicting relapse of inflammatory bowel diseases: a meta-analysis of prospective studies. Inflamm Bowel Dis. 2012;18(10):1894–1899.
- Louis E, Mary JY, Vernier-Massouille G, et al. Maintenance of remission among patients with Crohn’s disease on antimetabolite therapy after infliximab therapy is stopped. Gastroenterology. 2012;142(1):63–70.e5.
- Konikoff MR, Denson LA. Role of fecal calprotectin as a biomarker of intestinal inflammation in inflammatory bowel disease. Inflamm Bowel Dis. 2006;12(6):524–534.
- Gisbert JP, Bermejo F, Pérez-Calle JL, et al. Fecal calprotectin and lactoferrin for the prediction of inflammatory bowel disease relapse. Inflamm Bowel Dis. 2009;15(8):1190–1198.
- D'Inca R, Dal Pont E, Di Leo V, et al. Can calprotectin predict relapse risk in inflammatory bowel disease? Am J Gastroenterol. 2008;103:2007–2014.
- Tibble JA, Sigthorsson G, Bridger S, et al. Surrogate markers of intestinal inflammation are predictive of relapse in patients with inflammatory bowel disease. Gastroenterology. 2000;119(1):15–22.
- Garcia-Sánchez V, Iglesias-Flores E, González R, et al. Does fecal calprotectin predict relapse in patients with Crohn’s disease and ulcerative colitis? J Crohns Colitis. 2010;4:144–152.
- Monteiro S, Dias de Castro F, Leite S, et al. Low fecal calprotectin predicts clinical remission in Crohn's disease patients: the simple answer to a challenging question. Scand J Gastroenterol. 2019;54(1):49–54.
- Meuwis MA, Vernier-Massouille G, Grimaud JC, et al. Serum calprotectin as a biomarker for Crohn's disease. J Crohns Colitis. 2013;7(12):e678–83.
- Lönnkvist MH, Theodorsson E, Holst M, et al. Blood chemistry markers for evaluation of inflammatory activity in Crohn's disease during infliximab therapy. Scand J Gastroenterol. 2011;46(4):420–427.
- Sokol H, Seksik P, Carrat F, et al. Usefulness of co-treatment with immunomodulators in patients with inflammatory bowel disease treated with scheduled infliximab maintenance therapy. Gut. 2010;9:1363–1368.