
Abstract
Introduction: Anastomotic leakage postoperatively in patients operated with rectum resection and primary anastomosis is a common and feared complication. We have studied seven patients with an anastomotic leakage after surgery and compared them with 13 patients without complications.
Methods: Metabolic measurements with microdialysis were done during the first seven postoperative days, with measurements of glucose, pyruvate, lactate and glycerol. The lactate/pyruvate ratio was calculated. Measurements were performed subcutaneously, intraperitoneally and at the anastomosis. The inflammatory cytokines, IL 6 and IL 10, were measured intravenously and intraperitoneally 48 hours postoperatively.
Results: Intravenous and intraperitoneal IL 6 were higher in the leakage group. Around the small intestine (intraperitoneally), we found that patients developing anastomotic leakage had higher lactate and lactate/pyruvate ratio immediately after surgery. They also showed lower glycerol levels. At the anastomosis, we found higher lactate and lactate/pyruvate ratio in anastomotic leak patients after the fourth postoperative day.
Conclusions: The results indicate that a possible mechanism behind an anastomotic leakage is an impaired circulation and thus insufficient saturation to the small intestine peroperatively. This develops into an inflammation both intraperitoneally and intravenously, which, if not reversed, spread within the gastrointestinal tract .The colorectal anastomosis is the most vulnerable part of the gastrointestinal tract postoperatively and hypoxia and inflammation may occur there, and an anastomosis leakage will be the consequence.
Introduction
Anastomotic leakage after colorectal surgery is a common and feared complication. The incidence of anastomotic leakage in Sweden in 2015 was reported by the RCC (Regional Cancer Center) to be 7–12% and mortality at 30 postoperative days to be 1–6% .The results have improved since then, mostly because of a focus on early diagnosis of anastomotic leakage. Anastomotic leakage diagnosis is difficult and will often only be made late, at reoperation. Early in the postoperative phase, computer tomography (CT) with contrast anal enema is often normal in patients who later develop anastomotic leakage [Citation1]. CRP can be of help in diagnosis but only after postoperative days four and five [Citation2,Citation3].
Intraperitoneal microdialysis (IPM) has been introduced as a promising method for the prediction of surgical complications after gastrointestinal surgery [Citation4–9]. IPM studies have been presented in both animals and humans [Citation6,Citation10–15]. An increasing intraperitoneal lactate/pyruvate ratio is a sign of an increased anaerobic metabolism that may develop into inflammation, splanchnic hypoxia and ischemia. This results in a disturbance of anastomosis healing. These early metabolic changes have been seen prior to several postoperative complications [Citation4,Citation5,Citation13,Citation14,Citation16], such as anastomotic leakage and abdominal compartment syndrome. Subcutaneous and intraperitoneal locations of the measurements have been compared [Citation17]. Changes were registered only in the intraperitoneal measurements prior to complications [Citation4,Citation18], suggesting that major surgical complications are preceded by splanchnic hypoxia/ischemia and that the changes are possible to measure by IPM. We have investigated obese and diabetic patients [Citation19] and have not found any differences in the postoperative intraperitoneal lactate/pyruvate ratio compared with control patients. Splanchnic ischemia and proinflammatory cytokine activation have been described as early events in the stepwise development of shock and organ failure [Citation20]. Studies in postoperative cytokine response have shown a higher intraperitoneal inflammatory response, suggesting that the gastrointestinal tract is the major source of the postoperative inflammatory response [Citation18,Citation21,Citation22]. Uninhibited, the inflammatory reaction will spread systemically and several cascade systems will be activated, resulting in shock and organ failure [Citation23]. There are several studies indicating that a primary intestinal ischemia initiates and accelerates an intraperitoneal inflammation, leading to serious complications in postoperative recovery [Citation2,Citation5,Citation9]. This is an observational case-control study to detect early intraperitoneal metabolic changes in patients developing anastomotic leakage after surgery for rectal cancer.
Materials and methods
Patients
Thirty patients with high risk for developing anastomotic leakage were postoperatively investigated after low anterior resection for rectal cancer. After informed consent, patients were included in the study. The patients were divided into two groups according to outcome, leakage group (anastomotic leakage) and non-complication group (free of complications). Ten patients were excluded from the study. Nine because they developed complications other than anastomotic leakage (2 abdominal-wall abscesses,1 intraperitoneal abscess,1 recto-vaginal fistula, 1 pneumothorax, 1 pneumoni, 1 urinary tract infection with retention, 1 subcutaneous wound infection and 1 postoperative atrial flutter) and one because of insufficient postoperative microdialysis, due to catheter failure. Metabolic samples were analyzed every second hour during the first two days and thereafter every sixth hour in the following five days by microdialysis. The inflammatory cytokines, IL 6 and IL 10, were measured intravenously and intraperitoneally 48 hours postoperatively.
In the leak group, there were seven patients (5 men 2 women) with median age 71 years (range 51–89) and median anastomotic level 5 cm (range 3–5). All patients received preoperatively radiation 5 × 5 Gy. Peroperatively four patents were operated with a loop ileostomy, one with a transversostomy and two patients did not receive any defunctioning stoma.
In the free group, there were 13 patients (4 men 9 women) with median age 69 years (range 53–86), median anastomotic level 5.25 cm (range 3–9). Nine patients received 5 × 5 Gy preoperative radiation, one patient 2 × 25 Gy and the remaining three patients did not receive any preoperative radiation treatment. Peroperatively six patients were also operated with a loop ileostomy, two with a transversostomy and five did not receive any defunctioning stoma. The study was approved by the Regional Ethics Committee with the number 2003/94/03.
Microdialysis
Before closing the abdomen, a microdialysis catheter M-dialysis 62 (M-dialysis AB, Stockholm, Sweden) was introduced intraperitoneally through a small incision in the abdominal wall with the M-dialysis needle (M-dialysis AB, Stockholm, Sweden) and placed free floating around the small intestines in the peritoneal cavity. Another catheter was placed with the tip close to the anastomosis (1–2 cm) and fixated through an extraperitoneal placement. The catheters were fixed in the skin with a suture to minimize the risk of unintentional extraction. At the end of surgery, a M-dialysis 60 catheter was inserted subcutaneously in the right pectoral region.
Samples were collected continuously every second hour in microvials (M-dialysis AB, Stockholm, Sweden) from the microdialysis catheters (M-dialysis AB, Stockholm, Sweden) and immediate analysis was performed in the 600 M-dialysis analysator (M-dialysis AB, Stockholm, Sweden).
Cytokines
Samples for the cytokines interleukin 6 (IL 6) and interleukin 10 (IL 10) were collected intraperitoneally from an 18-French pelvic drain every 6th hour during the 48 hours the drain was in place. The samples were analyzed using an enzyme-labeled semi-luminescent sequential immunometric assay upon an Immulite® instrument (DPC, Los Angeles, California, IL, USA), according to the manufacturer’s instructions.
Statistical analyses
There was; no normal distributed values in data. Groups have been compared by the median values for each patient during the whole study and analyzed by Wilcoxon rank sum test using Statistix® 8. A separate analysis has been performed in the same way for the lactate/pyruvate ratio at the anastomosis catheter from day 5 to 7 ( and ). An additional test with Mann–Whitney U test were performed (SPSS® version 25) every 6th hour; significant values are presented in figures.
Table 1. Levels of lactate, lactate/pyruvate ratio and glycerol.
Days 1–7
Table 2. Significant differences between anastomotic and non-complication groups in lactate pyruvate ratios were found at days 5–7 at the anastomotic catheter.
Days 5–7
Results
Intraperitoneal catheter
Lactate/pyruvate ratio
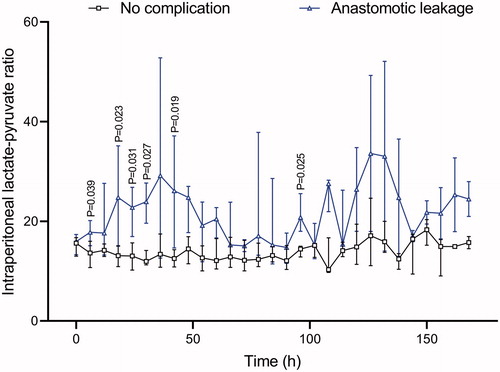
In the non-complication group, values started around 18 and decreased during the study. In the anastomotic leakage group, values around 20 were seen directly postoperatively and they increased to 30 after 36 hours. Levels in the leakage group were higher than those in the non-complication group during the entire study. Median values during the study were 13.8 in the non-complication group versus 25.1 in the leakage group (p < .001) ().
Figure 1. Lactate/pyruvate ratios at the small intestines (intraperitoneally). Anastomotic-leak patients (triangle) and non-complication patients (square). Curves show median values and interquartile range. Statistical analysis every 6th hour; p values are presented in figures.
Glucose
Glucose levels started around 5 mM in both groups immediately after the operation and increased in both groups to values around 10 mM. No significant differences between the groups were seen. The median value in both groups was 7.5 mM (p = .57).
Glycerol
Glycerol levels started around 70 µM in both groups, after which a decline until the 130th postoperative hour was seen in the leakage group, while the non-leakage group showed increasing values. The median value in the non-complication group was 87, as compared with 51 in the complication group (p = .03) ().
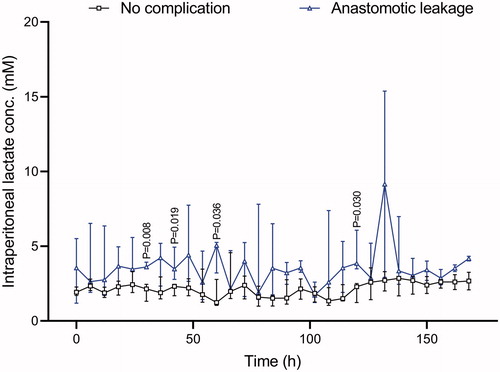
Figure 2. Intraperitoneal lactate. Anastomotic-leak patients (blue triangle) and non-complication patients (black square). Curves show median values and interquartile range. Statistical analysis every 6th hour; p values are presented in figures.
Lactate
Lactate levels in the leakage group started around 4 mM and in the non-complication group around 2 mM. The lactate then rose in the leakage group, but stayed at around 2 mM in the non-complication group. Median values for the whole observation period were 1.92 versus 4.67 mM (p = .009).
Anastomotic catheter
Lactate/pyruvate ratio
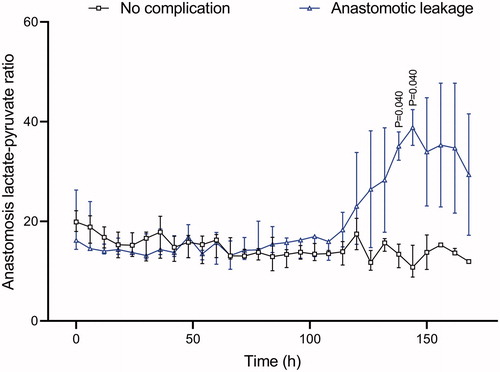
In the anastomotic catheter, no difference was seen between the two groups until after 130 hours. Immediately after the operation, both groups showed values around 20. In the non- complication group, values decreased during the study to around 12. In the leakage group, values were stable around 20 until the 125th-postoperative hour and then increased up to 40. The median value in the non-complication group was 15 versus 21 (p = .41) in the leakage group when comparing all 7 days of the study ().
Figure 3. Lactate/pyruvate ratios at the anastomosis. Anastomotic-leak patients (blue triangle) and non-complication patients (black square). Curves show median values and interquartile range. Statistical analysis every 6th hour; p values are presented in figures.
Glucose
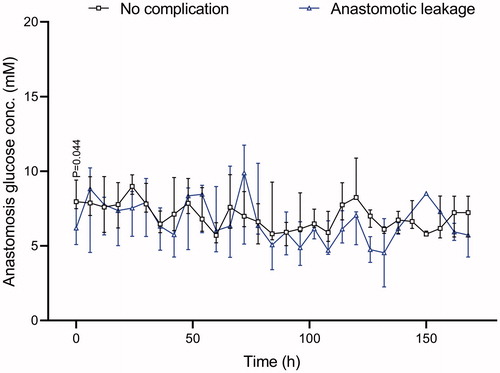
Lower glucose was observed initially but no difference was seen between the two groups during the remaining study. Median values for the groups were 7.45 mM in the non-complication group versus 7.0 mM in the leakage group ().
Figure 4. Glucose at the anastomosis. Anastomotic-leak patients (blue triangle) and non-complication patients (black square). Curves show median values and interquartile range. Statistical analysis every 6th hour; p values are presented in figures.
Glycerol
There were no differences in the glycerol values at the anastomosis. At the start of the study, values were around 80 mM in both groups. A parallel decrease to 50 was then seen. Median values were 71 mM in the non-complication group versus 79 mM in the leakage group (p = .75).
Lactate
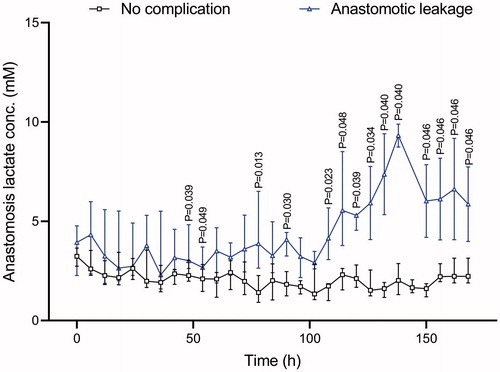
In the leakage group, values were initially around 4 mM, after 100 hours significant higher values in the leakage group, while in the non-leakage group values started just above 3 and then remained stable ().
Figure 5. Lactate at the anastomosis. Anastomotic-leak patients (blue triangle) and non-complication patients (black square). Curves show median values and interquartile range. Statistical analysis every 6th hour; p values are presented in figures.
Subcutaneous catheter
Lactate/pyruvate ratio
The lactate/pyruvate ratio showed no difference between the two groups until after 100 hours. Then, just as in the anastomotic catheter, the ratio increased in the leakage group. Both groups had a ratio close to 10 immediately postoperatively, but then in the leakage group values rose to over 20 after 100 hours, while there was no change in the non-complication group. The median values were 10.3 versus 11.6 (p = .24).
Glucose
Glucose levels at the subcutaneous catheter started at 5.5 mM in both groups. Then they rose slowly in both groups, but no significant difference was seen. Median values were 6.0 mM versus 6.6 mM (p = .63).
Glycerol
The glycerol levels at the start were slightly higher in the leakage group (150 µM) than in the non-complication group (110 µM), increased in parallel during the study. The median value in the leakage group was 299 µM, as compared with 260 µM in the non-complication group (p = .40).
Lactate
The lactate levels were higher in the leakage group at the beginning, and they stayed higher. The median value was 1.71 mM, as compared with 1.25 mM in the non-complication group (p = .10).
Cytokine results
Venous IL 6
Preoperatively this was 5.85 ng/L and increased to 947 ng/L after 30 hours in the leakage group, while in the non-complication group it started at 2.4 ng/L and peaked at 12 hours at 195 ng/L. Significant differences were found at 18–30 hours and after 42 hours. ()
Table 3. IL 6 and IL 10 intravenously and intraperitoneally over the first 48 postoperative hours.
Venous IL 10
Preoperatively in the leakage group this was 4 ng/L and increased over 24 hours to 17.7, while in the non-complication group it started at 4 ng/L and increased to 6.6 ng/L at 18 hours. No significant differences were seen ().
Intraperitoneal IL 6
In the leakage group, the starting value after 6 hours was 159,000 ng/L, which increased to 207,000 after 18 hours. The non-leakage group had a value after 6 hours of 123,000 ng/L, which increased during the first 12 hours, after which a steady decline was seen to 18,650 after 48 hours. Significant differences were seen after 18–24 hours and 48 hours ().
Intraperitoneal IL 10
The leakage group started at 860 ng/L after 6 hours and decreased during the study to 195 ng/L after 48 hours. The non-complication group started at 230 ng/L, increased to 398 ng/L after 12 hours and then decreased to 44 ng/L after 48 hours. No significant differences were seen at any time ().
Discussion
Our study shows early intraperitoneal metabolic disturbances in lactate levels and lactate/pyruvate ratios, as well as changes in interleukin 6 both intravenous and intraperitoneally, in patients later developing an anastomotic leak after rectal resection.
Metabolic samples were analyzed every second hour during the first 48 hours and thereafter every 6th hour by microdialysis, which is a method used for metabolic analysis. The method offers fast bedside analysis, 20 minutes for collecting the sample and 7 minutes for analysis; the result being presented on the screen. A big advantage of the method is that the size of the hole in the catheter-membrane (20 kDa) does not allowed the enzyme lactate dehydrogenase (143 kDa) to get into the sample, and thus the sample is stable, unlike the situation with arterial lactate analyses [Citation10].
There is an ongoing discussion about where to place the IPM catheter [Citation24]. We placed a free-floating around loops of the small intestine. We observed an early postoperative increase of both lactate and the lactate/pyruvate ratio in the leakage group at the intraperitoneal catheter. The anastomotic catheter was placed intraperitoneally near (1–2 cm) the anastomosis and was fixated extraperitoneally in the pelvis. Our results showed increasing values already after 10 hours at the intraperitoneal catheter placed among the small intestines, while the increase at the anastomotic catheter was noted only after 4 postoperative days.
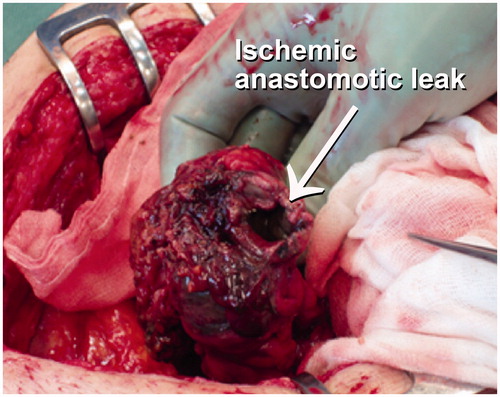
In a clinical postoperative situation in humans, this study supports a free-floating catheter around the loops of the small intestines as the fastest method for early diagnosis of an anastomotic leakage, but it should be combined with an anastomotic catheter and repeated analyses of IL 6 both intravenously and intraperitoneally over the first two postoperative days. Intraperitoneal lactate and the lactate/pyruvate ratio seem to be useful for early detection of anastomotic leakage during the first 48 hours. After 5 days, there is a second lactate/pyruvate ratio peak at the anastomosis, with values around 40 mM. We presume that hypoxia/ischemia and intraperitoneal inflammation of the small intestine detected by the free-floating IPM catheter can be reversed, but that late ischemia of the anastomosis, detected by an anastomotic catheter, may be from ischemia and cell death at the anastomosis ().
Figure 6. Ischemic anastomosis.
Anastomotic leakage was 24% in this patient series. Anastomotic leakage was detected by CT enema in 6 of 7 patients; the seventh patient was acute re-operated due to sepsis. Four of seven patients were operated and the others were treated conservatively. The high leakage rate may be due to the selection of high-risk patients. Another reason to be considered is that IPM leads to increased detection of subclinical leakage.
Increasing values of the lactate/pyruvate ratio have been described in patients developing postoperative complications such as abdominal compartment syndrome and mesenterial ischemia [Citation4,Citation14]. Also there are case reports of heart diseases like myocardial infarction and atrial fibrillation having been detected with increased lactate/pyruvate ratios intraperitoneally [Citation18]. Changes in glycerol, lactate, glucose and pyruvate have also been reported in patients developing surgical complications [Citation6]. Obesity, diabetes and the extent of the operative procedure do not seem to have influenced the results [Citation9], but, in our study, we noticed differences between measurements at different locations. Lactate and lactate/pyruvate ratios are higher in the abdominal cavity, while glycerol levels are higher subcutaneously.
When analyzing metabolism with microdialysis, measurements are performed extracellularly in the peritoneal fluid close to the cells and capillaries. The glucose is delivered to the cells via the capillaries and the intracellular uptake of glucose is regulated by insulin. Glucose is metabolized to pyruvate. Pyruvate is then converted to lactate if the supply of oxygen is insufficient (anaerobic reaction), but in the presence of oxygen (aerobic reaction) pyruvate is converted to acetyl-CoA, and in the mitochondria further reactions in the TCA cycle take place, leading to a more effective energy utilization. The ratio between lactate and pyruvate describes the current relationship between aerobic and anaerobic utilization, and it is more the trend of the curve over time rather than the individual values that best describes the current metabolism [Citation10,Citation25].
It is difficult to present microdialysis data in a group of patients because patients develop anastomotic leak at different times. In this study, every patient with anastomotic leak first shows an increase of the lactate/pyruvate ratio intraperitoneally followed by an increase at the anastomosis before the anastomotic leak is clinically discovered. The changes we see in this study in the leakage group, higher lactate and lactate/pyruvate ratio indicate increased hypoxia/ischemia even if hypermetabolism and increasing anaerobic metabolism could not be excluded as suggested in a previous study [Citation4].
Peroperatively an intraperitoneal drainage was inserted, from which samples for analysis of IL 6 and IL 10 were drawn every 6th hour. At the same time, venous samples were collected for the analysis. Intraperitoneally we found higher IL6 values at 18, 24 and 48 hours postoperatively, while intravenously IL6 values were higher 12–42 hours after the operation, which indicates higher levels of inflammation early in the postoperative period in patients who later develop an anastomotic leak.
In the fat cell, glycerol is bound to three fatty acids to form triacylglycerol. Glycerol is also present in the cell membrane and an increase in glycerol levels can be due to cell damage or increased catabolism of fat cells. Fat cells are metabolized in the fatty acid cycle and also generate compounds (FFA and glycerol) that are fed into the TCA cycle through acetyl-CoA [Citation6,Citation25]. The lower values in glycerol intraperitoneally are probably an effect of higher consumption, due to greater energy demand and inflammation. This hypothesis is also supported by a higher IL 6 in leakage patients.
The small intestine mucosa is very sensitive to changes in circulation and levels of glucose and oxygen. One mechanism behind anastomotic leakage could be insufficient circulation or insufficient glucose and oxygen supply to the small intestines during surgery or immediately postoperatively: for example, because of blood pressure fall or decreased oxygen saturation. This causes a shift to anaerobic metabolism; if these changes are not immediately reversed, a situation with increased ischemia and inflammation in the gastrointestinal tract will develop, which will spread to the vulnerable area around the colorectal anastomosis. Ischemia and cell death will occur and an anastomotic leakage will be the consequence.
Limitations of the study: Patients in high risk to develop anastomotic leakage were selected to the study. It is small one-center case-control observational study.
Disclosure statement
None of the authors have any relevant conflict of interest to declare.
Additional information
Funding
References
- Daams F, Wu Z, Lahaye MJ, et al. Prediction and diagnosis of colorectal anastomotic leakage: a systematic review of literature. World J Gastrointest Surg. 2014;6(2):14–26.
- Matthiessen P, Strand I, Jansson K, et al. Is early detection of anastomotic leakage possible by intraperitoneal microdialysis and intraperitoneal cytokines after anterior resection of the rectum for cancer? Dis Colon Rectum. 2007;50(11):1918–1927.
- Reynolds IS, Boland MR, Reilly F, et al. C-reactive protein as a predictor of anastomotic leak in the first week after anterior resection for rectal cancer. Colorectal Dis. 2017;19(9):812–818.
- Kjell Jansson TJ, Lars Norgren P. Intraperitoneal microdialysis: a new method to monitor patients after abdominal surgery. Int J Intensive Care. 2003;10(1).
- Jansson K, Wickbom M, Skoog P, et al. Intraperitoneal microdialysis-after hemicolectomy and rectal resections as a method for early postoperative complications detection. Int Med Rev. 2017;4(7):1–15.
- Horer TM, Norgren L, Jansson K. Intraperitoneal glycerol levels and lactate/pyruvate ratio: early markers of postoperative complications. Scand J Gastroenterol. 2011;46(7–8):913–919.
- Sabroe JE, Axelsen AR, Ellebaek MB, et al. Intraperitoneal lactate/pyruvate ratio and the level of glucose and glycerol concentration differ between patients surgically treated for upper and lower perforations of the gastrointestinal tract: a pilot study. BMC Res Notes. 2017;10(1):302.
- Daams F, Wu Z, Cakir H, et al. Identification of anastomotic leakage after colorectal surgery using microdialysis of the peritoneal cavity. Tech Coloproctol. 2014;18(1):65–71.
- Ellebaek MB, Daams F, Jansson K, et al. Peritoneal microdialysis as a tool for detecting anastomotic leakage in patients after left-side colon and rectal resection. A systematic review. Scand J Gastroenterol. 2018;53:1625–1632.
- Ungerstedt U. Microdialysis–principles and applications for studies in animals and man. J Intern Med. 1991;230(4):365–373.
- Ungerstedt J, Nowak G, Ericzon BG, et al. Intraperitoneal microdialysis (IPM): a new technique for monitoring intestinal ischemia studied in a porcine model. Shock. 2003;20(1):91–96.
- Risby K, Ellebaek MB, Jakobsen MS, et al. Intraperitoneal microdialysis in the postoperative surveillance of infants undergoing surgery for congenital abdominal wall defect: a pilot study. J Pediatr Surg. 2015;50(10):1676–1680.
- Horer TM, Skoog P, Norgren L, et al. Intra-peritoneal microdialysis and intra-abdominal pressure after endovascular repair of ruptured aortic aneurysms. Eur J Vasc Endovasc Surg. 2013;45(6):596–606.
- Horer TM, Skoog P, Nilsson KF, et al. Intraperitoneal metabolic consequences of supraceliac aortic balloon occlusion in an experimental animal study using microdialysis. Ann Vasc Surg. 2014;28(5):1286–1295.
- Sommer T, Larsen JF. Intraperitoneal and intraluminal microdialysis in the detection of experimental regional intestinal ischaemia. Br J Surg. 2004;91(7):855–861.
- Skoog P, Horer T, Nilsson KF, et al. Intra-abdominal hypertension–an experimental study of early effects on intra-abdominal metabolism. Ann Vasc Surg. 2015;29(1):128–137.
- Jansson K, Jansson M, Andersson M, et al. Normal values and differences between intraperitoneal and subcutaneous microdialysis in patients after non-complicated gastrointestinal surgery. Scand J Clin Lab Invest. 2005;65(4):273–281.
- Jansson K, Redler B, Truedsson L, et al. Postoperative on-line monitoring with intraperitoneal microdialysis is a sensitive clinical method for measuring increased anaerobic metabolism that correlates to the cytokine response. Scand J Gastroenterol. 2004;39(5):434–439.
- Horer T, Norgren L, Jansson K. Complications but not obesity or diabetes mellitus have impact on the intraperitoneal lactate/pyruvate ratio measured by microdialysis. Scand J Gastroenterol. 2010;45(1):115–121.
- Landow L, Andersen LW. Splanchnic ischaemia and its role in multiple organ failure. Acta Anaesthesiol Scand. 1994;38(7):626–639.
- van Berge Henegouwen MI, van der Poll T, van Deventer SJ, et al. Peritoneal cytokine release after elective gastrointestinal surgery and postoperative complications. Am J Surg. 1998;175(4):311–316.
- Tamion F, Richard V, Lyoumi S, et al. Gut ischemia and mesenteric synthesis of inflammatory cytokines after hemorrhagic or endotoxic shock. Am J Physiol. 1997;273(2 Pt 1):G314–21.
- Fiddian-Green RG. Splanchnic ischaemia and multiple organ failure in the critically ill. Ann R Coll Surg Engl. 1988;70(3):128–134.
- Pynnonen L, Minkkinen M, Perner A, et al. Validation of intraluminal and intraperitoneal microdialysis in ischemic small intestine. BMC Gastroenterol. 2013;13:170.
- Angin Y, Beauloye C, Horman S, et al. Regulation of Carbohydrate metabolism, lipid metabolism, and protein metabolism by AMPK. Exp Suppl. 2016;107:23–43.