
Abstract
Objective: The incidence of autoimmune diseases, especially inflammatory bowel disease (IBD), has increased substantially. Globally, there are vast differences varying from 0.2/105 in some Asian countries to over 80/105 in the Faroe Islands. Environmental factors have been suggested as triggers. The aim was to investigate the incidence and prevalence of IBD in the 33 municipalities in the county Scania in Southern Sweden, an area comprising 100 × 100 km with 1,274,069 inhabitants. Furthermore, we wanted to explore whether compounds in the drinking water could contribute to IBD; one report from Norway has suggested that iron in drinking water could contribute to UC.
Methods: Patients with CD and UC were identified through the ICD-10 diagnosis database during the period 2000–2013. Water analyses for pH, alkaline, nitrate, sulphate, iron, magnesium and calcium were based on established methods and compared with the prevalence of IBD using Student’s t-test.
Results: A total number of 8925 patients were identified. The incidence for CD and UC were high (mean 16.4/105, range 13.6–17.9 and 25.3/105, range 21.3–28.0, respectively). The prevalence varied substantially (p < .0001 for both; CD mean 0.30%, range 0.15–0.42 and UC mean 0.42%, range 0.32–0.56). No correlation between IBD and the chemical compounds in the drinking water could be shown.
Conclusions: The incidence rates of both CD and UC were high. The prevalence varied from 200% to 300% between the municipalities, despite the limited geographical area indicating that local conditions are of importance. However, chemical compounds in the water were not associated with this variation.
Introduction
The incidence of inflammatory bowel diseases (IBDs), Crohn’s disease (CD) and ulcerative colitis (UC) have increased 10-fold in certain parts of the world [Citation1,Citation2]. Furthermore, there is also a significant geographical variation with higher incidence rates in the Western world than it is in other regions, such as Asia [Citation2,Citation3]. For example, the Faroe Islands have the highest incidence of IBD in Europe. This higher risk disappeared over time in Faroese immigrants that moved to Denmark. After 1–2 generations, these immigrants had the same IBD incidence as the people in Denmark [Citation4]. In view of these variations, environmental factors are thought to be of great importance.
According to a review article, including 41 original articles, a low intake of fruits and vegetables and a high intake of sugar seems to have some impact on the risk for CD as well as UC, while some definitive conclusions regarding polyunsaturated fatty acids (PUFA) could not be made [Citation5]. This observation is in accordance with the general understanding of pro- and anti-inflammatory effects of different dietary regimes [Citation6–8], but the effect is modest and probably contributes only partly to the risk reduction. Components that are consumed regularly over a longer period of time probably have greater impact than sole/certain specific foods that are consumed on a more irregular basis. Matthias et al. and Chassaing et al. suggest that different additives could play a big role. In addition to sugar and salt, gluten, microbial transglutaminase, nanoparticles, organic acids and dietary emulsifiers are also suggested [Citation9,Citation10]. The mechanism postulated is through disruption of the gut microbiota in combination with increased permeability in the intestine [Citation9,Citation11]. A diet enriched with sugar [Citation12] and salt, trans fatty acids could contribute to this. In parallel, the mucin layer will be reduced partly as a result of dysbiosis [Citation13]. This response is also modulated more than 250 genes contributing to the exaggerated response in the onset of IBD [Citation14].
One factor in our daily diet, which is consumed daily and in significant amounts, is the drinking water. We consume just over one litre of drinking water on average every day and therefore the intake is not to be neglected [Citation15,Citation16]. A study in Norway indicated that increased iron levels in drinking water were associated with the incidence of UC and maybe also CD [Citation17]. Zinc has an impact on the immune function [Citation18] and a few reports suggest a connection between low zinc levels as well as high levels of nitrate and type 1 diabetes [Citation19,Citation20]. Nitrate is also involved in the nitric oxide metabolism and could consequently influence the homeostasis and regulatory mechanisms in the gut [Citation21]. Sulphites are used as preservatives in different alcoholic compounds and are suggested to increase the disease severity in UC. Sulphide is derived from sulphite and is toxic to colonocytes [Citation22–26]. Low pH, increased alkalinity and sulphate in the water increases the corrosive properties of the water, allowing for metals and other compounds in the pipes such as copper to be released from the pipes and dissolved into the water [Citation27], while higher levels of calcium and to some extent magnesium could counteract this effect.
The factors behind IBD are still obscure. Dietary components such as iron and emulsifiers that are consumed within the postulated accepted limits are still suspected to contribute to IBD. In view of these circumstances, it could be worthwhile to investigate factors that are regarded as safe but consumed on a regular basis in measurable amounts. Consequently, the aims of this investigation were consequently to determine and compare the prevalence rates for CD and UC in the 33 different municipalities in the county Scania (Skåne) and to investigate whether the levels of certain chemical compounds in drinking water (pH, alkalinity, nitrate, sulphate, iron, magnesium, calcium and zinc) were associated with these prevalence rates.
Patients and methods
Participants
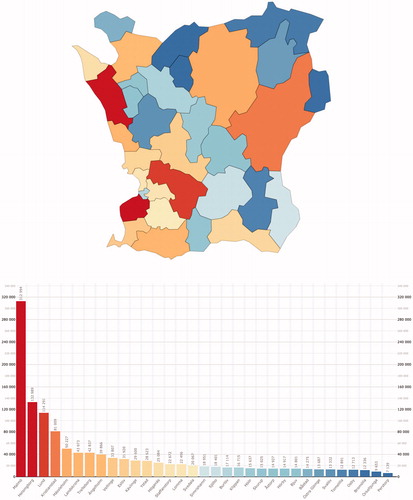
The studied region Skåne is a 100 × 100 km large county in Southern Sweden (10,968 km2) consisting of 33 municipalities (mean number of inhabitants 38,608; range 7139–312,994). The municipalities are mainly small but there are also three somewhat bigger cities with a population exceeding 100,000. Thus, the region of Skåne is of a mixed urban rural type. The population consisted at the end of 2013 of 1,274,069 inhabitants. The distribution of the populations in different municipalities is shown in .
Figure 1. The population in the municipalities of Skåne by the end of 2013. A colour-coded map and bar chart of the population in the municipalities of Skåne by the end of 2013.
Patients with CD and UC were identified from the Skåne county health care production database (Region Skånes Vårddatabas; RSVD), including both outpatient- and inpatient visits, based on ICD-10-codes; K500-K509 and K510-K519, respectively (International Statistical Classification of Diseases and Related Health Problems). Since the vast majority of IBD patients attend the hospital clinics, these registries will include almost every patient with IBD within the county. Furthermore, the validity of these registrations is high with a positive predictive value of 93% for any IBD [Citation28]. In this investigation, data were further analysed also including year of disease onset besides geographical localization, age and gender. Patients were included if they had been diagnosed with CD or UC on two different occasions (to avoid a diagnosis based on something else like, e.g., an infection) during the study period between January 2000 and December 2013. The prevalence rates were based on data from 2013. People who died were excluded from the time of death.
Since patients that were included during the first years of the study period probably got their disease sometimes during the 1990s, participants from the years 2000 to 2003 were excluded from the analysis of the incidence to avoid a falsely high incidence rates these years.
Water analyses
Data on the levels of minerals and trace elements in the drinking water in Skåne are documented by Sveriges Geologiska Undersökning (SGU; i.e., Geological Survey of Sweden). The levels are measured on a regular basis in the outgoing drinking water as well as the tap water distributed by different water treatment plants in all 33 municipalities that Skåne is divided into. This makes it possible to correlate the levels of different substances in the water with the prevalence of IBD in all different municipalities.
If data were missing in the documents received from the SGU, additional data were collected from different water treatment plants in the municipalities. Due to major changes in the water supply of several municipalities during the year 2013, water analyses that were carried out 1 year before the estimation of the prevalence of IBD in all the municipalities were selected. The number of samples collected before 2012 were lower than during 2012 and thus not as reliable.
First and foremost, results of water analyses on outgoing water were used. If the requested parameters; pH, alkalinity (HCO3; mg/l), nitrate (NO3; mg/l), sulphate (SO4; mg/l), iron (Fe; mg/l), magnesium (Mg; mg/l), calcium (Ca; mg/l) and zinc (Zn; mg/l) were not analysed on the outgoing water, tap water samples were used to complete the data. The water analyses were carried out in accord with routine protocols based on established methods analysed by unbiased laboratories. Coverage ratios of the municipal water supply were also collected. To be able to decide whether the levels of some chemical compounds in the drinking water co-varied with the prevalence of IBD, the levels of these minerals and trace elements were compared with the prevalence of IBD in all 33 municipalities in Skåne.
Statistical analysis
The prevalence rates were stated as number of patients per 100,000 inhabitants. The prevalence rates of CD and UC, respectively, in different municipalities were compared with an un-paired two-tailed t-test. Incidence rates were calculated as number of cases per 100,000 person-years under exposure and were reported as mean values and range. Due to skewed distribution of the measured chemical compounds, the median values were used to calculate representative data on mineral content in the water for each water treatment plant. A water representative for each municipality was calculated using weighted mean values based on every water treatment plant and its coverage ratio, respectively. The coverage ratios of different water treatment plants were reported as median percentage with associated quartiles and interquartile range (IQR). The putative differences in minerals between the municipalities were estimated with Kruskall-Wallis rank sum test. Statistical analyses were conducted in SPSS (IBM. SPSS Statistics for Mac. Version 23.0. Armonk, NY: IBM; 2015).
The study was approved by the Committee of Research Ethics at Lund University, Sweden (protocol number 2016/460).
Results
A total number of 9073 patients with IBD were found from the registries. Of them, 122 were excluded due to missing or invalid municipality code numbers and another 26 patients due to wrong ICD-10-codes. Finally, 8925 patients could be included in the study and categorized by type of disease (CD or UC) and municipality. Based on data from 2013 on these 8925 IBD patients, 3732 had CD (1593 females = 43%, mean age 49 years, range 3–100) and 5193 had UC (2609 females = 50%, mean age 52 years, range 2–99).
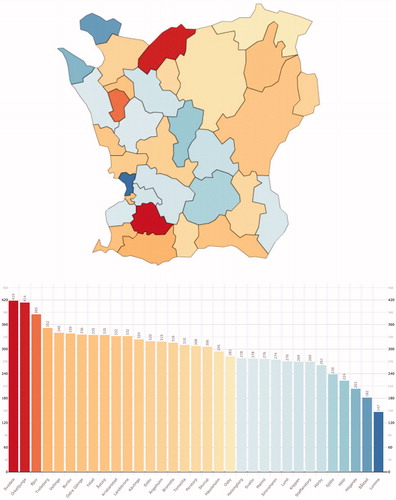
The prevalence rates for CD and UC, respectively, differed significantly between the municipalities (p < .0001 for both; CD mean 0.30%, range 0.15–0.42 and UC mean 0.42%, range 0.32–0.56). Some municipalities had high rates for both CD and UC (such as Svedala) while others had opposing rates (e.g., Örkelljunga or Simrishamn) or low rates (e.g., Staffanstorp or Höör) ( and ).
Figure 2. The prevalence of UC in the municipalities of Skåne 2013. A colour-coded map and bar chart of the prevalence of UC in the municipalities of Skåne by the end of 2013.
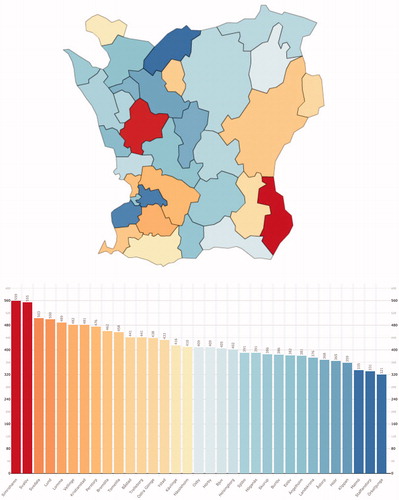
Figure 3. The prevalence of CD in the municipalities of Skåne 2013. A colour-coded map and bar chart of the prevalence of CD in the municipalities of Skåne by the end of 2013.
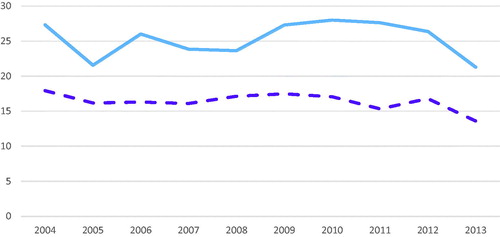
The incidence rates for CD and UC were high and did not differ significantly over time (mean 16.4/105, 95% CI 15.5–17.3 and mean 25.3/105, 95% CI 23.5–27.1, respectively) ().
Figure 4. The incidence rates of CD and UC 2004–2013. A line chart showing the incidence rates for CD (dashed line in purple) and UC (blue line) during a 10-year period (2004–2013).
The water treatment plants in every municipality had varied coverage ratios with a median coverage ratio of 85.5% (Q1 = 74.77, Q3 = 92.89, IQR = 18.13).
Complete data were collected from 29 municipalities. Out of the four remaining municipalities, one was completely excluded due to water supply from too many small water treatment plans. Two lacked data on sulphate levels and one lacked data on both sulphate and nitrate. Median values for the chemical compounds were 8.15 for pH (Q1 = 8.0, Q3 = 8.36, IQR = 0.36), 130.14 mg/l for alkalinity (HCO3; Q1 = 66.31, Q3 = 231.06, IQR = 164.74), 1.79 mg/l for nitrate (NO3; Q1 = 1.10, Q3 = 4.07, IQR = 2.97), 21.30 mg/l for sulphate (SO4; Q1 = 6.59, Q3 = 36.87, IQR = 30.29), 0.03 mg/l for iron (Fe; Q1 = 0.01, Q3 = 0.05, IQR = 0.04), 5.49 mg/l for magnesium (Mg; Q1 = 1.97, Q3 = 6.55, IQR = 4.58) and 33.17 mg/l for calcium (Ca; Q1 = 23.07, Q3 = 54.52, IQR = 31.45). Data on zinc were unfortunately not available to an extent that made any meaningful analysis possible. The levels were all well within the reference values postulated by the National Food Agency, Sweden (and SGU for alkalinity) [Citation29,Citation30]: pH <9.0 and >7.5, alkalinity >30 mg/l, nitrate <20 mg/l, sulphate <100 mg/l, iron <0.1 mg/l, magnesium <30 mg/l and calcium <100 mg/l. There was a vast variation in levels of the chemical compounds between different municipalities ( and ). Despite this, no correlation was found between these parameters and the prevalence rates for CD or UC. The non-existing correlation between prevalence and the seven different chemical compounds are shown in scatter plots ( and ).
Figure 5. Chemical compounds in drinking water in relation to the prevalence of CD. (a) Scatter plots showing the prevalence of CD on the x-axis and the pH of the representative water for each municipality on the y-axis. Reference range 7 < pH < 9. (b) Scatter plots showing the prevalence of CD on the x-axis and the alkalinity of the representative water for each municipality on the y-axis. Reference range HCO3 >30 mg/l. (c) Scatter plots showing the prevalence of CD on the x-axis and the nitrate (NO3) levels of the representative water for each municipality on the y-axis. Reference range NO3 <20 mg/l. (d) Scatter plots showing the prevalence of CD on the x-axis and the sulphate (SO4) levels of the representative water for each municipality on the y-axis. Reference range SO4 <100 mg/l. (e) Scatter plots showing the prevalence of CD on the x-axis and the iron (Fe) levels of the representative water for each municipality on the y-axis. Reference range Fe <0.1 mg/l. (f) Scatter plots showing the prevalence of CD on the x-axis and the magnesium (Mg) levels of the representative water for each municipality on the y-axis. Reference range Mg <30 mg/l. (g) Scatter plots showing the prevalence of CD on the x-axis and the calcium (Ca) levels of the representative water for each municipality on the y-axis. Reference range Ca <100 mg/l.
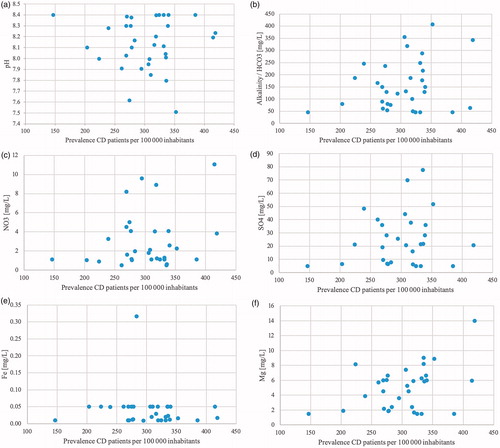
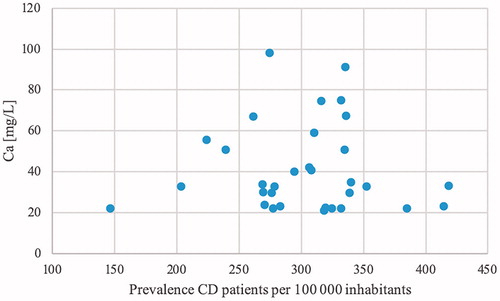
Figure 6. Chemical compounds in drinking water in relation to the prevalence of UC. (a) Scatter plots showing the prevalence of UC on the x-axis and the pH of the representative water for each municipality on the y-axis. Reference range 7 < pH < 9. (b) Scatter plots showing the prevalence of UC on the x-axis and the alkalinity (HCO3) of the representative water for each municipality on the y-axis. Reference range HCO3 >30 mg/l. (c) Scatter plots showing the prevalence of UC on the x-axis and the nitrate (NO3) levels of the representative water for each municipality on the y-axis. Reference range NO3 <20 mg/l. (d) Scatter plots showing the prevalence of UC on the x-axis and the sulphate (SO4) levels of the representative water for each municipality on the y-axis. Reference range SO4 <100 mg/l. (e) Scatter plots showing the prevalence of UC on the x-axis and the iron (Fe) levels of the representative water for each municipality on the y-axis. Reference range Fe <0.1 mg/l. (f) Scatter plots showing the prevalence of UC on the x-axis and the magnesium (Mg) levels of the representative water for each municipality on the y-axis. Reference range Mg <30 mg/l. (g) Scatter plots showing the prevalence of UC on the x-axis and the calcium (Ca) levels of the representative water for each municipality on the y-axis. Reference range Ca <100 mg/l.
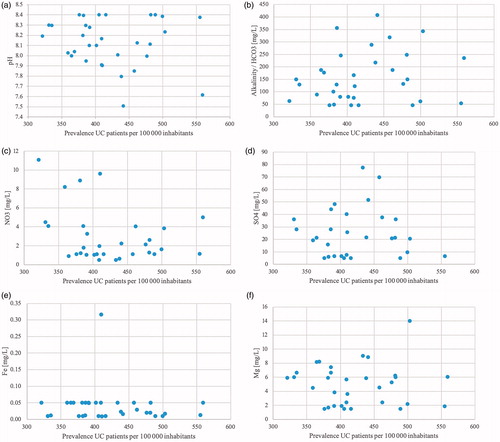

Table 1. Water content of every municipality in Skåne.
Table 2. Median values for the investigated chemical compounds.
Discussion
In this study, a significant difference was found in the prevalence of CD and UC between the 33 municipalities in Skåne ( and ). For CD, the highest prevalence was 418 patients/100,000 inhabitants, which is 2.85 times higher than the lowest prevalence of 146 patients/100,000 inhabitants. For UC, the highest prevalence was 559 patients/100,000 inhabitants, which is 1.74 times higher than the lowest prevalence of 321 patients/100,000 inhabitants. In contrast, no significant correlation was found between these prevalence rates and the chemical compounds.
The incidence for both CD and UC was rather stable during the fairly long 10-year observation period. The levels are well in accord with those found in other countries within the Western world, that is, with similar environmental circumstances [Citation1,Citation2,Citation4,Citation31]. However, this is in contrast to a recent Danish investigation where the incidence has been steadily increasing over a longer time span for around 50 years. It remains to be seen whether our observation is in line with a stabilisation of this epidemic or merely a shorter period of standstill before the incidence starts to increase again. An argument for the latter could be a recent investigation from Uppsala in the middle of Sweden where the incidence of UC is still increasing [Citation31].
An interesting notion is the unevenly distributed prevalence rates. Some municipalities had opposing rates (high in CD and low in UC and vice versa) and some had high or low prevalence rates in both diseases. The municipalities that had the absolute highest and lowest prevalence rates are almost exclusively smaller municipalities with populations in the low/mid-range. Some of these administrative regions are fairly small; the mean population of all the municipalities being only 38,608 inhabitants and only three of these had a population above 100,000 inhabitants. Despite this, there are significant differences in both the prevalence of CD as well as UC. It could be speculated that autoimmune diseases such as CD or UC should be more prevalent in bigger cities with better availability to health care but also with harmful agents such as stress, air pollution and so on, but instead, it was some of the minor municipalities that were affected to a larger extent. This was the case for both CD and UC, something that strengthens this observation. The reason for this discrepancy is unclear. The mean age differed between 38.4 (Lund, a university town) and 48.7 (Simrishamn, a small town in rural environments) years, but there was no association with the prevalence rates (data not shown). A longer distance to hospitals could influence both incidence and prevalence, but in Skåne, there are 10 hospitals within a range of 100 × 100 km why this is less likely to have any impact. There are differences in both education and socioeconomic status between cities and rural areas, but these discrepancies have not previously been shown to influence the occurrence of autoimmunity [Citation32]. Most previous studies have based their data on a national level and detected differences in, for example, GNP or latitude [Citation33–36]. However, these findings do not explain the differences between towns or rural areas within this limited region. Also in the Norwegian study, vast differences between the municipalities were apparent but in that case with an association with the iron levels [Citation17].
Even though there was a marked variation in the levels of certain chemical compounds, we could not find any indication that the recorded levels could have any impact on the risk for IBD, neither CD nor UC. In Sweden, the infrastructure for water supply is well organised and functions well most of the time although occasional accidents may occur over the years. The levels for the analysed substances are well within the ranges that are postulated by the National Food Agency, Sweden [Citation29]. On the other hand, it is still possible that substances regarded as harmless could have a negative impact on certain diseases anyway, such as, for example, the unexpected association between high salt intake and multiple sclerosis [Citation37]. Therefore, it is still necessary to rule out ordinary compounds that are present in our diet on a regular basis and regarded as safe.
Furthermore, of course other compounds in the drinking water could be contemplated to influence the risk. Bacterial contamination could contribute but analyses of bacterial content are carried out on a regular basis, and if any signs of decontamination should be at hand the distribution is stopped and the population is warned. Therefore, this mechanism is less likely to occur. In view of the fact that some minor municipalities had higher prevalence of IBD, toxic agents used in the rural environment could be suspected. This is the case in primary biliary cholangitis and scleroderma as well as in the neurodegenerative Parkinson’s disease where compounds used in the industry such as dissolving agents but also pesticides used in farming are associated with these diseases [Citation38]. However, it was not within the aims of this study to investigate these correlations. This is yet to be done.
The only clear association reported until now between water content and IBD is the study by Aamodt et al. [Citation17]. They found an association between iron levels in the drinking water and the incidence of CD and UC when the iron content was increased by 0.1 mg/l. However, their accepted upper cut-off limit in drinking water was 0.2 mg/l why this excess risk still is limited. This report showed no such correlation. Iron levels in this report were between 0.01 and 0.05 mg/l in 31 of the 32 municipalities and this is a result of precipitation, oxidation and filtration, where the iron is actively removed from the water to levels <0.05 mg/l. The reasons are several and include keeping taste and colour neutral, but there have also been reports about high iron levels as the cause of diarrhoea (Britt-Marie Pott, process engineer at Sydvatten, personal communication). Most of the water analyses reported iron levels of <0.05 mg/l or <0.02 mg/l. Consequently, in Skåne, the processing of the water eliminates any possible impact on high iron levels on the occurrence of IBD.
The strength of this study is the population size of 8925 patients in a region with almost 1.3 million inhabitants were included in the study. The number of patients is high why it is probable that the observed differences in CD and UC prevalence may be true and not only the result of random variation. In view of these discrepancies, environmental and/or lifestyle factors are therefore likely to play a substantial role in the pathogenesis of both CD and UC.
The major limitation of this study is its cross-sectional design. To follow the population prospectively and to correlate the incidence with the water content year by year would be appropriate for estimation of the association between exposure and disease onset but that is not possible with a retrospective design. Furthermore, we only have access to data on compounds in the water for one year. The number of patients that developed UC and CD the following year was 241, a much smaller group than the 8925 that we have chosen to study. We have information about how many that suffer from IBD in every municipality and can compare that with the amount of chemical compounds and indirectly achieve an estimation of whether an association exists. A comparison on an individual level with water analyses on the tap water of every single patient would have resulted in greater statistical power. Individual patients may also have their own wells with insufficient water or may have chosen to drink beverages to a larger extent than the general population. If patients are clustered in any way, this will not be detected either. Consequently, the risk of so called ecological fallacy must be taken into account. As described in the introduction, corrosion as a result of, for example, low pH, high alkalinity and so on could affect the water content by precipitating compounds such as heavy metals or other harmful agents from the pipes. This could be considered a limitation due to the risk of corrosion affecting the mineral levels of the water and thus contributing to a non-representative water on a municipality level. The outgoing water was therefore considered more representative on a group level for all the patients in one municipality, than few tap water analyses most likely not collected from IBD patients (>99% of the population do not have IBD). However, the variation in the investigated chemical compound levels was low over time and between analyses (data not shown), why the levels reported probably are accurate.
Another limitation is the fact that each patient’s address was retrieved in 2013 and not at the time for disease onset. It has not been possible to take into consideration if they had moved between municipalities or even counties before the time for registration. According to the data from Statistics, Sweden 11% of the inhabitants in Skåne moved during 2013 [Citation30]. This could have impact both on the calculated incidence rates and on the estimated effect of different chemical compounds. Furthermore, patients who work outside their residential municipality might consume a substantial part of their daily water intake elsewhere than in their residential municipality. Within the county, people more often live in the smaller municipalities but work in the bigger cities; four of the five bigger cities had a net inflow of people that worked in the town but lived outside, while the opposite was apparent for the smaller municipalities [Citation30]. Finally, the time between exposure for potentially hazardous compounds and disease onset is not known for IBD. Nevertheless, even when these confounders are taken into smaller consideration, the majority of the population as well as the content of different compounds has been fairly stable over the years. If any of the compounds had any major impact on IBD, it would probably have been revealed.
Conclusion
Significant differences in prevalence rates of CD and UC were found between the 33 municipalities in Skåne. Consequently, environmental factors within the region and between municipalities seem to differ in impact. However, no significant correlation between these prevalence rates and the chemical compounds measured in drinking water was found. Analyses of drinking water on an individual level could potentially have resulted in a different outcome.
Acknowledgements
The author thanks the Health navigator for preparing patient data, Anna Åkesson for valuable statistical advice and calculations, Elin Meigård for technical support and all other persons we have been in contact with in the municipalities of Skåne for supporting this study. Furthermore, this investigation would not have been possible without helpful guidance and information about water and analyses provided by Peter Dahlqvist and Lena Maxe at SGU, Britt-Marie Pott and Christina Hansson at Sydvatten, Mikael Areskoug at VASYD and Lilian Rundström at NSVA.
Disclosure statement
No potential conflict of interest was reported by the authors.
References
- Lapidus AB. [Strong increase of IBD-still not clear why]. Lakartidningen. 2009;106(45):2980–2982.
- Molodecky NA, Soon IS, Rabi DM, et al. Increasing incidence and prevalence of the inflammatory bowel diseases with time, based on systematic review. Gastroenterology. 2012;142(1):46–54 e42. quiz e30.
- Ng WK, Wong SH, Ng SC. Changing epidemiological trends of inflammatory bowel disease in Asia. Intest Res. 2016;14(2):111–119.
- Hammer T, Lophaven SN, Nielsen KR, et al. Inflammatory bowel diseases in Faroese-born Danish residents and their offspring: further evidence of the dominant role of environmental factors in IBD development. Aliment Pharmacol Ther. 2017;45(8):1107–1114.
- Spooren CE, Pierik MJ, Zeegers MP, et al. Review article: the association of diet with onset and relapse in patients with inflammatory bowel disease. Aliment Pharmacol Ther. 2013;38(10):1172–1187.
- Aspelund T, Gudnason V, Magnusdottir BT, et al. Analysing the large decline in coronary heart disease mortality in the Icelandic population aged 25–74 between the years 1981 and 2006. PLoS One. 2010;5(11):e13957.
- Lundberg JO, Carlstrom M, Larsen FJ, et al. Roles of dietary inorganic nitrate in cardiovascular health and disease. Cardiovasc Res. 2011;89(3):525–532.
- Keys A, Mienotti A, Karvonen MJ, et al. The diet and 15-year death rate in the seven countries study. Am J Epidemiol. 1986;124(6):903–915.
- Matthias T, Jeremias P, Neidhofer S, et al. The industrial food additive, microbial transglutaminase, mimics tissue transglutaminase and is immunogenic in celiac disease patients. Autoimmun Rev. 2016;15(12):1111–1119.
- Chassaing B, Koren O, Goodrich JK, et al. Dietary emulsifiers impact the mouse gut microbiota promoting colitis and metabolic syndrome. Nature. 2015;519(7541):92–96.
- Johansson ME. Mucus layers in inflammatory bowel disease. Inflamm Bowel Dis. 2014;20(11):2124–2131.
- Lustig RH, Schmidt LA, Brindis CD. Public health: the toxic truth about sugar. Nature. 2012;482(7383):27–29.
- Fischer H, Holst E, Karlsson F, et al. Altered microbiota in microscopic colitis. Gut. 2015;64(7):1185–1186.
- Xavier RJ, Podolsky DK. Unravelling the pathogenesis of inflammatory bowel disease. Nature. 2007;448(7152):427–434.
- Hynds PD, Misstear BD, Gill LW. Investigation of water consumption patterns among Irish adults for waterborne quantitative microbial risk assessment (QMRA). J Water Health. 2012;10(3):453–464.
- Roche SM, Jones AQ, Majowicz SE, et al. Drinking water consumption patterns in Canadian communities (2001–2007). J Water Health. 2012;10(1):69–86.
- Aamodt G, Bukholm G, Jahnsen J, et al. The association between water supply and inflammatory bowel disease based on a 1990–1993 cohort study in southeastern Norway. Am J Epidemiol. 2008;168(9):1065–1072.
- Suwendi E, Iwaya H, Lee JS, et al. Zinc deficiency induces dysregulation of cytokine productions in an experimental colitis of rats. Biomed Res. 2012;33(6):329–336.
- Samuelsson U, Oikarinen S, Hyoty H, et al. Low zinc in drinking water is associated with the risk of type 1 diabetes in children. Pediatr Diabetes. 2011;12(3pt1):156–164.
- Benson VS, Vanleeuwen JA, Taylor J, et al. Type 1 diabetes mellitus and components in drinking water and diet: a population-based, case-control study in Prince Edward Island, Canada. J Am Coll Nutr. 2010;29(6):612–624.
- Jadert C, Petersson J, Massena S, et al. Decreased leukocyte recruitment by inorganic nitrate and nitrite in microvascular inflammation and NSAID-induced intestinal injury. Free Radic Biol Med. 2012;52(3):683–692.
- Jowett SL, Seal CJ, Pearce MS, et al. Influence of dietary factors on the clinical course of ulcerative colitis: a prospective cohort study. Gut. 2004;53(10):1479–1484.
- Nakamura Y, Labarthe DR. A case-control study of ulcerative colitis with relation to smoking habits and alcohol consumption in Japan. Am J Epidemiol. 1994;140(10):902–911.
- Andrade MC, Vaz NM, Faria AM. Ethanol-induced colitis prevents oral tolerance induction in mice. Braz J Med Biol Res. 2003;36(9):1227–1232.
- Elamin EE, Masclee AA, Dekker J, et al. Ethanol metabolism and its effects on the intestinal epithelial barrier. Nutr Rev. 2013;71(7):483–499.
- Magee EA, Edmond LM, Tasker SM, et al. Associations between diet and disease activity in ulcerative colitis patients using a novel method of data analysis. Nutr J. 2005;4(1):7.
- Vargas IT, Fischer DA, Alsina MA, et al. Copper corrosion and biocorrosion events in premise plumbing. Materials (Basel). 2017;10(9):1036.
- Jakobsson GL, Sternegård E, Olén O, et al. Validating inflammatory bowel disease (IBD) in the Swedish National Patient Register and the Swedish Quality Register for IBD (93BREG). Scand J Gastroenterol. 2017;52(2):216–221.
- Författningssamling Sl. Livsmedelsverkets föreskrifter (SLVFS 2001:30) om dricksvatten. Livsmedelsverket; 2001 [cited 2017 Dec 22]. Available from: https://www.livsmedelsverket.se/globalassets/om-oss/lagstiftning/dricksvatten—naturl-mineralv—kallv/slvfs-2001-30-hela_foreskriften.pdf.
- Statistics Sweden. Available from: www.scb.se
- Sjoberg D, Holmstrom T, Larsson M, et al. Incidence and natural history of ulcerative colitis in the Uppsala Region of Sweden 2005–2009 – results from the IBD cohort of the Uppsala Region (ICURE). J Crohns Colitis. 2013;7(9):e351–e357.
- Larsson JK, Sonestedt E, Ohlsson B, et al. The association between the intake of specific dietary components and lifestyle factors and microscopic colitis. Eur J Clin Nutr. 2016;70(11):1309–1317.
- Shapira Y, Agmon-Levin N, Shoenfeld Y. Defining and analyzing geoepidemiology and human autoimmunity. J Autoimmun. 2010;34(3):J168–77.
- Selmi C. Autoimmunity in 2010. Autoimmun Rev. 2011;10(12):725–732.
- Shoenfeld Y, Selmi C, Zimlichman E, et al. The autoimmunologist: geoepidemiology, a new center of gravity, and prime time for autoimmunity. J Autoimmun. 2008;31(4):325–330.
- Bach JF. [Current concepts of autoimmunity]. Rev Neurol (Paris). 2002;158(10 Pt 1):881–886.
- Farez MF, Fiol MP, Gaitan MI, et al. Sodium intake is associated with increased disease activity in multiple sclerosis. J Neurol Neurosurg Psychiatry. 2015;86(1):26–31.
- Pezzoli G, Cereda E. Exposure to pesticides or solvents and risk of Parkinson disease. Neurology. 2013;80(22):2035–2041.