
Abstract
Aim/Objective: Ulcerative colitis (UC) is a chronic inflammatory bowel disease. In UC, a wide range of criteria are used for disease remission, with few studies investigating the differences between disease remission and normal control groups. This paper compares known inflammatory and healing mediators in the mucosa of UC in clinical remission and normal controls, in order to better describe the remission state.
Method: Mucosal biopsies from 72 study participants (48 UC and 24 normal controls) were included from the Advanced Study of Inflammatory Bowel Disease (ASIB Study), Arctic University of Norway, Norway. Clinical remission was defined as Mayo clinical score ≤ 2, with endoscopic subscores of ≤ 1. Targeted gene transcription analyses were performed using hydrolysis probes and SYBR-green.
Results: Among the mucosal transcripts examined, 10 genes were regulated in remission versus normal controls, 8 upregulated pro-inflammatory transcripts (IL1B, IL33, TNF, TRAF1, CLDN2, STAT1, STAT3 and IL13Ra2) and 2 downregulated (pro-inflammatory TBX21 and anti-inflammatory TGFB1). In total, 14 transcripts were regulated between the investigated groups. Several master transcription factors for T-cell development were upregulated in patients with Mayo endoscopic score of 1 in comparison to 0.
Conclusions: The mucosa of UC in clinical and endoscopic remission differs from normal mucosa, suggesting a remaining dysregulation of inflammatory and wound healing mechanisms.
Introduction
Ulcerative colitis (UC) is a chronic relapsing inflammation of the colon. In the north European population, up to 0.5% are affected by UC, with a yearly healthcare cost estimated at 4.6–5.2 bn. Euros [Citation1,Citation2]. The etiology of the disease is not fully established but the four factors; genetic susceptibility, immune dysregulation, environmental factors and the gut microbiome are currently thought to play a central role in the pathogenesis of UC [Citation3–5]. While only surgery is curative, immune-suppressive drugs have proved to be the most effective pharmacological treatment of the disease. In particular anti-tumour necrosis factor (TNF) therapy has shown to be crucial in treatment of severe cases [Citation6,Citation7].
The disease activity of UC is cyclical, which means treatment is given when the patient has flare-ups and stopped or de-escalated when the patient is in remission after short- or long-term maintenance treatment. The term ‘disease remission’ is widely used in UC, however, there is no consensus on what constitutes remission. The latest ECCO guidelines (2017) suggest a combination of clinical parameters (stool frequency ≤ 3/day with no bleeding) and no mucosal lesions by endoscopy [Citation8]. The British Society of Gastroenterology`s IBD guidelines define clinical remission as mayo score ≤2 and no individual score ≤ 1 [Citation9]. The lack of consensus has given rise to many different terms such as mucosal healing, histological remission and deep remission. In clinical studies, the Mayo endoscopic grade is often used for determining remission, with scores of 0 and 1 both accepted as ‘remission mucosa’ [Citation10–12]. Although, latest reviews suggests Mayo 0 as treatment target [Citation13]. Unfortunately, there are no studies comparing this two-value score on a translational level and this represents a knowledge gap. Altogether, these issues make it challenging for the clinician to evaluate whether a patient is in disease remission or not.
By investigating the difference between normal and mucosa in clinical remission, without the distortion of inflammation, we can get a better understanding of immunological dysfunction in UC, with special emphasis on endoscopic Mayo score 0 versus 1. Therefore, the objective of this study was to describe the colonic mucosa of patients that are in clinical and endoscopic remission with a focus on cytokine expression and signaling.
Material and methods
This study is a part of the Advanced Study of Inflammatory Bowel (ASIB) prospective study at the University Hospital of Northern Norway, Tromsø. All study participants gave written, informed consent. The study and storage of biological material was approved of by the Regional Committee (REK Nord ID:2012/1349).
Study populations
Participants with UC according to established diagnostic definitions [Citation8] were recruited from the ASIB study. An overview is presented in . For the remission group, we recruited primarily patients with moderate/severe disease who had been treated with anti-TNF. Inclusion criteria: age between 18 and 80, Mayo clinical score of 0 or 1, with endoscopic subscore of 0 or 1. No points were allowed on rectal bleeding feature and a total Mayo score larger than 1 was not included [Citation8].
Table 1. Baseline characteristics in ulcerative colitis in clinical remission, active and in normal controls.
UC active inclusion criteria were: Total Mayo score above 2 and endoscopic subscore of 2 or above [Citation14]. Endoscopic signs active UC and no inflammation of ileum.
A control group of non-IBD patients screened with colonoscopy for colorectal cancer or mild gastrointestinal symptoms were included. Criteria for healthy controls where no diarrhea or other irritable bowel symptoms, as well as a completely normal endoscopy, with no polyps in sigmoid and no hyperplastic polyps in rectum lager than 5 mm.
Gene transcription measurement
The gene analysis was performed as close to the MIQE guidelines as possible [Citation15]. Two different qPCR methods were used (Hydrolysis probe and SYBR-green).
Biopsy preparation
Biopsy collection was done during routine colonoscopies and immediately immersed in RNAlater (Qiagen N.V, Venlo, the Netherlands) and kept in room temperature for at least 24 h prior to storage at -80 °C.
RNA preparation
The biopsy sizes were within the range of 3–10 mg. The sample was then homogenized in the MagNa lyser instrument (Roche Diagnostics, Etterstad, Norge) for 40 s at 6500 rpm. After the sample was disrupted and lysated it was centrifuged for 3 min at 13,000 rpm. Total RNA extraction was done with QiaCube and AllPrep DNA/RNA mini kit (Qiagen N.V, Venlo, the Netherlands) according to the AllPrep DNA/RNA mini protocol for animal cells and tissue. Total RNA samples were stored at −80 °C. Total RNA concentrations were measured with Qubit® 3.0 Fluorometer (Thermofischer, Waltham, Massachusetts, USA). The RIN values averaged 8.4 (SD 1.7) as measured by an Agilent Bioanalyzer (Agilent Technologies Inc., Santa Clara, California, USA). cDNA synthesis was done with RT2 First Strand Kit using 0.5ug of total RNA.
Reverse transcription
Reverse transcriptions for the hydrolysis probe assays were performed with QuantiNova Reverse Transcription Kit, while, the SYBR-green assays utilized RT2 First strand Kit according to manufacturer’s instructions.
qPCR
Levels of mRNA for the selected genes, were determined by real-time quantitative polymerase chain reaction (qPCR) on a BioRad CFX connect 96-well thermal cycler (Bio-Rad Laboratories AB, Hercules, California, United States). The dual labeled hydrolysis probes (TaqMan) were done with the QuantiNova Probe RT-PCR Kit (Qiagen); and the SYBR-green assays were done with the RT2 Profiler kit(Qiagen), all according to the manufacturer’s instructions.
Thermal cycler protocol
The plates had a positive, negative and genomic control. All plates were read at standardized threshold values. For the hydrolysis probe assays a 2-step protocol was used: Denaturation 95 °C for 2 min, then [95 °C/5 s and 60 °C/5 s] repeated 40 times. All genes were normalized to Beta Actin (ACTB).
For the SYBR-green assays, a 2-step protocol was used: denaturation at 95 °C for 10 min, then [95 °C/15 s and 60 °C/60 s] repeated 40 times. All genes were normalized to the geometric mean between HPRT1 and RPLP0 as recommended by NormFinder analysis [Citation16].
Primer design
The primers and hydrolysis probes for the experiment were designed using Beacon Designer v8 (PREMIER Biosoft International, Palo Alto, USA). To ensure specificity for mRNA, all probes spanned exon splicing sites and all primers and probes were run through a BLAST search to ensure specificity for the mRNA sequence in question. The efficiency of all assays were measured by analysis of a dilution series from a biopsy extract (Table S1). Primers and probes were ordered from Eurogentec, (Kaneka Eurogentec S.A, Seraing, Belgium).
SYBR-green PCR array
The SYBR-green assays were prefabricated plates that were ordered from Qiagen with 26 genes picked by association to TNF, t-cell differentiation and barrier permeability. An additional 3 were selected as reference genes, where 2 were used.
Statistics
Statistics were performed using IBM SPSS Statistics 24 and R statistics version 3.4.3 and Rstudio Version 1.1.442. Assumption of normality was investigated with histograms, Q-Q plots and Shapiro–Wilks test. Two-way ANOVA models were used to compare groups. Genes that did not display normal distribution were evaluated with appropriate non-parametric tests. To investigate the difference between the groups in we did a linear model to find the coefficient between clinical status groups and then calculated fold change (FC = 2-ΔΔCT). Benjamini Hochberg correction for multiple comparisons was calculated. All tests were two-sided and p-values below .05 were considered significant. The adjusted model used in the hydrolysis probe data set was diagnosis (UC or normal) by gene, adjusted for gender, age, Geboes score and endoscopic score. The same method was applied to the SYBR-green dataset but because of power issues the model was reduced to only include clinical status, age and gender.
Results
Overview of the differently expressed genes
In total, 22 gene transcripts were analyzed using a hydrolysis probe (). Between UC remission and controls five of these genes, TBX21, TNF, IL1B, TGFB and IL33 showed a significant difference (). Twenty-nine genes transcripts were analyzed with SYBR-green () assays on three groups (UC active, UC remission and controls). Between UC remission and controls five genes (TRAF, CLDN2, IL13RA2, STAT1, STAT3) were differently expressed (). These five and an additional five were regulated between UC active and controls with the SYBR-green assays (ADAM17, CASP8, CHUK, DEFB1, TFF3; ). Overview of differently transcribed genes between clinical remission mucosa and controls in regard to gene relationship are shown in .
Figure 1. Volcano plot demonstrating differentially regulated genes between clinical remission and normal controls when adjusted for age, gender, endoscopic score and Geboes score. *TBX21 is analyzed with a nonparametric method (Mann–Whitney U-test). Genes analyzed with hydrolysis probe. All named genes are significant (<.05) and genes on the left-side are down-regulated, conversely, genes on the right-side are up-regulated.
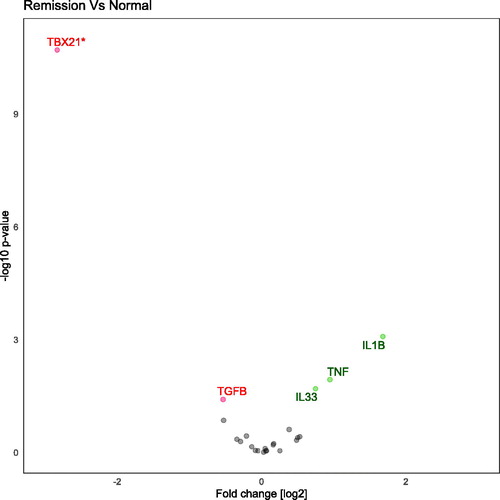
Figure 2. Volcano plot demonstrating differentially regulated genes when comparing Ulcerative colitis in clinical remission to normal controls. Genes are analyzed with SYBR-green and are adjusted for age and gender. Genes on the left-side are down-regulated and genes on the right-side are up-regulated.
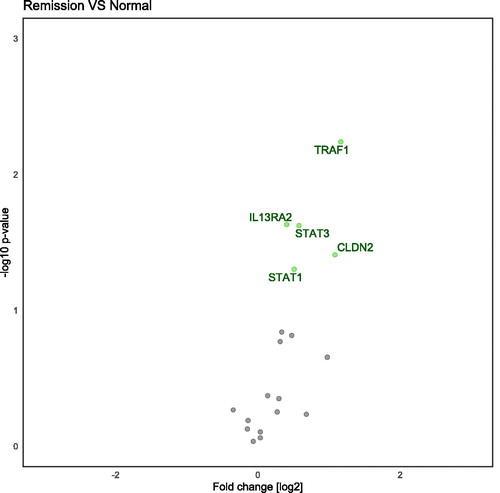
Figure 3. Volcano plot demonstrating differentially regulated genes when comparing active Ulcerative colitis to normal controls. Genes are analyzed with SYBR-green and are adjusted for age and gender. Genes on the left-side are down-regulated and genes on the right-side are up-regulated.
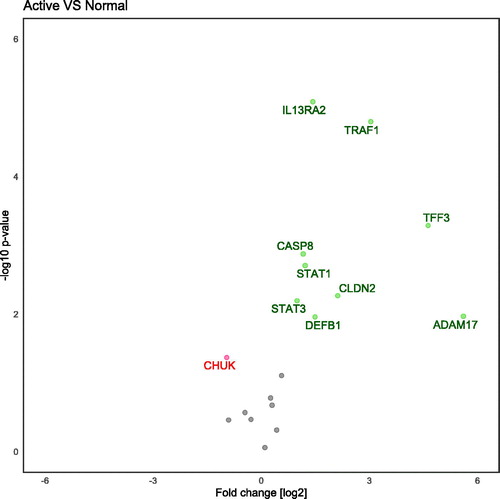
Table 2. All tested genes by the analysis method.
Table 3. Hydrolysis probes results are adjusted for age, gender, endoscopic subscore and Geboes score. SYBR-green results are adjusted for age and gender.
Hydrolysis probe assays: Difference in mucosal transcripts between clinical remission and normal controls
Patients in clinical remission had 3.2-fold higher transcription of IL1B than control (p = .001). IL1B also displayed a gender difference where males had a fold change of 5.3 compared to 2.2 in females. IL33 and TNF were up-regulated in clinical remission compared to control; FC= 1.7 (p = .02), and 2.0 (p = .01), respectively. TBX21 and TGFB1 were less expressed in clinical remission patients, FC = 0.2 (p < .001) and FC= 0.7 (p = .038), respectively. Almost all genes were significantly associated with the endoscopic subscore, see Table S2. Benjamini–Hochberg correction for multiple comparison sets a p-value of p < .01.
SYBR-green assays: Mucosal transcripts differs between clinical remission, active disease and normal controls
Ten genes were significantly different when comparing active disease and control with the SYBR-green assays (). Of these 10, five genes were still upregulated when remission mucosa was compared to control (). The following genes were differentially expressed: Adam17 (p = .013), CASP8 (p = .001), CHUK (p = .006), CLDN2 (p = .016), DEFB1 (p = .029), IL13RA2 (p < .001), STAT1 (p = .007), STAT3 (p = .016), TFF3 (p = .001), TRAF1 (p = .001), see . Benjamini–Hochberg correction for multiple comparison sets a p-value of .019. The interaction term between gender and clinical status was significant for STAT1, CLDN2 and TRAF1.
Difference in subscore Mayo 1 and 0
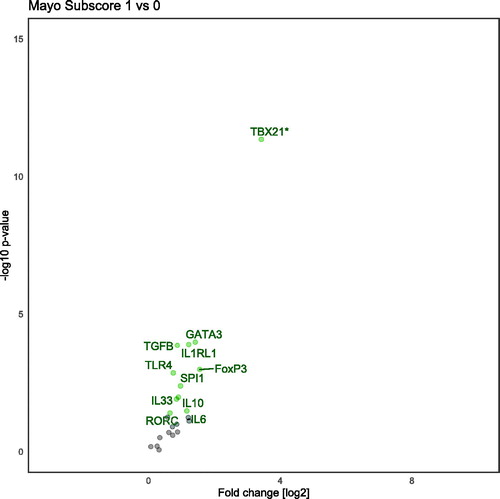
When comparing the clinical endoscopic Mayo score of 1 and 0 we found several genes that were differentially transcribed. Following adjustment for age and gender, 11 genes were found significantly up-regulated in Mayo endoscopic subscore 1 compared to subscore 0 ().
Figure 4. Volcano plot demonstrating differently translated genes between mayo endoscopic score 0 and 1. Analyzed with hydrolysis probe. Several transcription factors for T-cell development are up-regulated.
Discussion
The main findings of the present study are 1: We found 10 differentially transcribed genes between patients in clinical remission and subjects with normal mucosa. Of these 10 genes, eight pro-inflammatory were up-regulated and two (pro-inflammatory TBX21 and anti-inflammatory TGFB1) were down-regulated ( and ). 2: In addition, we found several T-cell transcription factors to be up-regulated in Mayo subscore 1 in comparison with 0 (). The difference in transcription was small for most of the tested genes, this could be explained by the lack of active inflammation that could distort the results. As expected, the pro-inflammatory genes were up-regulated in active UC and the inhibitory genes, such as CHUK, were down-regulated.
The transcriptional difference between Mayo subscore 0 and 1
Our results show a difference in transcription between the Mayo endoscopic score (MES) of 0 and 1. Previous papers have shown that a MES of 0 gives a favorable outcome in relation to clinical remission rates [Citation17–19]. All genes that were differentially transcribed were up-regulated in MES 1. Interestingly, most of the up-regulated genes were transcription factors for T-cell differentiation: TBX21, GATA3, SPI1, RORC, FOXP3 that are central transcription factors for TH1, TH2, TH9, TH17, and Treg, respectively. This finding indicates that the t-cell differentiation of these linages of are still active in the Mayo subscore 1 score. Worth noticing is that TBX21 is down-regulated in the remission mucosa compared to normal mucosa, but up-regulated in the MES 1 compared to MES 0. This could be because of medication suppressing t-cell development and the slightly increased cellularity one expects to find in mildly inflamed mucosa. The up-regulation the anti-inflammatory cytokines TGFB and IL10 however suggest a counter-balanced inflammatory response. This is supported by the lack of TNF expression in MES 1. Still, it is important to notice that TGFB for the two groups (Mayo 0 and 1) as a whole was less expressed than in the normal group. To our knowledge this is the first investigation of gene transcript difference between Mayo subscores 0 and 1. This may have clinical implications for determining when to de-escalate treatment in UC in clinical remission. However, further investigation is warranted.
TNFR1/NF-Kb pathway
The results show that TRAF1 has increased expression in both clinical remission and active UC mucosa, when compared to normal mucosa. This finding can be interpreted as an attempt to ameliorate the inflammation and reduce NFKB signaling. TRAF1 is a TNF receptor regulatory protein and is related to cell apoptosis/necroptosis and inflammation. It is suggested that the ratio between TRAF1 and TRAF2 is important for the effect TNF has on T-cell expansion [Citation20]. Where TRAF1 is a negative regulator and TRAF2 is positive. This was confirmed in a study of TRAF1 deficient mice, where an increased response to TNF and higher T-cell proliferation was shown [Citation21]. It is also suggested that TRAF1 has opposite actions depending on cleavage by CASP8. A full length TRAF1 is pro-cell survival, whereas a cleaved TRAF1 is pro-apoptotic when in a stimulated TNFR1 context [Citation22]. Our findings are in line with other reports that TRAF1 is up-regulated in active UC and inhibit NFKB signaling [Citation23].
Our results suggest that CASP8 is up-regulated in active UC and not in clinical remission. CASP8 regulates apoptosis/necroptosis and is inhibited by NFKB activation. Our result is surprising as one would expect prolonged immune cell life to be beneficial in order to deal with infection. On the other hand, it could be a result of an attempt to down-regulate the inflammation. Up-regulation of TRAF1 could give a higher activation of CASP8 as TRAF1 regulates NFKB activation and may thereby remove inhibition for CASP8 activation, as mentioned earlier. Previous papers have reported no difference in CASP8 between control and UC [Citation24].
The results of our analysis show that even in non-symptomatic and non-inflamed mucosa TNF is still up-regulated. TNF is one of the central cytokines in inflammation and acts as a pro-inflammatory cytokine. The up-regulation of TNF in clinical remission UC patients could be due to the cyclic nature of inflammation. Previous results are conflicting on the presence of TNF in remission mucosa [Citation25,Citation26]. This could be a result of different definitions and lack of consensus on what constitutes remission.
JAK-STAT pathway
Our study showed that STAT1 and STAT3 are up-regulated both in clinical remission and active UC when compared with normal mucosa, in line with previously published data [Citation27,Citation28]. STAT1 and STAT3 are a part of the JAK-STAT pathway which is responsible for several immunological functions and responses. Interestingly, our findings suggest that these signaling pathways are not just up-regulated in active inflammation, but also in clinical remission. What their functions are in clinical remission mucosa is difficult to say as they are involved in both pro- and anti-inflammatory signaling pathways dependent on cell type and substrate. Further eliciting their role in non-inflamed UC mucosa requires further studies. STAT3-mediated activation of acquired immune responses plays a pathogenic role in colitis by enhancing survival of T cells and by inducing TNF. In contrast, STAT3-mediated activation of innate responses contributes to the suppression of colitis by enhancing the mucosal repair and by inducing mucin production [Citation29]. In either case, therapeutic targeting of the JAK-STAT signaling pathway with tofacitinib shows promising results [Citation30].
Innate immune system
We found that ADAM17 was up-regulated in active UC which is in keeping with previous research [Citation31]. ADAM17 has been shown to cleave TNF to soluble TNF and can therefore be pro-inflammatory, on the other hand its role in activation of Erb-B ligands and Notch-1 pathway makes it a contributor to epithelial regeneration [Citation32]. In addition, ADAM17 cleaves the IL1B decoy receptor IL1R2 into soluble sIL1R2 which is suggested to have anti-inflammatory effect [Citation33,Citation34]. We could not detect significant expression of IL1R2 in any of our groups. Nevertheless, ADAM17 is a key protein in the role of TNF effects and plays an important role in inflammatory diseases.
IL1B is known to have a pro-inflammatory function in UC [Citation35,Citation36], and interestingly, the results show that IL1B was up-regulated in clinical remission mucosa, indicating a subclinical inflammation which could contribute to the cyclical nature of the disease.
Our results show that IL33 was still up-regulated in clinical remission patients, although its receptor IL1RL1 was not. The role of IL33 in UC is not clearly defined and it is likely dependent on the stage of inflammation [Citation37,Citation38]. IL33 has been implicated in intestinal fibrosis and in mucosal healing and goblet cell restoration [Citation39–41]. Thus, the presence of IL33 in UC clinical remission may represent ongoing wound healing/fibrogenesis and not an inflammatory process.
Our findings suggest that TFF3 is expressed more in active inflammation. TFF3 is a protein secreted to the lumen from goblet cells in the colon and has a role in protection and healing of the mucosa. However, an earlier paper reports no difference in TFF3 expression between normal and UC active mucosa [Citation42].
In our investigation, we found that TGFB1 was down-regulated in remission patients compared to normal. TGFB1 is negative regulator of mucosal inflammation, and it is well known that this cytokine is up-regulated in inflamed mucosa [Citation43,Citation44]. TGFB1 signals from the receptor to the nucleus through several proteins called SMAD’s. Previous reports on the expression on TGFB1 in healthy and remission mucosa varies from no difference to down-regulated [Citation43,Citation45]. However, changes in TGFB1 expression should be interpreted with caution due to extensive post-translational modifications necessary for activation of the TGFB1 protein.
Strength and weakness
The main strength of this paper is its focus on clinical remission in UC patients, highlighting the found perturbation as possible central factors in the basic immunopathology of Ulcerative colitis. There are weaknesses to the study as well: (A) The study population is clinically heterogeneous in that participants are in different phases of their disease and on a variety of medication, making it more difficult to discuss the mechanics of the pathways affected. However, this makes our results more clinically applicable to the average UC patient and not just the un-treated or the anti-TNF naïve etc.; (B) Only partial compliance with the MIQE guideline for PCR research as ACTB was sole reference gene. This can make the fold change results more uncertain, albeit most of our findings are in line with previous research and later validation showed ACTB to have low inter- and intragroup variation, thus, introducing little error. (C) Because of the invasive nature of the sample collection, our control population are people referred for colon cancer screening thus resulting age difference between study groups; (D) The low statistical power precludes models adjusting for medication, disease duration, and smoking status etc. (E) Transcriptional analysis has the inherent restrictions that it does not prove a functional protein, therefore any interpretation of difference on a protein level based on at transcriptional levels should be done with caution, nevertheless, it may serve as a hypothesis generator for further research. (F) We used two different methods of detection with qPCR. This is due to cost and time restrictions. Prefabricated plates saves time as we do not have to go through the time-consuming process of designing, optimizing and validating in total 29 new genes. In our exploratory context we believe this to be an acceptable approach.
Concluding remarks
In conclusion, we have shown that in clinical UC remission there is still an ongoing expression of inflammatory mediators, although it seems to be more balanced towards mucosal healing. A mucosa with MES 1 transcribes more pro-inflammatory mediators than in MES 0, which may have clinical impact such as when to de-escalate treatment. Finally, we found that important transcription factors in the JAK/STAT pathway are still up-regulated in remission patients.
Ethical approval
All participants were informed and signed a written consent. Approval including the use of biobank was granted by the Regional Committee of Medical Ethics of Northern Norway Ref no: 1349/2012.
| Abbreviations | ||
| IBD | = | Inflammatory bowel disease |
| UC | = | Ulcerative colitis |
| qPCR | = | Quantitative polymerase chain reaction |
| MIQE | = | Minimum information for publication of quantitative real-time PCR experiments |
| 5-ASA | = | 5-aminosalicylic acid |
| TNF | = | Tumor necrosis factor |
| mRNA | = | messenger ribonucleic acid |
| RNA | = | ribonucleic acid |
| DNA | = | Deoxyribonucleic acid |
| MES | = | Mayo endoscopic subscore |
| FC | = | Fold change |
| ECCO | = | European Crohn´s and Colitis Organisation |
| RIN | = | RNA Integrity Number |
Supplemental Material
Download PDF (70.5 KB)Acknowledgments
This project would not possible without the help from the gastroenterology lab at the Arctic University of Norway especially Ingrid Christiansen and Rania Al-Mahdi. A special thanks to the gastroenterology department at the University Hospital of Northern Norway and to all the patients who participated in the study.
Disclosure statement
No potential conflict of interest was reported by the authors.
Additional information
Funding
References
- Burisch J, Jess T, Martinato M, et al. The burden of inflammatory bowel disease in Europe. J Crohn's Colitis. 2013;7(4):322–337.
- Ng SC, Shi HY, Hamidi N, et al. Worldwide incidence and prevalence of inflammatory bowel disease in the 21st century: a systematic review of population-based studies. Lancet (London, England. 2017;390(10114):2769–2778.
- Kaser A, Zeissig S, Blumberg RS. Inflammatory bowel disease. Annu Rev Immunol. 2010;28(1):573–621.
- Neurath MF. Cytokines in inflammatory bowel disease. Nat Rev Immunol. 2014;14(5):329–342.
- Neurath MF. Targeting immune cell circuits and trafficking in inflammatory bowel disease. Nat Immunol. 2019;20(8):970–979.
- Rogler G. Where are we heading to in pharmacological IBD therapy?. Pharmacological Research. 2015;100:220–227.
- Danese S, Vuitton L, Peyrin-Biroulet L. Biologic agents for IBD: practical insights. Nat Rev Gastroenterol Hepatol. 2015;12(9):537–545.
- Magro F, for the European Crohn’s and Colitis Organisation [ECCO], Gionchetti P, Eliakim R, et al. Third European evidence-based consensus on diagnosis and management of ulcerative colitis. part 1: definitions, diagnosis, extra-intestinal manifestations, pregnancy, cancer surveillance, surgery, and ileo-anal pouch disorders. J Crohn's Colitis. 2017;11(6):649–670.
- Lamb CA, IBD guidelines eDelphi consensus group, Kennedy NA, Raine T, et al. British Society of Gastroenterology consensus guidelines on the management of inflammatory bowel disease in adults. Gut. 2019;68(Suppl 3):s1–s106.
- Schroeder KW, Tremaine WJ, Ilstrup DM. Coated oral 5-aminosalicylic acid therapy for mildly to moderately active ulcerative colitis. N Engl J Med. 1987;317(26):1625–1629.
- Rutgeerts P, Sandborn WJ, Feagan BG, et al. Infliximab for induction and maintenance therapy for ulcerative colitis. N Engl J Med. 2005;353(23):2462–2476.
- Peyrin-Biroulet L, Sandborn W, Sands BE, et al. Selecting therapeutic targets in inflammatory bowel disease (stride): determining therapeutic goals for treat-to-target. Am J Gastroenterol. 2015;110(9):1324–1338.
- Ungaro R, Colombel JF, Lissoos T, et al. A treat-to-target update in ulcerative colitis: a systematic review. Am J Gastroenterol. 2019;114(6):874–883.
- D'Haens G, Sandborn WJ, Feagan BG, et al. A review of activity indices and efficacy end points for clinical trials of medical therapy in adults with ulcerative colitis. Gastroenterology. 2007;132(2):763–786.
- Bustin SA, Benes V, Garson JA, et al. The MIQE guidelines: minimum information for publication of quantitative real-time PCR experiments. Clin Chem. 2009;55(4):611–622.
- Andersen CL, Jensen JL, Orntoft TF. Normalization of real-time quantitative reverse transcription-PCR data: a model-based variance estimation approach to identify genes suited for normalization, applied to bladder and colon cancer data sets. Cancer Res. 2004;64(15):5245–5250.
- Barreiro-de Acosta M, Vallejo N, de la Iglesia D, et al. Evaluation of the risk of relapse in ulcerative colitis according to the degree of mucosal healing (Mayo 0 vs 1): A Longitudinal Cohort Study. ECCOJC. 2016;10(1):13–19.
- Boal Carvalho P, Dias de Castro F, Rosa B, et al. Mucosal healing in ulcerative colitis–when zero is better. ECCOJC. 2016;10(1):20–25.
- Yokoyama K, Kobayashi K, Mukae M, et al. Clinical study of the relation between mucosal healing and long-term outcomes in ulcerative colitis. Gastroenterology Res Pract. 2013;2013:1–6.
- Zapata JM, Reed JC. TRAF1: lord without a ring. Science's STKE. 2002;2002(133):pe27–pe.
- Tsitsikov EN, Laouini D, Dunn IF, et al. TRAF1 is a negative regulator of TNF signaling: enhanced TNF signaling in TRAF1-deficient mice. Immunity. 2001;15(4):647–657.
- Leo E, Deveraux QL, Buchholtz C, et al. TRAF1 is a substrate of caspases activated during tumor necrosis factor receptor-alpha-induced apoptosis. J Biol Chem. 2001;276(11):8087–8093.
- Qiao YQ, Shen J, Gu Y, et al. Gene expression of tumor necrosis factor receptor associated-factor (TRAF)-1 and TRAF-2 in inflammatory bowel disease. J Digest Dis. 2013;14(5):244–250.
- Pierdomenico M, Negroni A, Stronati L, et al. Necroptosis is active in children with inflammatory bowel disease and contributes to heighten intestinal inflammation. Am J Gastroenterol. 2014;109(2):279–287.
- Verma R, Verma N, Paul J. Expression of inflammatory genes in the colon of ulcerative colitis patients varies with activity both at the mRNA and protein level. Eur Cytokine Network. 2013;24(3):130–138.
- Masuda H, Iwai S, Tanaka T, et al. Expression of IL-8, TNF-alpha and IFN-gamma m-RNA in ulcerative colitis, particularly in patients with inactive phase. J Clin Lab Immunol. 1995;46(3):111–123.
- Mudter J, Weigmann B, Bartsch B, et al. Activation pattern of signal transducers and activators of transcription (STAT) factors in inflammatory bowel diseases. Am J Gastroenterology. 2005;100(1):64–72.
- Musso A, Dentelli P, Carlino A, et al. Signal transducers and activators of transcription 3 signaling pathway: an essential mediator of inflammatory bowel disease and other forms of intestinal inflammation. Inflammatory Bowel Dis. 2005;11(2):91–98.
- Sugimoto K. Role of STAT3 in inflammatory bowel disease. WJG. 2008;14(33):5110–5114.
- Sandborn WJ, Su C, Sands BE, et al. Tofacitinib as induction and maintenance therapy for ulcerative colitis. N Engl J Med. 2017;376(18):1723–1736.
- Brynskov J, Foegh P, Pedersen G, et al. Tumour necrosis factor alpha converting enzyme (TACE) activity in the colonic mucosa of patients with inflammatory bowel disease. Gut. 2002;51(1):37–43.
- Scheller J, Chalaris A, Garbers C, et al. ADAM17: a molecular switch to control inflammation and tissue regeneration. Trends in Immunol. 2011;32(8):380–387.
- Uchikawa S, Yoda M, Tohmonda T, et al. ADAM17 regulates IL-1 signaling by selectively releasing IL-1 receptor type 2 from the cell surface. Cytokine. 2015;71(2):238–245.
- Moss ML, Minond D. Recent Advances in ADAM17 Research: A Promising Target for Cancer and Inflammation. Mediators Inflamm. 2017;2017:9673537.
- Coccia M, Harrison OJ, Schiering C, et al. IL-1β mediates chronic intestinal inflammation by promoting the accumulation of IL-17A secreting innate lymphoid cells and CD4+ Th17 cells. J Exp Med. 2012;209(9):1595–1609.
- Liu L, Dong Y, Ye M, et al. The pathogenic role of NLRP3 inflammasome activation in inflammatory bowel diseases of both mice and humans. J Crohns Colitis. 2017;11(6):737–750.
- Sedhom MAK, Pichery M, Murdoch JR, et al. Neutralisation of the interleukin-33/ST2 pathway ameliorates experimental colitis through enhancement of mucosal healing in mice. Gut. 2013;62(12):1714–1723.
- Groβ P, Doser K, Falk W, et al. IL-33 attenuates development and perpetuation of chronic intestinal inflammation. Inflamm Bowel Dis. 2012;18(10):1900–1909.
- Lopetuso LR, Scaldaferri F, Pizarro TT. Emerging role of the interleukin (IL)-33/ST2 axis in gut mucosal wound healing and fibrosis. Fibrogenesis Tissue Rep. 2012;5(1):18.
- Sponheim J, Pollheimer J, Olsen T, et al. Inflammatory bowel disease-associated interleukin-33 is preferentially expressed in ulceration-associated myofibroblasts. Am J Pathol. 2010;177(6):2804–2815.
- Seo DH, Che X, Kwak MS, et al. Interleukin-33 regulates intestinal inflammation by modulating macrophages in inflammatory bowel disease. Sci Rep. 2017;7(1):851.
- Hensel KO, Boland V, Postberg J, et al. Differential expression of mucosal trefoil factors and mucins in pediatric inflammatory bowel diseases. Sci Rep. 2015;4(1):7343.
- Babyatsky MW, Rossiter G, Podolsky DK. Expression of transforming growth factors alpha and beta in colonic mucosa in inflammatory bowel disease. Gastroenterology. 1996;110(4):975–984.
- Kanazawa S, Tsunoda T, Onuma E, et al. VEGF, basic-FGF, and TGF-beta in Crohn's disease and ulcerative colitis: a novel mechanism of chronic intestinal inflammation. Am J Gastroenterol. 2001;96(3):822–828.
- Chowdhury A, Fukuda R, Fukumoto S. Growth factor mRNA expression in normal colorectal mucosa and in uninvolved mucosa from ulcerative colitis patients. J Gastroenterol. 1996;31(3):353–360.