
Abstract
Background: Patients with inflammatory bowel disease (IBD) often develop alterations in body composition in terms of their proportions of lean mass and fat mass, as well as reduced bone mineral density (BMD). However, there are limited data on the skeletal muscle index (SMI) and percentage fat (fat %) for young adults with childhood-onset IBD. Our aim was to investigate the body compositions of these patients, with the focus on SMI and fat %.
Methods: Body composition was estimated by dual x-ray absorptiometry for 94 young adults with childhood-onset IBD aged 18–27 years, 65 of whom had ulcerative colitis. The Z-scores for SMI, fat %, and BMD were calculated using the normative data from 1,289 individuals with corresponding age. Based on the SMI and fat % Z-scores, each patient was classified as having a body composition profile that was: (i) normal; (ii) obese (fat % Z-score >1); (iii) myopenic (SMI Z-score < −1); or (iv) myopenic-obese.
Results: A higher proportion of young adults with childhood-onset IBD had a body composition profile classified as myopenic (24%) or myopenic-obese (9%), as compared to the controls (myopenic [16%, p = .016]; myopenic-obese [2%, p = .002]). Patients with the myopenic or myopenic-obese profile had significantly lower total body BMD Z-scores (−1.3 ± 0.7 and −1.4 ± 0.9, respectively) than patients with the normal profile (−0.2 ± 1.1; p < .001 and p = .004, respectively). Diagnosis of IBD in childhood represented an additional risk for low BMD, regardless of SMI Z-score.
Conclusion: Young adults with childhood-onset IBD have a high risk for having altered body composition traits.
Young adults with childhood-onset IBD carry a high risk for altered body composition traits. The myopenic and myopenic-obese body composition profiles were more frequently observed in patients with IBD than controls, and these profiles were strongly associated with low BMD.
Summary
Introduction
Body composition describes the proportions of lean soft tissue mass, fat mass, and bone mineral density (BMD) of an individual. Inflammatory bowel disease (IBD) includes the two major subcategories, Crohn’s disease and ulcerative colitis. Regardless of subcategory, adult patients run an increased risk of developing alterations in all three traits of body composition [Citation1,Citation2]. Children with IBD have primarily deficits in lean soft tissue mass and BMD, while the issue of whether their proportions of fat mass are affected remains a matter of debate [Citation3–8]. Notably, there is a paucity of data on body composition in young adults with childhood-onset IBD.
When a chronic inflammatory disease affects an individual, it is common that the traits of body composition become altered, since the different compartments interact with each other [Citation9,Citation10]. For example, the amounts of lean soft tissue mass and fat mass are of importance for normal bone mineralization [Citation11]. Currently, it is generally accepted that skeletal muscle has a strong impact on bone modeling and remodeling [Citation12–14]. The amount of skeletal muscle is usually estimated by dual x-ray absorptiometry (DXA) using the body composition trait of lean soft tissue mass [Citation15]. However, lean soft tissue mass includes not only skeletal muscles but also all soft tissues, with the exception of fat mass [Citation15]. Even though total-body lean soft tissue mass correlates with BMD in adults [Citation16], skeletal muscle index (SMI), which is calculated as the lean soft tissue mass weight (kg) of the arms and legs divided by the height squared (m2), is considered to be a more accurate estimate of skeletal muscle mass [Citation15], and consequently correlates better with BMD [Citation17]. To our knowledge, there are no reported data on SMI or on the association between SMI and BMD in young adults with childhood-onset IBD.
Inferior skeletal muscle mass is often termed myopenia [Citation18], and when there is concomitant muscle dysfunction, it is termed sarcopenia [Citation19]. The skeletal muscle mass in young adulthood is of great interest because after the third decade of life, there are age-related declines in both muscle mass and muscle function [Citation20]. The end result in older ages may be sarcopenia, which is associated with mobility limitations [Citation21], reduced quality of life [Citation22], higher morbidity [Citation23], mortality [Citation24] and greater healthcare costs [Citation25].
Obesity has been identified as a potential health problem in patients with IBD, especially in patients with ulcerative colitis [Citation1]. A widely used method in clinical practice for estimating obesity is body mass index (BMI, g/cm2). However, a DXA scan provides a more reliable estimate of the fat mass and percentage fat (fat %) of the total body weight than does BMI [Citation1,Citation4]. It is of clinical relevance to identify patients with IBD and obesity, not least because obesity has been associated with increased risk of surgical complications [Citation26].
To evaluate the co-current alterations of skeletal muscle and fat mass and identify different subgroups of patients, Baumgartner [Citation27] proposed a model based on SMI and percentage fat, classifying each individual into one of the following body composition profiles; ‘normal’, ‘obese’, ‘myopenic’ (low SMI [Citation18]), and ‘myopenic-obese’ [Citation27]. Belonging to a profile other than normal has been reported as being associated with various degrees of decline in physical function in adulthood [Citation28]. This approach to classifying patients with IBD, based on SMI and fat %, into profiles of body composition has not been applied previously. Identifying an altered profile could provide the opportunity to implement tailored preventive strategies in these patients.
The primary aim of this study was to investigate body composition with the focus on SMI and fat % in young adults with childhood-onset IBD. A secondary aim was to evaluate the extent to which the various body composition traits relate to each other.
Subjects and methods
Subjects
The young-adult patients in the present study participated in a longitudinal project that focuses on body composition in a cohort of patients with childhood-onset IBD [Citation6,Citation7,Citation29]. The patients were included from the two centers responsible for the diagnosis, treatment and follow-up of childhood-onset IBD in the greater Gothenburg area, Sweden (The Queen Silvia Children’s Hospital at Sahlgrenska University Hospital, Gothenburg, and the Department of Pediatrics at Södra Älvsborgs Hospital, Borås). Thus, this cohort represents the whole clinical spectrum of IBD. At baseline, the study cohort comprised 144 patients with childhood-onset IBD (51 females and 93 males) who were assessed with DXA at a median age of 14.6 (6–19) years. A 2-year follow-up examination was conducted on 126 patients (45 females and 81 males) and a 5–7-year follow-up examination was performed for 74 patients (25 females and 49 males). Data focusing on BMD have previously been published at baseline [Citation6], at the first [Citation7] and at the second [Citation29] follow-up measurements. In this report, we include the 94 patients who had any DXA scan in young adulthood (defined as having reached 18 years of age). A total of 94 patients were examined in adulthood, 91 of whom had more than one measurement as an adult. In these patients, we used the measurement performed at the oldest age.
Among the 50 patients who were not included in the present study, 45 were lost to follow-up before the adulthood measurement, one had not reached 18 years, and one had metabolic syndrome that markedly affected the body composition. An additional two patients with unclassified IBD were excluded due to their low number, and one patient was found not to have IBD when being reevaluated at the follow-up. The non-participants who were lost to follow-up before adulthood measurement (n = 45) did not differ clearly from the participants at baseline in terms of their demographic and clinical characteristics, i.e., subcategory of IBD (Crohn’s disease 33% vs. 31%), gender (males 62% vs 68%), age at diagnosis (10.1 ± 3.3 years vs. 11.5 ± 3.2 years), or medication, such as azathioprine (38% vs 51%). No patient had received treatment with biologics at baseline.
Two previously published reference cohorts from the two large city regions in the southwest of Sweden were pooled and used as controls in this study: (i) 1068 population-based young adult men in the age range of 18–25 years from the greater Gothenburg area (the GOOD study [Citation30,Citation31]), and (ii) 221 men and women in the age range of 18–30 years from the greater Malmö area [Citation32]. The pooled control cohort consisted of 1181 men and 108 women in the age range of 18–30 years. These normative collected data were then used to calculate the Z-scores of SMI, fat %, and BMD for the patients of different ages.
Data collection and measurements
The following clinical data were registered: age, gender, height, weight, disease subcategory, disease duration, and age at disease onset. Furthermore, we collected data from medical records regarding pharmacologic treatments received at or before measurement, including prednisolone, 5-aminosalicylic acid (5-ASA), azathioprine, methotrexate, and biological therapy [anti-tumor necrosis factor (TNF)]. No other biological therapies were used in these patients. We also registered intestinal surgery due to IBD or fistula operation.
Height was measured to the nearest 0.5 cm using a wall-mounted stadiometer. Weight was measured to the nearest 0.1 kg using a calibrated standard scale with the participants in light clothes. Total body, arms and legs lean soft tissue mass (kg), total body fat mass (kg), and total body, spine and femoral neck bone mineral density (BMD, g/cm2) (standard software) were measured with DXA using a Lunar densitometer (DPX-IQ version 4.7e; GE Medical Systems Lunar, Madison, WI) at baseline and at the first and second follow-ups with a Lunar Prodigy DXA (GE Medical Systems Lunar). The controls from the GOOD cohort were measured with the same Lunar Prodigy DXA apparatus [Citation31] as the patients, while the control population from the Malmö region was measured using a Lunar DPX-L (version 1.3z; GE Medical Systems Lunar) apparatus [Citation32]. Since the correlation of body composition measurements, as well as of BMD measurements using different Lunar machines has been found to be strong [Citation33], we used the raw data without adjustment for the apparatus used. We calculated the appendicular SMI as the sum of the arms and legs lean soft tissue mass divided by the height squared (kg/m2), which is known to be a good estimate of the total body skeletal muscle mass [Citation17]. Fat mass was calculated as the fat mass percentage (fat %) of the total body weight. At the second follow-up, we also measured in the majority of the patients (n = 70) the maximal hand grip strength (kg) using the Jamar hydraulic hand dynamometer (5030J1, Jackson, MI, USA) with an adjustable handgrip. Testing was performed on both hands with the subjects sitting with the arm held at 90 degrees flexion in the elbow at their side. After a practice attempt, three recorded attempts were performed and the mean score for both arms was recorded.
Body composition profile definition
Taking both SMI and fat % into account, we classified each patient into one of four body composition profiles: (i) normal; (ii) obese; (iii) myopenic; and (iv) myopenic-obese. This classification was based on a theoretical model proposed by Baumgartner [Citation27], albeit with some modification. In our modified model, we use the term myopenia for an SMI Z-score < −1 to define low skeletal muscle mass, in line with Bryant et al. [Citation34]. The cutoff for SMI Z-score of < −1 in the controls corresponded to SMI of 6.1 kg/m2 for females and 7.5 kg/m2 for males. Obesity was defined as fat % Z-score >1, which corresponded to fat % of >39% for females and >27% for males. Thus, the four body composition profiles were defined as follows: (i) normal, SMI Z-score > −1 and fat% Z-score <1; (ii) obese, SMI Z-score > −1 and fat% Z-score >1; (iii) myopenic, SMI Z-score < −1 and fat% Z-score <1; and (iv) myopenic-obese, SMI Z-score <−1 and fat% Z-score >1. The cutoffs for myopenia in the present study were higher than in the original publication of Baumgartner [Citation27], where myopenia was defined as SMI Z-score lower than −2 SD, cutoffs were SMI of 5.5 kg/m2 for females and 7.26 kg/m2. Cutoffs for fat % were similar to Baumgartner’s [Citation27], >38% for females and 27% for males.
Statistical analyses
Statistical analyses were performed with the SPSS version 22 software (IBM Corp., Armonk, NY, USA). Continuous, normally distributed variables are presented as mean ± standard deviation (SD), otherwise as median (range). Age- and gender-specific Z-scores were calculated based on the values in our control cohort for SMI, fat %, and BMD in total body, spine and femoral neck. Within each gender group, we calculated the age-specific expected values for SMI, fat%, and BMD using a linear regression model. We could then calculate the individual Z-score for each patient using the following formula: measured value minus expected mean value of controls for that age divided by the root mean square error of the regression model. Differences in anthropometrics and body composition measurements between patients with Crohn’s disease or ulcerative colitis, as compared to controls were tested with the Student’s t-test. Differences in continuous variables between the different body composition profiles were tested with analysis of variance (ANOVA). If there was a statistically significant difference, the Student’s t-test with Bonferroni correction was used as a post-hoc test. Differences in categorical variables between the body composition profiles were not tested with a statistical analysis due to the low number of observations in patients with the myopenic-obese profile. Correlations between the SMI, fat %, and BMD Z-scores were estimated with Spearman’s rank correlation coefficient (r). A multivariable regression model was used for estimating the association between BMD Z-score (dependent variable) and IBD diagnosis and SMI Z-score (covariates). All tests were 2-tailed and employed a significance level of <0.05.
Ethical considerations
Informed written consent was obtained from all the study participants in young adulthood. The study was approved by the Ethical Review Committee of the University of Gothenburg (Sweden) (application numbers 182-02 and 117-11).
Results
Patients’ characteristics
This study included 94 young adult patients with childhood-onset IBD. In total, 65 patients had ulcerative colitis and 29 had Crohn’s disease. The gender distribution was 64 males and 30 females with a median age of 21.8 (18.3–27.7) years and with a disease duration of 10.4 (3.1–21.7) years. A total of 91 patients had a median follow-up time of 7.7 [Citation2–12] years, whereas three patients had only one measurement performed and in these cases only in young adulthood. Most of the patients were currently being treated with or had previously received prednisolone (93%, N = 87) and 5-ASA (99%, N = 93). The corresponding figures for azathioprine and biologics were 70% (N = 66) and 17% (N = 16). One-fourth of the patients had undergone surgery due to IBD (26%, N = 24). In total, 26 patients (28%) had comorbidities. Ten patients had a clinical history of primary sclerosing cholangitis, two of whom had undergone liver transplantation. Other comorbidities included: celiac disease (n = 6), thyroid dysfunction (n = 3), autoimmune hepatitis (n = 3), orofacial granulomatosis (n = 3), and type 1 diabetes (n = 1).
Body composition traits
Descriptive data on age, anthropometry, and DXA measurements for the patients with IBD and the controls are stratified by gender for appropriate comparisons in for males and for females. Data on BMD in young adulthood have been assembled from three previous publications from our research group [Citation6,Citation7,Citation29].
Table 1. Anthropometrical and dual x-ray absorptiometry measurements in young adult male patients with childhood-onset inflammatory bowel disease, in comparison with male controls.
Table 2. Anthropometrical and dual x-ray absorptiometry measurements in young adult female patients with childhood-onset inflammatory bowel disease in comparison with female controls.
The men with Crohn’s disease were lower in height, weight, and BMI (all p < .05), and had lower lean soft tissue mass and SMI values (both p < .001) than the controls (). The men with ulcerative colitis had a lower height and lower lean soft tissue mass (both p < .05), although they had a higher fat % (p < .05), as compared to the controls.
Both the women with Crohn’s disease and the women with ulcerative colitis had a higher fat % than the controls (both p < .05), whereas their height, weight, BMI, and lean soft tissue mass values were in the same range as controls (). SMI Z-scores were similar in females (-0.36 ± 1.3) and males (-0.44 ± 1.1, p = .735) with IBD (Crohn´s disease and ulcerative colitis combined). However, fat % Z-scores were higher in females (0.58 ± 1.0) than males (0.13 ± 1.0, p = .046) with IBD.
Body composition profiles
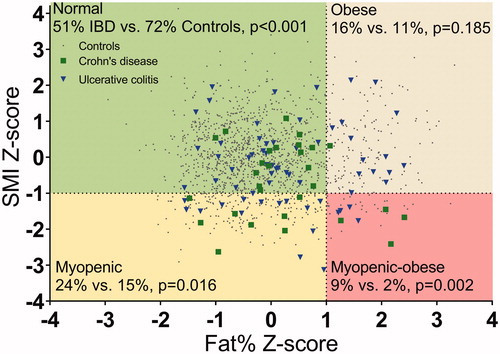
A higher proportion of young adults with childhood-onset IBD had a body composition profile that was classified as myopenic (24%) or myopenic-obese (9%) compared to the controls (myopenic [16%, p = .016], myopenic-obese [2%, p = .002]) (). An obese profile was observed for 16% of the patients, as compared to 11% of the controls (p = .185) (). As SMI Z-scores in female and male patients were in the same range and as only a slight difference in fat % Z-scores was seen, no stratification of body composition profiles based on gender was performed.
Figure 1. Body composition profiles of young adults with childhood-onset inflammatory bowel disease (IBD; n = 94) compared to those of the controls (n = 1289). The four profiles based on SMI Z-score and fat % Z-score are as follows: (i) normal; (ii) obese (fat % Z-score >1); (iii) myopenic (SMI Z-score < −1); and (iv) myopenic-obese. Differences in the proportions of patients with IBD (Crohn’s disease and ulcerative colitis combined) and controls in each profile were tested with Fisher’s exact test after the finding of statistically different proportions between the four profiles (p < .001).
The clinical characteristics, anthropometric measures, grip strength, and body composition traits of the patients belonging to the respective profiles are summarized in . The clinical characteristics differed between the profiles with regards to age at diagnosis and disease duration. In particular, patients with the myopenic-obese profile stood out as having a low mean age at diagnosis (7 ± 4 years) and long disease duration of 15 ± 3 years. Notably, the group of patients with the myopenic-obese profile had similar mean BMI values as the patients with the normal profile (). Grip strength varied significantly with body composition profile; the lowest grip strength was observed in the patients with the myopenic and myopenic-obese profiles (). Focusing on IBD subcategory and profile type, the patients with ulcerative colitis were overrepresented in the obese profile (N = 14, 93%).
Table 3. Clinical characteristics and body composition traits in the different body composition profiles of young adults with childhood-onset IBD.
In total, 33% of patients with childhood-onset IBD had a body composition profile that included myopenia (myopenic profile, 24%; myopenic-obese profile, 9%), as compared to 17% of the controls (myopenic profile, 15%; myopenic-obese profile, 2%) (p < .001). Similarly, 25% of the patients had an obese body composition (obese profile, 16%; myopenic-obese profile, 9%), as compared to 14% of the controls (obese profile, 11%; myopenic-obese profile, 2%) (p = .006).
Relationship between body composition profile and bone mineral density
With respect to BMD in the patient cohort, patients with the myopenic or myopenic-obese profile had a lower total body BMD Z-score (−1.3 ± 0.7 and −1.4 ± 0.9, respectively) than the patients with a normal profile (−0.2 ± 1.1; p < .001 and p = .004, respectively). However, patients with the obese profile showed no significant difference (p = .542) regarding total body BMD Z-score (0 ± 1), as compared to patients with a normal profile ().
Figure 2. Bone mineral densities of the study subjects with different body composition profiles. BMD Z-scores with 95% CI are shown for total body, spine and femoral neck in the controls (solid symbols) and patients (open symbols). Differences in the BMD Z-scores between controls and patients within each body composition profile were tested with an independent t-test (*p < .05; **p < .001). Differences in the BMD Z-scores between the normal profile and the three other profiles, in the controls and patients separately, were tested with one-way ANOVA followed by a post-hoc comparison with Bonferroni correction; controls (ap < .05, aap < .001), and patients (bp < .05, bbp < .001).
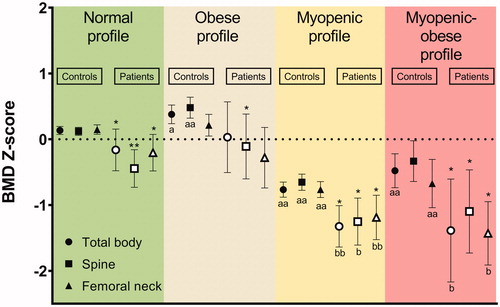
A similar relationship between BMD and body composition profile was observed in the controls. Thus, controls with the myopenic profile or myopenic-obese profile had a significantly lower BMD than controls with a normal profile (). Furthermore, when comparing the BMD Z-scores of patients and controls within the same body composition profile, regardless of the actual profile, a lower BMD Z-score at one or more sites was observed in the patients with IBD than in the controls ().
Relationships between body composition traits in patients with IBD
To study the relationships between SMI and BMD and between fat % and BMD, respectively, we analyzed all the patients without taking into account their body composition profiles. SMI Z-score was positively correlated with total body BMD Z-score (r = 0.61, p < .001), spine BMD Z-score (r = 0.52, p < .001), and femoral neck BMD Z-score (r = 0.55, p < .001). In contrast, no significant correlations were found between the fat % Z-score and the total body BMD Z-score (r = 0.01, p = .94), spine BMD Z-score (r = 0.11, p = .286) or femoral neck BMD Z-score (r= −0.32, p = .76).
Association between IBD diagnosis and BMD Z-score when accounting for SMI Z-score
In a cross-sectional analysis of all individuals (both patients and controls) in young adulthood, we examined whether the diagnosis of IBD was independently associated with BMD at different sites when accounting for SMI Z-score. We used a multivariable regression model (94 patients and 1289 controls over the age of 18 years). An increase in SMI Z-score corresponding to +1 was associated with 0.51 (95% CI 0.46–0.55) higher total body BMD Z-score. In contrast, a reduction in total body BMD Z-score of −0.33 (95% CI −0.51– −0.15) was seen in patients who had been diagnosed with IBD in childhood. Similar relationships were seen between IBD diagnosis and BMD Z-scores at the other sites, with a reduction of the spine BMD Z-score of −0.51 (95% CI −0.70 – −0.32) and a reduction of the femoral neck BMD Z-score of −0.37 (95% CI −0.58 – −0.16).
Discussion
In the present study, we investigated body composition with the focus on skeletal muscle index (SMI) and percentage fat (fat %) in a cohort of young adults with childhood-onset IBD. These two measures were used to define four different body composition profiles: (i) normal; (ii) obese (high fat %); (iii) myopenic (low SMI); and (iv) myopenic-obese. In the patients with childhood-onset IBD, the myopenic and myopenic-obese profiles were more common than in the controls. Patients with these two profiles were also found to have an increased risk for low BMD.
We had the opportunity to compare our patient cohort to a large normative reference cohort, thereby allowing us to derive Z-scores for simultaneous assessment of SMI and fat %. This ability to express the body composition traits of SMI and fat % in combination in an individual profile may be clinically informative in patients with IBD. Both low muscle mass [Citation21–25] (myopenia) and high fat mass [Citation35] (obesity) have been linked to serious health problems in adulthood in the general population. This approach to use profiles to characterize body composition alterations has, to the best of our knowledge, not been previously reported for patients with IBD.
A ‘normal’ body composition profile was seen in only half of the young adults with IBD, whereas nearly three-quarters of the controls had such a profile. A substantially larger proportion of the patients with childhood-onset IBD had a body composition profile that was characterized by myopenia, as compared to the controls. Thus, 33% of the patients with IBD had myopenia, of whom 24% were assigned to the myopenic profile and 9% to the myopenic-obese profile. The corresponding percentages for the controls were 15% and 2%, respectively. Patients with myopenia were also found to have inferior muscle function. Similar to our results, albeit at lower prevalence, a recent study in adults with IBD (median age of 31 years) reported that one-fifth of the patients had a low SMI Z-score (< −1) and concurrent low grip strength in relation to low SMI [Citation34].
In the present study, the majority of the patients who had a myopenic-obese profile suffered from Crohn’s disease. These patients were characterized as having a long disease duration compared to patients with other profiles. One can speculate that the myopenic-obese profile in patients with IBD is to a certain extent the result of accumulated inflammatory burden, as chronic systemic inflammation has been associated with low muscle mass and high fat mass [Citation36]. The myopenic-obese profile has also been found to entail a risk for cardiometabolic syndrome [Citation37] as well as rapid deterioration of physical functions in late adulthood [Citation28]. Notably, patients who suffer from IBD and have the myopenic-obese body composition profile have BMI values similar to those of patients who have the normal profile. As a consequence, they risk not to be recognized using traditional BMI measurements alone. This observation supports the generally held view that body composition measurements are more informative than BMI alone in patients with IBD [Citation38,Citation39].
The obesity profile was almost twice as common in the IBD group as in the control group. One-quarter of the young adults with IBD had a body composition profile that was characterized as ‘obese’ (obese profile, 16%; and myopenic-obese profile, 9%), whereas the corresponding percentage in the control group was 13% (obese profile, 11%; and myopenic-obese profile, 2%). Furthermore, the majority of the patients who were suffering from IBD and showed the obese profile had ulcerative colitis. In accordance with this, increased fat mass is more often reported in adult patients with ulcerative colitis (12%) than in those with Crohn’s disease (3%) [Citation1].
In young adulthood, a low SMI Z-score was strongly associated with compromised BMD. This was true for both our patients with IBD and the controls. Thus, individuals with the myopenic or myopenic-obese profile had lower BMD Z-scores than those with a normal profile. In addition, using a regression model, a diagnosis of IBD in childhood was found to be an independent risk factor for lower BMD in young adulthood, regardless of the individual SMI Z-score. In agreement with our results demonstrating a clear relationship between myopenia and BMD, such an association has previously been reported in a healthy adult European cohort [Citation16]. Furthermore, a low SMI has been reported to be predictive of osteopenia in adult patients with IBD [Citation34].
The exact mechanisms underlying the altered body composition seen in patients with IBD are unclear. Implicated factors include: (i) Inflammation per se, given that skeletal muscle depletion has been shown to be reversed after treatment with either anti-TNF-α [Citation40] or colectomy [Citation41]; (ii) physical inactivity and sedentary life-style in childhood, which have been shown to play important roles in the development of both skeletal muscle [Citation42] and bone [Citation43]; (iii) malnutrition, possibly caused by malabsorption, low dietary intake and/or higher energy expenditure [Citation44]; and (iv) treatment with corticosteroids, for which common side-effects are low BMD and increased fat mass [Citation45].
Our data suggest that the measurement of body composition in patients with IBD is a valuable tool in clinical praxis. An altered body composition may indicate inadequately controlled IBD, implicating ongoing chronic inflammation and/or malnutrition. A multidisciplinary treatment approach may be beneficial for patients with IBD, e.g., in optimizing inflammation control and nutritional intake, as well as increasing patient awareness of the need for appropriate physical activity. Body composition measurements may also be helpful for estimating surgical risks in patients with IBD, as studies in adults with IBD have shown that both low skeletal muscle mass and obesity predict increased risk for surgery and a higher rate of major postoperative complications [Citation46,Citation47].
To the best of our knowledge, this is the first study on body composition that focuses on SMI and fat % in young adults with childhood-onset IBD. A strength of the study is that we have had the opportunity to compare our young adult patients with a large contemporary normative reference cohort from the same region, the southwest of Sweden. Another strength is that our cohort is likely to represent the whole clinical spectrum of IBD in our catchment area. A limitation of the study is that about one-third of the patients in our cohort were lost to follow-up. However, these patients did not clearly differ from the participants regarding diagnosis, age at diagnosis, medical regime or gender, and in our opinion the present data remain representative for the cohort. Other limitations are that we did not register the daily dosage of prednisolone, nutritional intake, physical activity, inflammatory markers or disease progression of the subjects at each study visit.
In summary, young adults with childhood-onset IBD carry a high risk for altered body composition traits. The myopenic and myopenic-obese body composition profiles were more frequently observed in patients with IBD than in controls, and these profiles were strongly associated with low BMD. Having been diagnosed with IBD in childhood represented arisk for low BMD, regardless of SMI Z-score.
Author contributions
G.V. Sigurdsson, R. Saalman and S. Schmidt contributed to the study design, data collection, data analysis and manuscript writing and review. D. Mellström, C. Ohlsson, M. Karlsson and M. Lorentzon contributed to the study design, data collection and manuscript review. All the authors approved the final draft of the manuscript.
Acknowledgments
We thank all our patients for participation in this study, Britt-Marie Käck (RN) and the staff at the Geriatric Medicine Clinic in Gothenburg, and especially Senada Catic, Ulrika Hjertonsson, and Vera Gligoric for the measurements of our patients. Jan-Åke Nilsson at Lund University is thanked for statistical advice.
Disclosure statement
The authors have no conflicts of interest to disclose.
Additional information
Funding
References
- Bryant RV, Trott MJ, Bartholomeusz FD, et al. Systematic review: body composition in adults with inflammatory bowel disease. Aliment Pharmacol Ther. 2013;38(3):213–225.
- Back IR, Marcon SS, Gaino NM, et al. Body composition in patients with Crohn’s disease and ulcerative colitis. Arq Gastroenterol. 2017;54(2):109–114.
- Boot AM, Bouquet J, Krenning EP, et al. Bone mineral density and nutritional status in children with chronic inflammatory bowel disease. Gut. 1998;42(2):188–194.
- Hill RJ. Update on nutritional status, body composition and growth in paediatric inflammatory bowel disease. WJG. 2014;20(12):3191–3197.
- Burnham JM, Shults J, Semeao E, et al. Body-composition alterations consistent with cachexia in children and young adults with Crohn disease. Am J Clin Nutr. 2005;82(2):413–420.
- Schmidt S, Mellstrom D, Norjavaara E, et al. Low bone mineral density in children and adolescents with inflammatory bowel disease: a population-based study from Western Sweden. Inflamm Bowel Dis. 2009;15(12):1844–1850.
- Schmidt S, Mellstrom D, Norjavaara E, et al. Longitudinal assessment of bone mineral density in children and adolescents with inflammatory bowel disease. J Pediatr Gastro Nutr. 2012;55(5):511–518.
- Mager DR, Carroll MW, Wine E, et al. Vitamin D status and risk for sarcopenia in youth with inflammatory bowel diseases. Eur J Clin Nutr. 2018;72(4):623–626.
- Hardy R, Cooper MS. Bone loss in inflammatory disorders. J Endocrinol. 2009;201(3):309–320.
- Graumam RQ, Pinheiro MM, Nery LE, et al. Increased rate of osteoporosis, low lean mass, and fragility fractures in COPD patients: association with disease severity. Osteoporos Int. 2018;29(6):1457–1468.
- Ferretti JL, Capozza RF, Cointry GR, et al. Gender-related differences in the relationship between densitometric values of whole-body bone mineral content and lean body mass in humans between 2 and 87 years of age. Bone. 1998;22(6):683–690.
- Frost HM, Schonau E. The “muscle-bone unit” in children and adolescents: a 2000 overview. J Pediatr Endocrinol Metab. 2000;13(6):571–590.
- Frost HM. Bone’s mechanostat: a 2003 update. Anat Rec A Rec. 2003;275:1081–1101.
- Chalhoub D, Boudreau R, Greenspan S, for the Osteoporotic Fractures in Men (MrOS) Study Research Group, et al. Associations between lean mass, muscle strength and power, and skeletal size, density and strength in older men. J Bone Miner Res. 2018;33(9):1612–1621.
- Kim J, Wang ZM, Heymsfield SB, et al. Total-body skeletal muscle mass: estimation by new dual-energy X-ray absorptiometry method. Faseb J. 2002;16:A230–A230.
- Verschueren S, Gielen E, O’Neill TW, et al. Sarcopenia and its relationship with bone mineral density in middle-aged and elderly European men. Osteoporos Int. 2013;24(1):87–98.
- Guo B, Wu Q, Gong J, et al. Relationships between the lean mass index and bone mass and reference values of muscular status in healthy Chinese children and adolescents. J Bone Miner Metab. 2016;34(6):703–713.
- Fearon K, Evans WJ, Anker SD. Myopenia-a new universal term for muscle wasting. J Cachexia Sarcopenia Muscle. 2011;2(1):1–3.
- Cruz-Jentoft AJ, Baeyens JP, Bauer JM, et al. Sarcopenia: European consensus on definition and diagnosis: report of the European Working Group on Sarcopenia in Older People. Age Ageing. 2010;39(4):412–423.
- Sayer AA, Syddall H, Martin H, et al. The developmental origins of sarcopenia. J Nutr Health Aging. 2008;12(7):427–432.
- Visser M, Goodpaster BH, Kritchevsky SB, for the Health ABC Study, et al. Muscle mass, muscle strength, and muscle fat infiltration as predictors of incident mobility limitations in well-functioning older persons. J Gerontol A Biol Sci Med Sci. 2005;60(3):324–333.
- Sayer AA, Syddall HE, Martin HJ, et al. Is grip strength associated with health-related quality of life? Findings from the Hertfordshire Cohort Study. Age Ageing. 2006;35(4):409–415.
- Kim TN, Park MS, Lim KI, et al. Skeletal muscle mass to visceral fat area ratio is associated with metabolic syndrome and arterial stiffness: the Korean Sarcopenic Obesity Study (KSOS). Diabetes Res Clin Pract. 2011;93(2):285–291.
- Gale CR, Martyn CN, Cooper C, et al. Grip strength, body composition, and mortality. Int J Epidemiol. 2007;36(1):228–235.
- Janssen I, Shepard DS, Katzmarzyk PT, et al. The healthcare costs of sarcopenia in the United States. J Am Geriatr Soc. 2004;52(1):80–85.
- Singh S, Dulai PS, Zarrinpar A, et al. Obesity in IBD: epidemiology, pathogenesis, disease course and treatment outcomes. Nat Rev Gastroenterol Hepatol. 2017;14(2):110–121.
- Baumgartner RN. Body composition in healthy aging. Ann New York Acad Sci. 2006;904(1):437–448.
- Cauley JA. An Overview of Sarcopenic Obesity. J Clin Densitometry. 2015;18(4):499–505.
- Sigurdsson GV, Schmidt S, Mellstrom D, et al. Bone mass development from childhood into young adulthood in patients with childhood-onset inflammatory bowel disease. Inflamm Bowel Dis. 2017;23(12):2215–2226.
- Darelid A, Nilsson M, Kindblom JM, et al. Bone turnover markers predict bone mass development in young adult men: A five-year longitudinal study. J Clin Endocrinol Metab. 2015;100(4):1460–1468.
- Lorentzon M, Mellstrom D, Ohlsson C. Age of attainment of peak bone mass is site specific in Swedish men–The GOOD study. J Bone Miner Res. 2005;20(7):1223–1227.
- Alwis G, Rosengren B, Stenevi-Lundgren S, et al. Normative dual energy X-ray absorptiometry data in Swedish children and adolescents. Acta Paediatrica. 2010;99(7):1091–1099.
- Mazess RB, Hanson JA, Payne R, et al. Axial and total-body bone densitometry using a narrow-angle fan-beam. Osteoporos Int. 2000;11(2):158–166.
- Bryant RV, Ooi S, Schultz CG, et al. Low muscle mass and sarcopenia: common and predictive of osteopenia in inflammatory bowel disease. Aliment Pharmacol Ther. 2015;41(9):895–906.
- Hruby A, Hu FB. The epidemiology of obesity: a big picture. Pharmacoeconomics. 2015;33(7):673–689.
- Stenholm S, Harris TB, Rantanen T, et al. Sarcopenic obesity: definition, cause and consequences. Curr Opin Clin Nutr Metab Care. 2008;11(6):693–700.
- Dominguez LJ, Barbagallo M. The cardiometabolic syndrome and sarcopenic obesity in older persons. J CardioMetab Syndrome. 2007;2(3):183–189.
- Hill RJ, Davies PS. You look all right to me: compromised nutritional status in paediatric patients with ulcerative colitis. J Pediatr Gastroenterol Nutr. 2013;56(4):385–389.
- Adams DW, Gurwara S, Silver HJ, et al. Sarcopenia Is Common in Overweight Patients with Inflammatory Bowel Disease and May Predict Need for Surgery. Inflamm Bowel Dis. 2017;23(7):1182–1186.
- Subramaniam K, Fallon K, Ruut T, et al. Infliximab reverses inflammatory muscle wasting (sarcopenia) in Crohn’s disease. Aliment Pharmacol Ther. 2015;41(5):419–428.
- Zhang T, Ding C, Xie T, et al. Skeletal muscle depletion correlates with disease activity in ulcerative colitis and is reversed after colectomy. Clin Nutr. 2017;36(6):1586–1592.
- Lee D, Lewis JD, Shults J, et al. The association of diet and exercise with body composition in pediatric Crohn’s disease. Inflamm Bowel Dis. 2018;24(6):1368–1375.
- Nobile S, Grand RJ, Pappa HM. Risk factors for low bone mineral density in pediatric inflammatory bowel disease: the positive role of physical activity. Eur J Gastroenterol Hepatol. 2018;30:471–476.
- Hartman C, Eliakim R, Shamir R. Nutritional status and nutritional therapy in inflammatory bowel diseases. WJG. 2009;15(21):2570–2578.
- LeBlanc CM, Ma J, Taljaard M, the Canadian STeroid‐Associated Osteoporosis in the Pediatric Population (STOPP) Consortium, et al. Incident vertebral fractures and risk factors in the first three years following glucocorticoid initiation among pediatric patients with rheumatic disorders. J Bone Miner Res. 2015;30(9):1667–1675.
- Ryan E, McNicholas D, Creavin B, et al. Sarcopenia and inflammatory bowel disease: a systematic review. Inflamm Bowel Dis. 2019;25:67–73.
- Hass DJ, Brensinger CM, Lewis JD, et al. The impact of increased body mass index on the clinical course of Crohn’s disease. Clinical gastroenterology and hepatology: the official clinical practice journal of the. Am Gastroenterol Assoc. 2006;4:482–488.