
Abstract
Background: Liver cirrhosis is associated with osteoporosis and liver transplantation (LT) with increased bone loss. This study aimed to in LT candidates investigate the potential relation between bone mineral density (BMD) and BMD loss in those who undergo LT, with malnutrition, systemic inflammation, and hormonal status.
Methods: We included 102 consecutively recruited cirrhotic LT candidates between May 2004 and April 2007. BMD was assessed by means of dual energy X-ray absorptiometry (DXA). Malnutrition was defined by means of anthropometry and assessment of recent weight loss. In 75/102 patients, serum-thyroid stimulating hormone (TSH), free triiodthyronine (T3) and free thyroxine (T4) and growth hormone (GH), cortisol, free testosterone, dehydroepiandrosterone sulfate, estradiol, interleukin-6, and tumor necrosis factor (TNF)-α was assessed. Overall 57/102 patients received a LT and 47/102 were followed for one year post-LT. At follow-up, nutritional status and BMD were assessed in all patients (n = 47) while 34/47 had available blood samples for analysis.
Results: Forty (40%) LT- candidates had osteopenia or osteoporosis and 34 (38%) were malnourished. Malnutrition was associated with osteopenia/osteoporosis (odds ratio: 3.5, 95% CI 1.4, 9.9). Hip BMD Z-score decreased −0.25 (95% CI −0.41, −0.09) from baseline to one year post-LT. High baseline TNF-α correlated with a more marked decline in BMD (Partial correlation (r) = −0.47, p < .05) as did high baseline cortisol levels (r = −0.49, p < .05).
Conclusion: Malnutrition in liver cirrhosis seems to be associated with osteopenia/osteoporosis, and systemic inflammation (higher TNF-α) and systemic stress (higher cortisol) to bone loss in patients who undergo LT.
Introduction
Osteoporosis occurs in 9–30% of patients with chronic liver disease [Citation1,Citation2]. During the first months after liver transplantation (LT), osteoporosis usually deteriorates [Citation1] leading to increased fracture risk [Citation3]. The underlying pathogenesis of this is unclear. There are only few and partly conflicting data regarding main factors that may influence the risk of osteoporosis in cirrhosis, which may be due to, at least partly, diversity in liver disease etiology and small patient cohorts in published reports [Citation4,Citation5]. Thus, in patients with chronic liver disease of different etiologies and severity, lower body mass index, cholestasis, alcoholic etiology, longer disease duration, postmenopausal status, low vitamin D, and advanced disease have been considered to be associated with low BMD [Citation6–Citation10]. These findings, however, have only partly been confirmed by others, and most of these studies were not focused specifically on cirrhosis patients [Citation2,Citation11].
Hence, malnutrition and decreased body weight, which are common in liver cirrhosis, are thought to be involved in osteoporosis in non-cirrhotic patients [Citation12–Citation14]. In cirrhosis patients, chronic systemic inflammation is implicated by elevated levels of pro-inflammatory cytokines such as interleukin-6 (IL-6), interleukin-1ß (IL-1ß), and tumor necrosis factor-α (TNF-α) as well as tumor necrosis factor receptor p55 [Citation15–Citation17]. Chronic low-grade inflammation is also associated with low BMD [Citation18,Citation19] and increased fracture risk [Citation20], as higher levels of complement activity, IL-6, C-reactive protein (CRP) and TNF-α have been demonstrated in non-cirrhotic subjects with BMD loss, osteoporosis and fragility-related fractures [Citation21,Citation22]. However, there are very few data on the potential role of malnutrition and systemic inflammation in osteoporosis in cirrhosis patients before and after LT.
Cirrhosis is associated with altered metabolism and hormonal status [Citation23–Citation28], conditions which are also associated with osteoporosis in non-cirrhotic individuals [Citation23–Citation25]. For example, altered thyroid hormone status may exert a negative impact on BMD and increase fracture risk [Citation25]. Furthermore, growth hormone (GH), dihydroepiandrostenedione (DHEA) and estrogen exert an anabolic [Citation27,Citation28] and cortisol a catabolic effect on the skeleton [Citation26]. These factors may all be altered in cirrhosis, but their potential relation to BMD before and after LT is unclear.
The main aims of the current exploratory study were to (i) determine the proportion of patients with osteopenia/osteoporosis in cirrhotic LT candidates and investigate whether osteopenia/osteoporosis is associated with malnutrition, systemic inflammation and/or hormone concentrations and (ii), investigate whether these factors are related with BMD loss during the first year post-LT.
Patients and methods
Baseline
This study is a post-hoc analysis of data collected in a project with the primary aims to determine gastrointestinal symptom burden and health-related quality of life in cirrhotic transplant candidates and in patients who undergo LT. The study is described in detail in previous publications [Citation29,Citation30]. In short, the total cohort included 108 consecutive patients with cirrhosis of any cause, who were referred for pre-LT evaluation at the Sahlgrenska University Hospital in Gothenburg, Sweden, between May 2004 and April 2007. The diagnosis of cirrhosis was established histologically or based on the presence of at least two of the following four characteristics: (i) characteristic imaging features, (ii) varices, (iii) ascites, and (iv) increased international normalized ratio (INR), that could not be attributed to any other cause. Patients unable to complete questionnaires due to cirrhosis complications or comorbidities, as well as patients unable to understand the Swedish language, were excluded. Patient data, such as cirrhosis etiology and comorbid illness, were collected from medical records [Citation30]. Cirrhosis severity was expressed as the Child–Pugh score and MELD score. Laboratory analyses and assessment for ascites and hepatic encephalopathy were performed at pretransplant evaluation.
Body weight and height were measured using standardized equipment at baseline and dry weight was estimated, as described by Mendenhall [Citation31] after also taking into consideration serial weight measurements commonly available in most patients (who had been followed up closely as potential LT candidates, before/after ascites paracentesis). Body mass index (BMI) was then calculated as body weight divided by squared body height (kg/m2). We measured triceps skinfold (TSF) in arms, as an estimate of fat mass. The TSF was measured at the center of the posterior aspect of the upper arm. We measured mid arm circumference (MAC) with a tape measure according to Lohman et al. [Citation32]. Mid-arm muscle circumference (MAMC) was calculated using the formula: MAMC = MAC-(3.14 × TSF), as an estimate of lean muscle mass. Patients were classified as malnourished when TSF or MAMC were <10th percentile according to standard tables for the Swedish population based on age and gender [Citation33], if BMI was below 20 kg/m2 and/or there had been a weight loss exceeding 5% during the 3 months, or 10% during the 6 months before the exam. Nutritional status assessment was performed by a dietician experienced in patients with chronic liver disease in the pre-LT setting.
Bone mineral density (BMD; g/cm2) in the left hip was assessed in 102/108 patients by dual energy X-ray absorptiometry (DXA) (GE Lunar DPX-IQ, GE Lunar Corp., Madison, WI, USA). Analyses performed in the current study are based on the 102 patients with available DXA data at baseline. The Lunar standard software from the company reference population was used to automatically calculate T- and Z-scores. Among the 102 patients undergoing DXA at baseline, 5 were on bisphosphonate treatment, 6 on calcium and vitamin D treatment, 2 had hypothyroidism and 31 diabetes mellitus (all on relevant therapy). None had any ongoing infection [Citation33].
Blood samples were collected in 75/102 patients and analyzed for serum thyrotropin (TSH), free triiodthyronine (T3) and free thyroxine (T4), growth hormone (GH), cortisol, free testosterone, dehydroepiandrosterone (DHEA), estradiol, C-reactive protein (CRP), interleukin-6 (IL-6), and tumour necrosis factor-α (TNF-α). All blood samples were frozen and stored at −80 °C before analysis, as described previously [Citation30].
The study protocol was approved by the regional ethics committee in Västra Götaland (175-04) and all patients gave written informed consent.
Patients who underwent LT
Overall 65/102 patients were listed for liver transplantation (LT). Sixty-one underwent LT after a median of 75 days (IQR 36–171). Four out of 61 transplanted patients died during the first year post-LT. Patients followed up at other hospitals (n = 10), were excluded from further analyses. Forty-seven out of 57 LT-recipients alive, underwent a second DXA measurement and nutritional status assessment at our institution, approximately one year after the LT. Weight and BMI (n = 47) as well as TSF and MAMC (n = 29) were assessed using the same procedure as at baseline. Percent change in weight, BMI, TSF, and MAMC from pre-LT evaluation until follow-up was calculated. Overall, 34/47 patients who were followed up, had blood samples analyzed at the pre-LT evaluation ( and ).
Table 1. Patient characteristics at baseline.
Table 2. Step-wise logistic regression analysis for osteopenia/osteoporosis at baseline.
Medical records were reviewed at follow-up to estimate cumulative steroid dose post-LT and first year post-LT morbidity (n = 47). Forty-four out of 47 (94%) patients were treated with corticosteroids post-LT. The cumulative steroid dose was defined as the accumulated amount of steroids the patients received during the first year after LT, converted into doses of hydrocortisone. Forty-five patients were treated with takrolimus post-LT, and 7/45 (16%) were also treated with mycophenolate. One patient was treated only with cyclosporin and another only with sirolimus. Nine of 47 patients (19%) were treated with bisphosphonates post-LT. Morbidity was defined as any type of comorbid illness requiring hospital admission for at least one day, including complications related to the surgical procedure and rejection episodes. The same patient could be admitted to hospital several times and for different conditions. Twenty-four patients experienced at least one rejection episode of whom 16 were admitted to hospital. Thirty out of 47 (64%) patients had one or several acute medical or surgical conditions leading to hospital admission. Hospitalization occurred in 16 cases due to rejection, in 16 cases due to onset or deterioration of diabetes, in 16 cases due to complications of the liver or biliary tract, and in 15 cases due to cardiovascular complications (Supplementary Table 1).
Statistics
Statistical analyses were performed using SPSS for MAC version 25.0. Data were tested for normality with the Shapiro–Wilk’s test. Continuous normally distributed data were presented as mean and standard deviation (SD) and not normally distributed data as median and interquartile range (IQR) or quartiles and changes as mean with 95% confidence intervals (95% CI), as appropriate. The World Health Organization (WHO) definition was used to identify individuals with normal BMD, osteopenia and osteoporosis. The crude odds ratio (OR) for having osteopenia/osteoporosis at baseline was calculated using logistic regression. Using a step-wise approach we thereafter calculated odds ratios (OR) for osteopenia/osteoporosis in a multivariable logistic regression analysis including the predefined factors sex, age, MELD-score, and trends and significant variables in the crude logistic regression. Student’s T-test was used to investigate differences in changes in hip BMD Z-score. Correlations between changes in hip BMD Z-score and baseline estimates was evaluated by Pearson coefficient (r) for normally distributed continuous variables, and with Spearman coefficient (rho) for not normally distributed data. Using a step-wise approach we thereafter calculated the correlation (r) for having osteopenia/osteoporosis in a Pearson’s Partial correlation analysis including the predefined factors sex, age, MELD-score, and significant variables in the crude correlation analysis. Statistical significance limit was set to p < .05.
Results
BMD at pre-LT evaluation
Pre-transplant left hip BMD (n = 102 patients) was 0.98 (0.17) g/cm2, corresponding to a Z score of −0.22 (SD 1.26). Thirty-three percent of patients had osteopenia and 7% osteoporosis. There was no statistically significant association between MELD-score, Child–Pugh score, Child–Pugh class and low bone mass at baseline (osteopenia/osteoporosis, ), nor any significant difference in the prevalence of low bone mass (osteopenia/osteoporosis) between patients who underwent vs. those who did not undergo LT (16/61 (43%) vs. 14/41 (34%), p = .50).
Malnutrition and osteopenia/osteoporosis at pre-LT evaluation
Pre-LT malnutrition, BMI and TSF, but not MAMC, were associated with low hip BMD (osteopenia/osteoporosis, n = 102) in crude analysis (), and in multivariable analysis after adjustment for age, sex, MELD-score, and cholestatic etiology (). Analyses were also performed after exclusion of patients on bisphosphonate treatment at pre-LT evaluation (n = 5), rendering similar results (data not shown).
Systemic inflammation, hormonal dysregulation and bone status at pre-LT evaluation
In logistic regression analysis, none of the inflammatory markers, nor any of the measured hormones were found to be associated with osteopenia/osteoporosis (n = 75) ().
Post-LT change in Z-score
Left hip BMD was pre-LT 0.96 (SD 0.16) g/cm2 and at one year post-LT 0.92 (SD 0.15) g/cm2 (n = 47, patients with both pre-LT and one year post-LT results). These correspond to hip BMD Z scores of −0.50 (SD 1.23) and −0.75 (SD 1.18), respectively. Thus, BMD loss was −0.04 (95% CI −0.02, −0.06) g/cm2, corresponding to a decline in hip BMD Z score by −0.25 (95% CI −0.41, −0.09).
Overall, 32/47(68%) patients had lower hip BMD Z-score one year post-LT compared to baseline. In patients with cholestatic disease, there was no significant change in hip BMD Z-score (mean 0.04 (95% CI −0.18, 0.25) at one year post-LT vs. baseline. In patients with cirrhosis due to other etiologies than cholestatic, there was a significant decline in hip BMD Z-score during follow-up (mean −0.39 (95% CI −0.59, −0.18). Thus, there was a statistically significant difference in hip Z-score change between patients with cholestatic cirrhosis vs. those with cirrhosis due to other etiologies (mean diff = 0.43 (95% CI: 0.10, 0.75)) (). However, mean decrease in hip BMD Z-score was not significantly parted between genders, and change in hip BMD Z-score did not correlate with age, MELD score, Child–Pugh score or baseline hip BMD ( and Supplementary Table 2).
Table 3. Mean difference in change of left hip BMD Z-score (from baseline to one-year post-LT) between patients with vs. those without the specified parameter.
Correlation between markers of malnutrition and the one year change in Z-score
Neither malnutrition, BMI, TSF nor MAMC at pre-LT evaluation were correlated with hip BMD Z-score change (N = 47, Supplementary Table 2). There was an increase in TSF from baseline to follow-up by median 41.8% (IQR −3.5%, 77.8%), but not in BMI; median 1.5% (IQR −7.8%, 8.7%), weight; median 1.6% (IQR −6.7%, 8.7%), and MAMC; median 1.9% (IQR −7.5%, 11.5%). There were no statistically significant correlations between hip BMD Z-score change and change in nutritional status, assessed by means of TSF (rho = 0.08, p = .68), BMI (rho = 0.20, p = .19), weight (rho = 0.19, p = .20), or MAMC (rho = 0.18, p = .37).
Correlation between pre-LT inflammatory and hormonal markers and change in Z-score one year post-LT
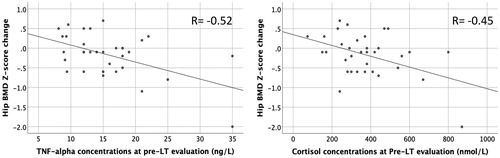
Pre-LT concentrations of TNF-α and cortisol correlated, with hip BMD Z-score change in crude correlation analysis (r = −0.52, p = .002, and r = −0.45, p = .008, respectively, N = 34, ) as well as in Pearson’s partial correlation analysis after adjustment for age, sex, MELD score, bisphosphonate treatment, cholestatic etiology, and morbidity post-LT (r = −0.47, p = .012, and r = −0.49, p = .008, respectively, N = 34, Supplementary Table 2). None of the other inflammatory markers or hormones were associated with the change in hip BMD Z-score (Supplementary Table 2).
Figure 1. Scatter plot between hip BMD Z-score change, and concentrations of TNF-α and cortisol at pre-LT evaluation. LT: liver transplantation; BMD: bone mineral density.
Correlation between morbidity and in Z-score change after LT
Patients who were vs. those who were not admitted to hospital due to any reason during the first year post-LT, had a greater decrease in left hip BMD Z-score (mean −0.47 (95% CI: −0.70, −0.23 vs. mean 0.00 (95% CI: −0.19, 0.18), respectively). There were no statistically significant correlations between hip BMD Z-score and waiting time to LT, cumulative steroid use, mycophenolate or bisphosphonate treatment nor occurrence of rejection episodes ( and Supplementary Table 2).
Discussion
The main finding of our study was that poor nutritional status in cirrhotic transplant candidates is associated with osteopenia/osteoporosis. Furthermore, BMD decrease post-LT is associated with high baseline inflammation (high systemic TNF-α) and high baseline stress (high systemic cortisol) levels. This study also confirms that cirrhosis has a negative impact on BMD which seems to deteriorate during the waiting time up to and in the first year following LT. The decrease in hip BMD Z-score was −0.25 (95% CI −0.41, −0.09) in the whole cohort. However, for patients with cholestatic etiology there was no decrease in the hip BMD Z-score during follow-up, and patients with cirrhosis of other etiologies than cholestatic displayed a significantly greater decrease in hip BMD Z-score compared to those with cholestatic disease.
Malnutrition exerts a negative impact on BMD in non-cirrhotic individuals [Citation13]. In unselected patients with chronic liver disease, Lopez-Larramona et al. showed that malnutrition was associated with low hip BMD and increased fracture risk [Citation34]. However, only one quarter of patients had cirrhosis and malnutrition was defined by a nutritional status index which includes serum albumin and cholesterol, both often reduced in cirrhosis patients [Citation34]. Instead, we assessed nutritional status by anthropometric measurements, performed by experienced dieticians, in patients with established cirrhosis. We found a correlation between nutritional status and osteopenia/osteoporosis, but not between nutritional status pre-LT and changes in hip BMD Z-score during the first postoperative year. One year post-LT, we found that fat mass had increased (assessed by TSF). However, similar to findings by others [Citation12], only small non-significant increases in muscle mass were observed (assessed by MAMC). There were no statistically significant correlations between changes in nutritional status (as assessed by TSF, BMI, weight, and MAMC) and changes in hip BMD Z-score.
Malnutrition and low subcutaneous fat mass (as assessed by means of TSF) were related to osteopenia/osteoporosis prior to LT. While visceral fat is associated with higher levels of systemic inflammation and BMD loss, subcutaneous fat, may protect against BMD loss, being associated with higher levels of several hormones, such as estrogen and adiponectin [Citation35]. As adipose tissue hormones are known to be altered in cirrhosis patients [Citation36], further studies are warranted to evaluate the potential role of fat distribution and associated adipose tissue hormone alterations in relation to osteoporosis in these patients.
Low MAMC, a surrogate for low muscle mass, indicates pre-sarcopenia or established sarcopenia [Citation37,Citation38]. However, in our study, MAMC was not associated with osteopenia/osteoporosis. These findings are inconsistent with previous large-scale community-based studies in non-cirrhotics [Citation39] as well as a study indicating correlation between sarcopenia and low BMD in patients with chronic hepatitis, the majority without established cirrhosis [Citation40]. The reasons for these discrepancies are unclear but may be related to differences in the study populations as well as in assessment of the muscle component between the current study (performed by means of MAMC measurement) and previous reports (which included computed tomography [Citation39] or DXA muscle scanning [Citation40] as well as evaluation of muscle strength [Citation39,Citation40] to define sarcopenia). Future studies evaluating the potential relationship of sarcopenia with osteoporosis should probably include assessments of muscle mass, strength, and performance [Citation39].
Inflammation, being an energy demanding condition, was recently suggested as a potentially major cause of malnutrition and changes in body composition in patients with chronic inflammatory diseases [Citation41]. Also, levels of inflammatory cytokines are higher in children with chronic liver disease and poor nutritional status than in those with normal nutritional status [Citation42]. Chronic inflammation may also be associated with increased BMD loss, since in inflammatory diseases, TNF-α activates osteoclastic bone destruction and inhibits osteoblastogenesis [Citation43]. Increased levels of the TNF-ligand superfamily member receptor-activator of nuclear factor kappa ligand (RANKL) and its signaling has also been implicated in BMD loss in cirrhosis patients [Citation44]. Interleukin-6 is an important inducer of liver regeneration but also an inducer of the acute phase response, and levels are increased in cirrhosis. Hence, upregulation of IL-6 in cirrhosis can cause a prolonged acute phase response that, in turn, may increase bone resorption [Citation45]. In our study, however, we found a negative correlation between baseline TNF-α and BMD hip Z-score at one-year post-LT, but no correlation with IL-6. More studies are clearly warranted to fully elucidate the potential role of inflammation in osteoporosis in these patients.
Cirrhosis leads to abnormalities of several hormonal systems, essential for bone metabolism. Low levels of DHEA and testosterone are common in cirrhosis patients, and this may exert negative effects on BMD [Citation27,Citation28]. However, we found no correlation with these hormones and BMD loss. Furthermore, several patients in our study had low cortisol pre-LT, which is not uncommon in cirrhosis patients who may have (relative) adrenal insufficiency [Citation24]. However, on group level we found that higher cortisol at baseline was associated with greater BMD loss after LT. Increased cortisol levels have in other patient groups been shown to be related with increased systemic stress and ongoing inflammation [Citation46].
Post-LT BMD loss has been thought to be, at least partly, due to the effects of major surgery and heavy medical treatment, often including high doses of glucocorticoids after LT. Glucocorticoids not only inhibit bone formation, but may also induce muscle weakness that delays the mobilization post-LT [Citation47], something that enhances BMD loss. In our series, however, the accumulated steroid dose was not associated with post-LT BMD loss.
We found that the occurrence of at least one hospital admission post-LT was associated with greater BMD loss. The latter could be considered as a surrogate of poor patient health status known to have negative effects on the bone [Citation48]. Patients with cholestatic liver cirrhosis, in contrast to other etiologies, did not lose BMD during the first year post-LT. It is conceivable that there are differences in the pathogenesis of bone loss in cholestatic versus non-cholestatic cirrhosis. The rapid osteoporosis development in cholestatic patients is characterized mainly by reduction of bone formation, and not increased bone resorption [Citation49], which may be mediated by ‘toxic’ effects from bilirubin and bile acids on bone [Citation6]. Hence, when negative effects of cholestasis diminish post-LT, these patients may have a more rapid recovery of ‘normal’ bone metabolism.
Major limitations of the present study are that it involved post-hoc analysis of collected data and that the sample size was rather small. The number of patients who underwent DXA measurements both at baseline and one-year post-LT was only 47, while the number of patients who underwent DXA measurements both at baseline and one-year post-LT and had baseline blood samples performed was only 34. Due to the small study sample, patients with osteopenia and osteoporosis were considered as one group, comparing them with patients with normal BMD. Therefore, differences between patients with osteopenia and osteoporosis were not investigated. At follow-up, the proportion of patients with cholestatic liver disease was higher, whereas the proportion of patients with HCC and diabetes was lower compared to baseline. This may be due to the fact that patients with advanced HCC and increased comorbidity burden may be less likely to be listed for LT but it may also limit the generalizability of some of our findings. Serum vitamin D was not measured in the present study, which is a limitation. However, it has previously been shown in patients with chronic liver disease that vitamin D concentrations were associated with low BMD [Citation9]. Strengths of the current report include the prospective collection of data and the longitudinal study design. The use of MAMC and TSF as markers of nutritional status is a strength since, compared to fat mass and lean mass calculated from DXA, these are only mildly affected by fluid retention [Citation50].
Conclusion
The findings of the present study suggest that malnutrition in liver cirrhosis patients is associated with osteopenia/osteoporosis, and that systemic inflammation (higher TNF-α) and systemic stress (higher cortisol) is associated with high BMD loss post-LT. Further studies in larger cohorts of patients with cirrhosis are warranted to confirm these findings and explore the potential role of malnutrition and systemic inflammation in the pathogenesis of osteoporosis in these patients.
Supplemental Material
Download PDF (101 KB)Disclosure statement
No potential conflict of interest was reported by the author(s).
References
- Krol CG, Dekkers OM, Kroon HM, et al. Longitudinal changes in BMD and fracture risk in orthotopic liver transplant recipients not using bone-modifying treatment. J Bone Miner Res. 2014;29(8):1763–1769.
- Monegal A, Navasa M, Guanabens N, et al. Osteoporosis and bone mineral metabolism disorders in cirrhotic patients referred for orthotopic liver transplantation. Calcif Tissue Int. 1997;60(2):148–154.
- Desai R, Jamieson NV, Gimson AE, et al. Quality of life up to 30 years following liver transplantation. Liver Transpl. 2008;14(10):1473–1479.
- Guanabens N, Pares A. Osteoporosis in chronic liver disease. Liver Int. 2018;38:776–785.
- Collier J. Bone disorders in chronic liver disease. Hepatology. 2007;46(4):1271–1278.
- Menon KV, Angulo P, Weston S, et al. Bone disease in primary biliary cirrhosis: independent indicators and rate of progression. J Hepatol. 2001;35(3):316–323.
- Guanabens N, Cerda D, Monegal A, et al. Low bone mass and severity of cholestasis affect fracture risk in patients with primary biliary cirrhosis. Gastroenterology. 2010;138:2348–2356.
- Guanabens N, Pares A, Marinoso L, et al. Factors influencing the development of metabolic bone disease in primary biliary cirrhosis. Am J Gastroenterol. 1990;85:1356–1362.
- Wariaghli G, Mounach A, Achemlal L, et al. Osteoporosis in chronic liver disease: a case-control study. Rheumatol Int. 2010;30(7):893–899.
- Muhsen IN, AlFreihi O, Abaalkhail F, et al. Bone mineral density loss in patients with cirrhosis. Saudi J Gastroenterol. 2018;24:342–347.
- Ninkovic M, Love SA, Tom B, et al. High prevalence of osteoporosis in patients with chronic liver disease prior to liver transplantation. Calcif Tissue Int. 2001;69(6):321–326.
- Giusto M, Lattanzi B, Di Gregorio V, et al. Changes in nutritional status after liver transplantation. World J Gastroenterol. 2014;20(31):10682–10690.
- Lloyd JT, Alley DE, Hawkes WG, et al. Body mass index is positively associated with bone mineral density in US older adults. Arch Osteoporos. 2014;9(1):175.
- Shin D, Kim S, Kim KH, et al. Importance of fat mass and lean mass on bone health in men: the Fourth Korean National Health and Nutrition Examination Survey (KNHANES IV). Osteoporos Int. 2014;25(2):467–474.
- Tazi KA, Moreau R, Herve P, et al. Norfloxacin reduces aortic NO synthases and proinflammatory cytokine up-regulation in cirrhotic rats: role of Akt signaling. Gastroenterology. 2005;129(1):303–314.
- Giron-Gonzalez JA, Martinez-Sierra C, Rodriguez-Ramos C, et al. Implication of inflammation-related cytokines in the natural history of liver cirrhosis. Liver Int. 2004;24(5):437–445.
- Tilg H, Moschen AR, Kaser A, et al. Gut, inflammation and osteoporosis: basic and clinical concepts. Gut. 2008;57(5):684–694.
- Duggan SN, Purcell C, Kilbane M, et al. An association between abnormal bone turnover, systemic inflammation, and osteoporosis in patients with chronic pancreatitis: a case-matched study. Am J Gastroenterol. 2015;110(2):336–345.
- Gonzalez-Calvin JL, Gallego-Rojo F, Fernandez-Perez R, et al. Osteoporosis, mineral metabolism, and serum soluble tumor necrosis factor receptor p55 in viral cirrhosis. J Clin Endocrinol Metab. 2004;89(9):4325–4330.
- Briot K, Geusens P, Em Bultink I, et al. Inflammatory diseases and bone fragility. Osteoporos Int. 2017;28(12):3301–3314.
- Cauley JA, Barbour KE, Harrison SL, et al. Inflammatory markers and the risk of hip and vertebral fractures in men: the osteoporotic fractures in men (MrOS). J Bone Miner Res. 2016;31(12):2129–2138.
- Scheidt-Nave C, Bismar H, Leidig-Bruckner G, et al. Serum interleukin 6 is a major predictor of bone loss in women specific to the first decade past menopause. J Clin Endocrinol Metab. 2001;86(5):2032–2042.
- Sinclair M, Gow PJ, Angus PW, et al. High circulating oestrone and low testosterone correlate with adverse clinical outcomes in men with advanced liver disease. Liver Int. 2016;36(11):1619–1627.
- Moini M, Yazdani Sarvestani M, Shams M, et al. Evaluation of adrenal function in nonhospitalized patients with cirrhosis. Can J Gastroenterol Hepatol. 2017;2017:1–6.
- Williams GR, Bassett J. Thyroid diseases and bone health. J Endocrinol Invest. 2018;41(1):99–109.
- Olney RC. Mechanisms of impaired growth: effect of steroids on bone and cartilage. Horm Res. 2009;72(1):30–35.
- Bobjer J, Bogefors K, Isaksson S, et al. High prevalence of hypogonadism and associated impaired metabolic and bone mineral status in subfertile men. Clin Endocrinol. 2016;85(2):189–195.
- Lee D, Kim H, Ahn SH, et al. The association between serum dehydroepiandrosterone sulphate (DHEA-S) level and bone mineral density in Korean men. Clin Endocrinol. 2015;83(2):173–179.
- Kalaitzakis E, Josefsson A, Castedal M, et al. Gastrointestinal symptoms in patients with cirrhosis: a longitudinal study before and after liver transplantation. Scand J Gastroenterol. 2013;48(11):1308–1316.
- Kalaitzakis E, Josefsson A, Castedal M, et al. Factors related to fatigue in patients with cirrhosis before and after liver transplantation. Clin Gastroenterol Hepatol. 2012;10(2):174–181, 181.e171.
- Mendenhall C, Roselle GA, Gartside P, et al. Relationship of protein calorie malnutrition to alcoholic liver disease: a reexamination of data from two Veterans Administration Cooperative Studies. Alcoholism Clin Exp Res. 1995;19(3):635–641.
- Lohman TG, Roche AF, Martorell R. Anthropometric standardization reference manual. Champaign (IL): Human Kinetics; 1988.
- Symreng T. Arm anthropometry in a large reference population and in surgical patients. Clin Nutr. 1982;1(3):211–219.
- Lopez-Larramona G, Lucendo AJ, Tenias JM. Association between nutritional screening via the Controlling Nutritional Status index and bone mineral density in chronic liver disease of various etiologies. Hepatol Res. 2015;45:618–628.
- Sheu Y, Cauley JA. The role of bone marrow and visceral fat on bone metabolism. Curr Osteoporos Rep. 2011;9(2):67–75.
- Bolukbas FF, Bolukbas C, Horoz M, et al. Child-Pugh classification dependent alterations in serum leptin levels among cirrhotic patients: a case controlled study. BMC Gastroenterol. 2004;4(1):23.
- Cornier MA, Despres JP, Davis N, et al. Assessing adiposity: a scientific statement from the American Heart Association. Circulation. 2011;124(18):1996–2019.
- Aggio DA, Sartini C, Papacosta O, et al. Cross-sectional associations of objectively measured physical activity and sedentary time with sarcopenia and sarcopenic obesity in older men. Prev Med. 2016;91:264–272.
- Edwards MH, Gregson CL, Patel HP, et al. Muscle size, strength, and physical performance and their associations with bone structure in the Hertfordshire Cohort Study. J Bone Miner Res. 2013;28(11):2295–2304.
- Bering T, Diniz KGD, Coelho MPP, et al. Association between pre-sarcopenia, sarcopenia, and bone mineral density in patients with chronic hepatitis C. J Cachexia Sarcopenia Muscle. 2018;9(2):255–268.
- Jensen GL, Hsiao PY, Wheeler D. Adult nutrition assessment tutorial. JPEN J Parenter Enteral Nutr. 2012;36(3):267–274.
- Santetti D, de Albuquerque Wilasco MI, Dornelles CT, et al. Serum proinflammatory cytokines and nutritional status in pediatric chronic liver disease. World J Gastroenterol. 2015;21(29):8927–8934.
- Osta B, Benedetti G, Miossec P. Classical and paradoxical effects of TNF-α on bone homeostasis . Front Immunol. 2014;5:48.
- Santos LA, Romeiro FG. Diagnosis and management of cirrhosis-related osteoporosis. Biomed Res Int. 2016;2016:1–12.
- Scheller J, Chalaris A, Schmidt-Arras D, et al. The pro- and anti-inflammatory properties of the cytokine interleukin-6. Biochim Biophys Acta. 2011;1813(5):878–888.
- DeSantis AS, DiezRoux AV, Hajat A, et al. Associations of salivary cortisol levels with inflammatory markers: the Multi-Ethnic Study of Atherosclerosis. Psychoneuroendocrinology. 2012;37(7):1009–1018.
- Kulak CA, Borba VZ, Kulak J, Jr, et al. Osteoporosis after transplantation. Curr Osteoporos Rep. 2012;10(1):48–55.
- Lan GB, Xie XB, Peng LK, et al. Current status of research on osteoporosis after solid organ transplantation: pathogenesis and management. Biomed Res Int. 2015;2015:1–10.
- Danford CJ, Trivedi HD, Bonder A. Bone health in patients with liver diseases. J Clin Densitom. 2019;S1094-6950(18):30253–1.
- Matos C, Porayko MK, Francisco-Ziller N, et al. Nutrition and chronic liver disease. J Clin Gastroenterol. 2002;35(5):391–397.