
Abstract
Background: Enteroendocrine cells (EEC) have been suggested to have a role in the pathogenesis of irritable bowel syndrome (IBS). Although many studies have analysed possible numeric changes of EEC in IBS, the results differ between different studies. One reason might be due to difficulties in standardising the morphometric method.
Aim: The aim of this study was to compare two different methods for counting EEC in jejunum biopsies from patients with IBS and healthy controls.
Method: Fifty-one patients with IBS and 35 healthy controls were included in the study. Jejunum mucosa was procured using a Watson capsule. Slides were immunostained for serotonin and chromogranin A and then scanned digitally. The morphometry was done by counting cells per high power field (hpf) and per mm2 after defining area of the mucosa. The two methods were compared using Bland Altman analysis.
Results: There was no difference in the number of EEC in patients with IBS compared to healthy controls. The number of cells detected by per mm2 area of mucosa were higher than number of cells per hpf. Counting EEC per high power field systematically underestimated the number of cells in the mucosal area.
Conclusions: Counting cells per mm2 mucosal area gives a better representation of the number of EEC in small bowel mucosa. The finding of no difference in EEC numbers does not imply an equal function and further studies are needed to evaluate the role, if any of EEC, in IBS.
Introduction
Irritable bowel syndrome (IBS) is a common disorder defined by the presence of certain gastrointestinal (GI) symptoms and absence of an organic cause for the symptoms [Citation1]. Changes in cellular components of the GI-mucosa in IBS have been studied by many researchers (reviewed in [Citation2]) and the role of enteroendocrine cells (EEC) in the pathogenesis of IBS has been suggested. Among the first to study EEC in the GI-tract of patients with IBS were Kyösola et al. [Citation3] and Verity et al. [Citation4] who reported increased numbers of EEC in rectal biopsies from patients with IBS. Other researchers reproduced this finding in rectal mucosa, particularly in post-infectious IBS [Citation5,Citation6], but not all studies found differences [Citation2]. Increased numbers of EEC were linked to rectal hypersensitivity in patients with diarrhoea-predominant IBS (IBS-D) [Citation7]. Other physiological changes observed in patients with IBS include increased colonic activity [Citation8] and changes in gastric [Citation9,Citation10] and small bowel motility [Citation11,Citation12] which make the study of EEC particularly interesting since EEC are involved in both motility and secretion in the GI-tract. Serotonin or 5-hydroxytryptamine (5-HT) is synthesized and stored in mucosal EEC, so-called enterochromaffin cells, and is released when there is a chemical or mechanical stimulus. 5-HT then has a role in motility of the gut and activates spinal afferents [Citation13]. Chromogranin A (CgA), a common marker for EEC [Citation14], is a granin secreted from secretory granules of all the different types of EEC [Citation15] and has a role in the release of peptide hormones from EEC and intracellular calcium balance.
The number of EEC in the mucosa of patients with IBS has been analysed in several studies but results have varied. The majority of studies have found no difference between IBS and controls with regard to the number of EEC (reviewed in [Citation2]). There are several possible reasons for this. One reason for the differences may be the objectivity of the counting method of cells. Previous studies have analysed cells per crypt [Citation4,Citation16] or numbers of EEC per 100 epithelial cells [Citation5] but the majority of studies have counted cells per high power field (hpf). There are difficulties with all three of these techniques: analysing per crypt will only report the cells that are located in the crypts while ignoring cells in villi and epithelium; analysing per 100 epithelial cells is a good method if the biopsy is oriented so the sections have one epithelial lining but this is difficult to obtain in routine clinical work; counting cells per hpf may give a selection bias and the field of analysis may contain non-relevant areas that are not mucosal, leading to an underestimation of the number of positive cells. The primary aim of this study was to develop a more objective morphometric method for the assessment of EEC and to find out if there are any differences between patients with IBS and healthy controls. We used biopsies from the jejunum since this part of the gut has been less explored than other areas of the GI-tract in IBS patients.
Methods
IBS-patients were recruited between January 2007 through December 2011 from the outpatient clinic of the Department of Gastroenterology at Karolinska University Hospital, Huddinge. Biopsies from 51 patients were stained for CgA and 48 for 5-HT. All patients fulfilled the Rome-II criteria for IBS. Rome-II was used since the Swedish version of this set of criteria was available during recruitment of the cohort. Exclusion criteria were pregnancy, severe concomitant disease, current infection, gastrointestinal co-morbidities including inflammatory bowel disease and the lack of informed consent.
Healthy controls (HC) were recruited from staff and by advertisements in the nearby community. The HC had no gastrointestinal symptoms and did not fulfil any of the Rome-II defined diagnoses. Exclusion criteria were pregnancy, severe concomitant disease, any GI disease, current infection, and the lack of informed consent. We included 35 HC in the study.
Mucosal biopsy
Biopsies from patients and HC were taken from the upper jejunum with the help of a Watson capsule according to the method described by Ross et al. [Citation17]. The position of the capsule was identified via fluoroscopy (Ziehm, Exposcop 8000 C-arm, Germany). The biopsies were formalin fixed and then paraffin embedded at the Department of Pathology, Karolinska University Laboratory where the biopsies were sectioned (4 μm sections) and immunostained using standardized and validated techniques.
Immunohistochemistry
The sections were stained with monoclonal mouse anti-human CgA antibodies (Novocastra, UK) with dilution 1:100 for CgA and monoclonal mouse anti-human antibodies (Dako, Glostrup, Denmark), dilution 1:300, for the identification of 5-HT containing cells in the Department of Pathology, Karolinska University Hospital, Huddinge according to routine immunohistochemistry methods.
Cell counting
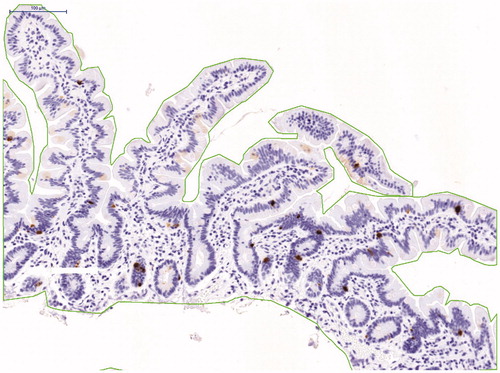
All biopsies were analysed initially by a pathologist as part of the routine. The slides were then scanned with a digital microscope scanner Pannoramic MIDI (3 D Histech Ltd., Budapest Hungary) where the whole biopsy section was scanned. The biopsy slides were then viewed in the software Pannoramic Viewer (3 D Histech Ltd., Budapest Hungary) where the mucosa of the section, which was area of interest, was marked via the software at an objective magnification of 20×. The cells were considered positive if they were located in the epithelium of the villi or crypts and if they had the shape of an enteroendocrine cell. The number of CgA and 5-HT positive cells was counted per mm2 of mucosa area and the visual field of 20× (area 0,58 mm2), here we call it per high power field (hpf) in order to compare the two methods (). The slides were coded upon analysis and the identity of cases was unknown. An experienced pathologist reviewed the counting of cells.
Figure 1. Example of a visual field with marked area of interest.
Statistics
Descriptive statistics were used for demographics of the patient material. After a power calculation with expected difference of 20% and a power of 80%, and with a 75% chance of a standard deviation of ±1, at least 35 participants were needed in each group.
Since the data followed a normal distribution Student’s unpaired t-test was used for comparisonsbetween groups. Statistical significance was acceptedfor p < .05.
Bland–Altman method [Citation18] was used forthe comparison of the two methods of counting per area of mm2 and per hpf.
Ethical consideration
The study was approved by the Regional Ethical Board in Stockholm (Stockholm 2006/398-31-2 and 2009/2154-31/1) and followed the ethical guidelines of the Helsinki declaration. Oral and written informed consent was obtained from all study participants.
Results
Biopsies from 48 patients with IBS were stained for 5-HT and 51 for CgA. In the 5-HT group one patient was excluded because the biopsy had been taken from duodenum and another patient was excluded because when re-evaluating her medical history, she had celiac disease in remission. In the CgA group one patient was excluded because the biopsy was taken from duodenum.
Hence, in total 46 patients (34 women) were analysed for 5-HT and 50 patients (39 women) for CgA. Median age at biopsy-taking for these patients was 36,5 (range 18–69) and 34 (range 18–66) years respectively. In the 5-HT group there were 20 patients with IBS-D, 8 with IBS-C and 18 with IBS-A.In the CgA group there were 22 with IBS-D, 12 with IBS-C and 16 with IBS-A.
Among the HC, 35 were stained for 5-HT and 35 for CgA. In the 5-HT group two HC were excluded and in the CgA group one was excluded because of bad biopsy quality. So, in total 33 (23 women) were included as controls in the 5-HT group and 34 in (27 women) in the CgA group. The median age at biopsy taking was 34 (range 20–60) years in 5-HT controls and 29 (range 19–57) years in CgA controls.
Histopathology
All patients and HC had normal histology. There was no linear hyperplasia. The majority of the 5-HT and CgA positive cells were detected in the crypt epithelium and a few at the surface epithelium of the villi. No immunopositive cell was detected in lamina propria.
Comparison between methods
The method of counting cells per area (mm2) of mucosa and cells per hpf × 20 correlated with each other giving an r = 0.91 for 5-HT and r = 0.72 for CgA.
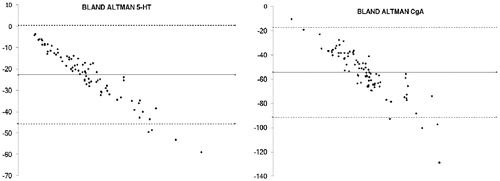
To analyse the agreement of the two-methods, Bland–Altman analysis was used. Bland–Altman analyses the bias of the mean difference of two different methods and estimates the agreement interval. In this study counting per area of interest measured on average 54,5 cells more than cells per hpf for CgA and 22,7 cells more for 5-HT.
The Bland Altman plot () showed that a higher number of cells were identified with the method counting per mm2 mucosal area of interest, showing a mean difference that was proportional to the magnitude of the measurement and there was a systematic underestimation of immunopositive cells when counting per hpf.
Figure 2. Bland–Altman plots comparing the two methods of counting 5-HT and CgA positive cells per mm2 mucosal area of interest and hpf. Lines showing mean and confidence interval of the mean.
Serotonin positive cells in jejunum
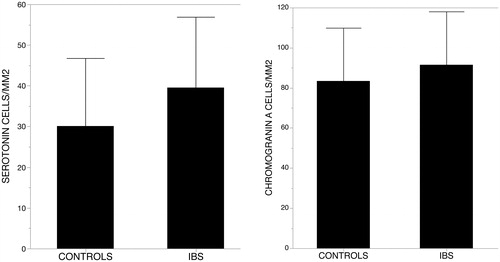
There was no difference in the number of 5-HT positive cells per area or per hpf between patients with IBS and HC (39.3 vs 33.5/mm2; p = .18) (). When looking into the subtypes, there was a trend of increased numbers of 5-HT positive cells in patients with IBS-A compared to HC, but no significant difference could be seen in any of the methods. No significant difference could be seen comparing the other subtypes of IBS-C and IBS-D.
Figure 3. Numbers of positive 5-HT and CgA per mm2 in jejunal mucosa of controls and IBS. No significant difference in number of cells was found between the groups. (Results presented as mean ± SD).
Chromogranin A positive cells in jejunum
There was no difference in the number of CgA positive cells in patients with IBS compared to HC (mean 91.5 and 84.9/mm2; p = .29) (). There was a trend towards a higher number of CgA positive cells in patients with IBS-A when counting per mm2 but no significant increase. We found no difference in the number of CgA positive cells in the other subtypes compared to HC in both methods.
Higher number of chromogranin A than serotonin positive cells in jejunum
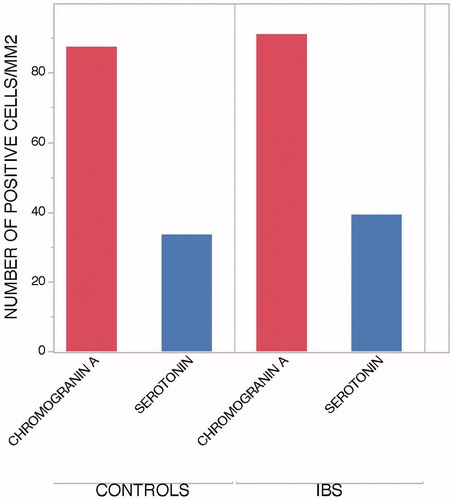
When comparing numbers of CgA and 5-HT, the participants had a higher number of CgA both per mm2 and per hpf. This difference was seen in both healthy volunteers and IBS patients ().
Figure 4. Higher numbers of positive CgA per mm2 of jejunal mucosa of controls and IBS patients compared to 5-HT. (Results presented as mean number of positive cells/mm2).
Comparison between men and women
A post hoc analysis shows that there was no difference in the number of 5-HT and CgA positive cells between men and women in healthy volunteers or between patients with IBS. Men with IBS had a significantly higher number of 5-HT expressing cells compared to healthy men (41.1 (±12.6); 25.0 (±11.2) p-value .005). There was no difference in the number of CgA positive and 5-HT positive cells in women with IBS and healthy women.
Discussion
Our study did not show any differences in the number of serotonin and chromogranin A expressing EEC in the jejunum of patients with IBS, including between IBS subgroups, and healthy participants. This study is unique in two ways; one is the methodology used and the other is that the we analyzed jejunal mucosa.
Enteroendocrine cells and their expression
EEC are important in gastrointestinal physiology. Since the number of EEC in the jejunum is less studied we wanted to evaluate if there would be a difference in patients with IBS compared to healthy controls. We studied CgA expressing cells since CgA is present in all EEC [Citation19,Citation20], and 5-HT expression since serotonin is thought to be involved in motility, visceral sensation and secretion of the gut [Citation14]. In our study, there were more CgA positive cells compared to 5-HT expressing cells. The proportion of 5-HT to CgA in healthy volunteers and patients with IBS was 39.5% and 43.0%, respectively. No previous study has compared the number of 5-HT and CgA in the jejunum in the same cohort before, however this finding was expected since serotonin is produced in enterochromaffin cells, but CgA is expressed in all EEC and is considered to be a general marker for EEC [Citation14]. Sjölund et al. could in 1983 [Citation21] in a large evaluation of the GI-tract demonstrate that 240 out of 820 total EEC cells in the jejunum expressed serotonin, that is 29%. Although the jejunum mucosa was not stained for chromogranin A in that study, the results are similar to our findings.
Numbers of enteroendocrine cells in IBS and healthy volunteers
In our study, we could reject the hypothesis that there would be higher numbers of EEC in patients with IBS. We did not find any difference in the number of 5-HT or CgA positive EECs in the jejunum of patients with IBS compared to healthy volunteers. Our findings support the morphometry results of Wang et al. [Citation22], who analysed serotonin producing cells and mucosal serotonin levels in the duodenum, jejunum and terminal ileum. In the jejunum, the EEC mean number was 6.2 and 6.6 per high power field for patients with IBS-D and IBS-C respectively and no significant difference was found in comparison with healthy controls.
The majority of studies reporting on the number of EEC in the duodenum have found no difference between patients with IBS and healthy controls [Citation2] but El-Salhy et al. showed that the density of CgA positive cells [Citation23] and CCK and secretin positive cells [Citation24] in the duodenum were reduced in patients with IBS. The serotonin cell density in duodenum in the same study was unaffected showing mean numbers of serotonin positive cells in controls of 36,4/mm2, which is close to the numbers of serotonin cells in the controls in our cohort (33,5/mm2). For the IBS patients’ the mean number of serotonin positive cells was 40,6/mm2 which is also close to the number of serotonin cells in our study (39,3/mm2). Although we have analysed jejunum mucosa, jejunum and duodenum are close to each other and might reflect similar cell numbers.
In a post-hoc analysis of our cohort, we found that males with IBS had a larger number of 5-HT-positive EEC compared to male controls. This analysis included only 12 patients and 10 healthy controls and it is difficult to draw conclusions from such a small group of patients. However, it is an interesting and novel finding since an increase of serotonin density in men with IBS has not been reported before. Studies on men with IBS are limited and this finding needs confirmation from future studies involving larger numbers of men with IBS.
Comparison of counting methods
Another major reason for discrepancies in results from other studies might be methodological differences. Since previous studies have used different methods for counting EEC it is also difficult to compare the actual number of EEC in different studies.
In the present study, we used two different methods of morphometry for counting immunopositive cells: one was the common way of counting cells per hpf ×20 taken with the digital scanner; the other was counting cells per defined surface area of mucosa. With the help of Bland–Altman plots we could see that counting per hpf led to a systematic underestimation of the number of cells compared to counts from defined surface areas. This difference is expected since large areas of a hpf ×20 do not include mucosa. It means that when only counting in a high power field you will count cells in tissue that is not mucosa, and therefore less cells will be found compared to counting cells per mucosal area. Another possible weakness of counting cells per hpf is that the choice of high power fields can easily become biased since it is difficult to randomly choose an area of interest and there is also a risk of excluding parts that may be important when comparing results and creating reference values. When counting cells per area of interest the whole available area of interest is analysed and this makes the counting more standardized and less biased. For the analysis, we used a digital scanner that enabled analysis of the whole biopsy section in a fast and easy way. It is a user-friendly method that is implementable for the clinical routine in the future. Digital scanners have been validated [Citation25] and are used in many research fields and we think their use in gastrointestinal research should be encouraged. Analysing cells with a digital method will open up a new and faster way to analyse and also to digitally save the biopsy. One limitation of digital scanning is that a digital scanner is not yet available in all pathology laboratories.
We used a Watson capsule for biopsytaking of the jejunum instead of the smaller endoscopic biopsies used in many other studies. This method is less invasive for the study participants, the quality of the biopsy is very good and gives a larger mucosa area to analyse compared to endoscopic biopsies. The weaknesses with the Watson capsule is that the mucosa is not macroscopically visualised at the time of biopsy taking, it could take long time to get the biopsies and fluoroscopy is needed to visualise the position of the capsule in jejunum before taking the biopsy.
Weaknesses of the study
Being a heterogeneous disease, one could expect that patients with IBS in general also would display discrepancies in the results. Since there is no objective method besides the clinical symptoms to group patients, different studies may show different results. Another important factor is the gastrointestinal mucosa and its function in disease and in health. The way people live, eat and what medications they take may affect the mucosa in ways we still don’t understand. One weakness of this study is that information about what food and over-the-counter drugs the study participants were taking at the time of biopsy taking is lacking. In future studies information about dietary conditions and non-prescription drugs should be sought after.
We grouped patients according to stool form subtype and could not find any significant differences in the IBS subtypes, however the sample size is small for draw any larger conclusions for the IBS-subtypes. Although the power analysis would be stronger if the number of study participants would be more, the size of our study was similar to many previously published studies and the aim of our study was to identify if there would be any difference between IBS in general and healthy controls. At the time of collection of the cohort Rome-II criteria was used, which makes the study comparable to the research of that time. However, if patients would be recruited according to Rome-IV criteria, another outcome could be found, further studies are needed to identify this.
In summary, we used a novel and more objective method for counting immunostained EEC and we found no difference between patients with IBS and healthy controls regarding the number of chromogranin-A-positive or serotonin-positive EEC in the jejunum. The number of chromogranin-A-positive cells was higher than the number of serotonin-positive cells in jejunum mucosa. Further studies are needed however to evaluate these results, preferably using methods that better relate to the function of EEC in jejunum.
Acknowledgements
The authors thank Professor Eva Hellström Lindberg for access to the digital scanner at Center for Haematology and Regenerative Medicine (HERM), Karolinska Institutet and all staff at HERM for introduction to the scanner and their help. The authors also thank the Department of Pathology, Karolinska University Hospital, for providing the biopsy material.
Disclosure statement
The authors declare no conflict of interest.
References
- Thompson WG. The road to Rome. Gastroenterology. 2006;130(5):1552–1556.
- Nasser Y, Boeckxstaens GE, Wouters MM, et al. Using human intestinal biopsies to study the pathogenesis of irritable bowel syndrome. Neurogastroenterol Motil. 2014;26(4):455–469.
- Kyosola K, Penttila O, Salaspuro M. Rectal mucosal adrenergic innervation and enterochromaffin cells in ulcerative colitis and irritable colon. Scand J Gastroenterol. 1977;12(3):363–367.
- Verity MA, Mellinkoff SM, Frankland M, et al. Serotonin content and argentaffin and Paneth cell changes in ulcerative colitis. Gastroenterology. 1962;43(1):24–31.
- Spiller RC. Increased rectal mucosal enteroendocrine cells, T lymphocytes, and increased gut permeability following acute Campylobacter enteritis and in post-dysenteric irritable bowel syndrome. Gut. 2000;47(6):804–811.
- Lee KJ, Kim YB, Kim JH, et al. The alteration of enterochromaffin cell, mast cell, and lamina propria T lymphocyte numbers in irritable bowel syndrome and its relationship with psychological factors. J Gastroenterol Hepatol. 2008;23(11):1689–1694.
- Park jh, Rhee p-l, Kim g, et al. Enteroendocrine cell counts correlate with visceral hypersensitivity in patients with diarrhoea-predominant irritable bowel syndrome. Neurogastroenterol Motil. 2006;18(7):539–546.
- Rogers J, Henry MM, Misiewicz JJ. Increased segmental activity and intraluminal pressures in the sigmoid colon of patients with the irritable bowel syndrome. Gut. 1989;30(5):634–641.
- Evans PR, Bak Y-T, Shuter B, et al. Gastroparesis and small bowel dysmotility in irritable bowel syndrome. Dig Dis Sci. 1997;42(10):2087–2093.
- Caballero-Plasencia AM, Valenzuela-Barranco M, Herrerías-Gutiérrez JM, et al. Altered gastric emptying in patients with irritable bowel syndrome. Eur J Nucl Med. 1999;26(4):404–409.
- Kellow JE, Phillips SF, Miller LJ, et al. Dysmotility of the small intestine in irritable bowel syndrome. Gut. 1988;29(9):1236–1243.
- Schmidt T, Hackelsberger N, Widmer R, et al. Ambulatory 24-hour jejunal motility in diarrhea-predominant irritable bowel syndrome. Scand J Gastroenterol. 1996;31(6):581–589.
- Grundy D. What activates visceral afferents? Gut. 2004;53(90002):5ii–5i8.
- Gunawardene AR, Corfe BM, Staton CA. Classification and functions of enteroendocrine cells of the lower gastrointestinal tract. Int J Exp Pathol. 2011;92(4):219–231.
- Rindi G, Leiter AB, Kopin AS, et al. The “normal” endocrine cell of the gut: changing concepts and new evidences. Ann N Y Acad Sci. 2004;1014(1):1–12.
- Ahonen A, Kyosola K, Penttila O. Enterochromaffin cells in macrophages in ulcerative colitis and irritable colon. Ann Clin Res. 1976;8(1):1–7.
- Ross JR, Moore VA. Small intestinal biopsy capsule utilizing hydrostatic and suction principles. Gastroenterology. 1961;40(1):113–119.
- Bland JM, Altman DG. Statistical methods for assessing agreement between two methods of clinical measurement. Lancet. 1986;327(8476):307–310.
- Facer P, Bishop AE, Lloyd RV, et al. Chromogranin: a newly recognized marker for endocrine cells of the human gastrointestinal tract. Gastroenterology. 1985;89(6):1366–1373.
- Portela-Gomes GM, Stridsberg M. Chromogranin A in the human gastrointestinal tract: an immunocytochemical study with region-specific antibodies. J Histochem Cytochem. 2002;50(11):1487–1492.
- Sjolund K, et al. Endocrine cells in human intestine: an immunocytochemical study. Gastroenterology. 1983;85(5):1120–1130.
- Wang S-H, Dong L, Luo J-Y, et al. Decreased expression of serotonin in the jejunum and increased numbers of mast cells in the terminal ileum in patients with irritable bowel syndrome. WJG. 2007;13(45):6041–6047.
- El-Salhy M, Gilja OH, Gundersen D, et al. Duodenal chromogranin a cell density as a biomarker for the diagnosis of irritable bowel syndrome. Gastroenterol Res Pract. 2014; 2014:1–8.
- El-Salhy M, Vaali K, Dizdar V, et al. Abnormal small-intestinal endocrine cells in patients with irritable bowel syndrome. Dig Dis Sci. 2010;55(12):3508–3513.
- Gilbertson JR, Ho J, Anthony L, et al. Primary histologic diagnosis using automated whole slide imaging: a validation study. BMC Clin Pathol. 2006;6(1):4.