
Abstract
Method
We examined faecal samples, using the GA-map™ Dysbiosis Test, to associate gut microbiota composition with Crohn’s disease (CD) and ulcerative colitis (UC) and to identify markers for future biomarker identification. We conducted a prospective case-control study (EU-ref. no. 305676) in an inception cohort of 324 individuals (64 CD, 84 UC, 116 symptomatic non-IBD controls and 44 healthy controls) across five European centres and examined 54 predetermined bacterial markers. We categorized patients according to the Montreal Classification and calculated the dysbiosis index (DI). Non-parametric tests were used to compare groups and the Bonferroni correction to adjust for multiple comparisons.
Results
The fluorescent signals (FSSs) for Firmicutes and Eubacterium hallii were lower in inflammatory bowel disease (IBD) vs. symptomatic controls (p<.05). FSS for Firmicutes, Lachnospiraceae, Eubacterium hallii and Ruminococcus albus/bromii were lower, whereas the signal for Bacteroides Fragilis was higher in UC vs. symptomatic controls (p<.05). FSS was higher for Bifidobacterium spp., Eubacterium hallii, Actinobacteria and Firmicutes among patients with ulcerative proctitis, compared to extensive colitis (p<.05). In CD, we observed no association with disease location. The DI correlated with faecal-calprotectin in both CD and in UC (p<.001). In terms of treatment escalation and anti-TNF response, differences were observed for some bacterial markers, but none of these associations were statistically significant.
Conclusion
Our data reveal that the GA-map™ Dysbiosis Test holds the potential to characterize the faecal microbiota composition and to assess the degree of dysbiosis in new-onset IBD. On the other hand, our results cannot demonstrate any proven diagnostic or predictive value of this method to support clinical decision making.
Introduction
Inflammatory bowel disease (IBD), comprising the predominant forms Crohn’s disease (CD) and ulcerative colitis (UC), is a complex disease, characterized by a chronic inflammation in the gastrointestinal tract. The inflammation seems to arise due to a dysregulated immune response to gut microbiota in genetically susceptible individuals [Citation1,Citation2]. However, the complex interactions between gut microbiota and the host are still poorly understood and the precise pathophysiology of IBD is yet to be determined.
Clinically, IBD represents a heterogeneous disorder with a wide variety of clinical presentations and manifestations at diagnosis. The subsequent disease course may vary from an indolent disease to a severe course, refractory to medical treatment and with need of repeated surgery. Patients with an aggressive course are at increased risk of disease complications and morbidity [Citation3]. As a result of the clinical heterogeneity, efforts have been made to identity prognostic biomarkers of future disease course. Most previous studies have defined the severity of the disease course, based on the need of surgery or advanced therapies, such as biological agents during follow-up [Citation4]. Both in CD and in UC clinical factors as age, disease location and behavior, have been demonstrated to predict clinical outcome [Citation3,Citation5–7]. More recently, studies utilising -omic technologies have identified molecular markers of prognostic potential [Citation8–10].
To tailor treatment in IBD, there has been a great focus on the identification of predictors of response to specific treatments such as anti-TNF. A number of clinical variables, including age, body mass index, smoking and concurrent use of immunomodulators, have been identified as potential predictive biomarkers of anti-TNF response [Citation11–13]. However, previous data are inconsistent, and few clinical variables are used as predictors of individual therapies in clinical practice. To guide clinical decision-making, objective tools to categorize patients, predict disease course and treatment response, are needed [Citation14]. The gut microbiota is of great interest in this respect, since its composition is believed to play a central role in the initiation and propagation of the gastrointestinal inflammation [Citation15,Citation16]. Driven by technology improvements and the establishment of next-generation sequencing platforms, significant progress has also been achieved with respect to our possibility to characterize the microbiota. Features of gut microbiota composition, including the degree of dysbiosis, have been associated with various subtypes of IBD, including phenotypes of CD [Citation17]. However, the extent to which the clinical heterogeneity of IBD is explained by differences in gut microbiota composition is largely unknown, since most previous studies have examined prevalent patients with long-standing disease, where results may be explained by differences in previous treatments and disease history. Attempts to identify predictive biomarkers of disease course and response to individual therapies based on microbiota signatures have shown diverging results [Citation18–20]. In the present study, we assessed the faecal microbiota composition and dysbiosis by the GA-map™ Dysbiosis Test, a kit designed to separate patient groups and healthy individuals based on their bacterial profile of the faecal microbiota [Citation21].
We examined newly diagnosed IBD patients and healthy controls, and the primary aim was to identify faecal microbiota signatures associated with IBD and their phenotypes. The secondary aim was to identify faecal microbiota signatures associated with future disease course and treatment response.
Materials and methods
Study design
This is a prospective, multi-centre case-control study, where patients with newly confirmed IBD, symptomatic controls without IBD (non-IBD) and healthy controls, without any history of chronic gastrointestinal disease, were recruited across five European gastrointestinal clinics, as part of the ‘Inflammatory Bowel Disease CHARACTERization by a multi-modal integrated biomarker study’ (IBD-Character, reference no. 305676) [Citation22].
Study population
Patients, 18–70 years of age, referred to the gastroenterological unit at five European hospitals, between May 2012 and September 2015, for suspected IBD, were invited to take part in the study. Presence of gastrointestinal symptoms, such as diarrhoea, abdominal pain and blood or mucus in stool for >2 weeks, indicative of IBD, was an inclusion criterion. Exclusion criteria were antibiotic use within 30 days prior to baseline, gastrointestinal infections and other gastrointestinal inflammatory diseases. The diagnosis of IBD was established according to internationally accepted criteria, following thorough clinical, microbiological, endoscopic, histological and radiological evaluation [Citation23]. We used the Montreal classification to categorize the phenotypes of CD, UC and IBD-U [Citation24,Citation25]. To assess clinical activity, the Harvey-Bradshaw Index (HBI) was used for CD and the simple clinical colitis activity index (SCCAI), as well as the partial Mayo score for UC. Individuals with gastrointestinal symptoms, with no endoscopic or histological signs of inflammation at inclusion, and no discernible evidence of IBD during follow-up, were classified as symptomatic non-IBD controls. To exclude other inflammatory or infectious disease in the symptomatic non-IBD patients, further investigations were done on clinical indication. In non-IBD cases with persisting symptoms 1–2 months after inclusion, a follow-up f-calprotectin was assessed. MRI and capsule-endoscopy were performed on selected cases with high f-calprotectin. Upper endoscopy was performed on clinical indication to exclude IBD and other organic disease.
Treatment-naivety within the IBD cohort was defined as no exposure to any IBD related medical therapies such as 5-ASA, corticosteroids, immunomodulators and biologics. In addition, we included healthy controls, without any history of chronic gastrointestinal symptoms (). Healthy controls were not matched for age or sex, and they were recruited from the two Swedish centers.
Table 1. Demographic data, smoking status, clinical indices, biochemical and faecal markers, and phenotypes according to the Montreal classification.
Clinical course of IBD
Clinical outcome data were collected from the medical records for patients with IBD. We classified the disease course as mild or severe based on the need of treatment escalation (). A severe disease course was defined as treatment escalation to a biologic agent, cyclosporine or surgery, introduced for a disease flare or disease refractory to primary treatment.
Table 2. Escalation to anti TNF or cyA and/or surgery.
Predicting remission from anti-TNF therapy
For descriptive purposes, we also evaluated response to anti-TNF treatment, among patients with IBD who were treated with an anti-TNF agent during follow-up. Remission was assessed at 14 weeks after initiation of anti-TNF treatment (Supplementary Figure 1). For CD, remission was defined as HBI ≤3 points, CRP ≤3 mg/l and no concomitant corticosteroid use [Citation12,Citation26,Citation27]. For UC, remission was defined as partial Mayo score ≤1, no concomitant steroid use and at least one of the following criteria: (I) faecal calprotectin (f-calprotectin) <250 mg/kg, (II) CRP ≤3 mg/l and (III) an endoscopic Mayo subscore ≤1 [Citation19,Citation27].
Faecal calprotectin
f-Calprotectin was extracted and analysed with ELISA in a single batch at the end of recruitment, according to the manufacturer’s protocol (BÜHLMANN fCAL™, Schönenbuch, Switzerland) [Citation28].
GA-map™ Dysbiosis Test
Faecal samples were collected in screw-capped plastic containers within two days prior to inclusion, kept at room temperature for ≤2 days before being brought to the clinical centre and stored in –20 °C, until shipment on dry ice to Genetic Analysis. Bacterial DNA was extracted and processed through 16S PCR [Citation29]. The test measures relative bacterial abundance based on the fluorescent signal (FSS) strength of 54 predetermined bacterial DNA markers targeting variable regions of V3 to V9 of the bacterial 16S rRNA gene (Supplementary Figure 2), giving a dysbiosis index (DI); range 1–5. The index gives information on the degree of deviation of the gut microbiota composition in the test sample compared to a healthy population [Citation21,Citation29]. The bacterial markers were selected based on previous literature, and 165 healthy individuals were used to develop a dysbiosis model and DI score output. The representation of pathobionts is correlated to increasing DI, whereas bacteria affiliated with anti-inflammatory properties decrease the DI. The method was further validated, when 330 samples were analysed and demonstrated dysbiosis in 70% of treatment naïve IBD, 80% of IBD in remission, 73% in IBS and only 16% among healthy individuals [Citation21]. All samples were analysed in a single batch and lab-technicians were blinded for clinical data.
Statistical analyses
Continuous variables, representing clinical characteristics, are presented as median and range, and categorical data are presented as frequencies. Only markers with a detectable level in ≥10% of the samples were included in the analyses. The DI was calculated based on the GA-map® algorithm [Citation21]. Normalized signal levels of each bacterial marker were used for univariable comparisons. To account for multiple comparisons, p values were adjusted using Bonferroni’s correction approach with adjusted p value reported. Principal component analyses (PCAs) plots of log-transformed data were performed and score-plots were visually inspected to identify possible differences between groups. Analysis of similarities was calculated based on the two first PCA axis with 1000 permutations and p value describing the differences between groups reported. To compare differences between groups univariably, we used the Kruskal–Wallis rank sum test and the Wilcoxon rank sum test. In the comparison between single bacterial markers, all results with a Bonferroni adjusted p value were reported together with a non-adjusted p value <.05. A heatmap was visualising hierarchical cluster analysis based on Euclidian distance, here each bacterial marker was normalized by extracting the median of the normal population, scaling the variance to 1 and truncating extreme values to −2 and 2. In the heatmap, blue indicates lower signal than the median of the normal population while red indicates higher signal. Statistical analyses and data processing were performed in R version 3.6.3 (R Foundation for Statistical Computing, Vienna, Austria) [Citation30].
Ethics
The study was conducted with informed consent and ethical approval, in accordance with the Helsinki declaration. The study has approval by Committees for Medical Research Ethics in all countries.
Results
Altogether, 432 individuals provided a faecal sample at inclusion. We excluded unfit samples (Supplementary Figure 3). Clinical demographics of the final study cohort (N = 324) are shown in . Among the 164 IBD patients, 117 were treatment-naive and 47 were exposed to IBD-related medical therapies (topical or systemic 5-ASA, N = 20; topical or systemic corticosteroids, N = 37; azathioprine (AZA), N = 3; anti-TNF N = 1) during the last six months before inclusion. The mean duration from diagnosis to inclusion in the study was 16 days.
Microbial composition among IBD patients, symptomatic controls and healthy controls
We compared the microbial composition of samples from IBD patients, symptomatic non-IBD controls and healthy controls. Samples from IBD patients grouped closer to samples from symptomatic non-IBD controls than to samples from healthy controls. Further, samples from the healthy controls were more similar to each other, grouped closer together, than samples from the IBD and non-IBD samples, respectively. Anosim p value was non-significant (). The gut microbiota composition of treatment-naive IBD patients was compared to the composition of IBD patients who had been exposed to IBD-related drugs. No significant difference was observed between the two groups (Supplementary Figure 4) and the samples from treated and treatment-naive IBD patients were, therefore, analysed together as one group.
Figure 1. (A) PCA of log transformed and scaled fluorescent signal strength, microbiota composition separating diagnostic groups (IBD, non-IBD and healthy controls). The variation of all samples explained by each axis is given in breaks in the axis label. Ellipsoids are made to include 90% of the data in one group. Anosim p value (the largest difference between two groups) in upper left corner. (B) Bacterial markers separating the diagnostic groups. Median is plotted as a thick line, 50% of the data visualized as a box from the 25% to the 75% quantile, whiskers indicate min and max, or min and max assuming that the data are normally distributed, while outliers are marked with circles. Non-adjusted p value is given in the upper left corner. Bonferroni’s adjusted p value is given in upper right corner.
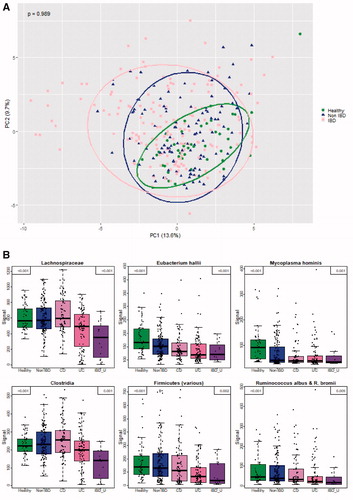
When comparing the five diagnostic groups, the FSS for the markers detecting Lachnospiraceae, Mycoplasma hominis, Eubacterium hallii, Clostridia, Firmicutes and Ruminococcus albus/bromii significantly differed between CD, UC, IBD-U, symptomatic controls and healthy controls (adjusted p value <.05). The FSSs for Firmicutes and Eubacterium hallii were significantly lower (adjusted p value <.05) in samples from patients with IBD compared to symptomatic non-IBD controls. Further, there were significantly lower FSSs (adjusted p value <.05) for Lachnospiraceae and for Clostridia in UC compared to CD ().
When comparing samples from patients with UC and healthy controls, the FSSs for Mycoplasma hominis, Eubacterium hallii, Firmicutes and Ruminococcus albus/R. bromii were lower (adjusted p value <.05) in UC samples, while the signals for Shigella spp., Escherichia spp. and Streptococcus spp. 2 were higher (adjusted p value <.05) (Supplementary Figure 5(A)). Correspondingly, the FSSs for Mycoplasma hominis, Eubacterium hallii and Faecalibacterium prausnitzii were lower (adjusted p value <.05) and the signal for Ruminococcus gnavus was higher (adjusted p value <.05) when samples from CD patients were compared to those from healthy controls (Supplementary Figure 5(B)).
When comparing samples from patients with UC and symptomatic non-IBD controls, the FSSs for the markers detecting Firmicutes, Lachnospiraceae, Eubacterium hallii and Ruminococcus albus/bromii were lower (adjusted p value <.05) in UC, whereas the signal for Bacteroides fragilis was higher (adjusted p value=.04) (Supplementary Figure 6(A)). No significant differences were observed between the patients with CD and symptomatic non-IBD controls with respect to FSSs (Supplementary Figure 6(B)).
Microbial composition in different phenotypes of UC and CD
In order to examine if there is an association between microbial composition and phenotypes of UC, samples from patients with extensive colitis (E3), left-sided colitis (E2), proctitis (E1) and healthy controls were compared. The microbial compositions of patients with extensive and left-sided colitis were more similar, and differed from the composition of patients with proctitis and healthy controls (p=.001) (). The FSS for Bifidobacterium spp., Eubacterium hallii, Actinobacteria and Firmicutes was significantly lower in patients with extensive/left-sided colitis compared to patients with proctitis (adjusted p value <.05) ().
Figure 2. (A) PCA of log transformed and scaled fluorescent signal strength for microbiota composition separating UC phenotypes. Anosim p value (the largest difference between two groups) in upper left corner. (B) Bacterial markers separating UC phenotypes [Citation24]. (C) PCA of log transformed and scaled fluorescent signal strength for microbiota composition separating CD phenotypes. Anosim p value (the largest difference between 2 groups) in upper left corner. Anosim p value=.287 for CD phenotypes.
![Figure 2. (A) PCA of log transformed and scaled fluorescent signal strength for microbiota composition separating UC phenotypes. Anosim p value (the largest difference between two groups) in upper left corner. (B) Bacterial markers separating UC phenotypes [Citation24]. (C) PCA of log transformed and scaled fluorescent signal strength for microbiota composition separating CD phenotypes. Anosim p value (the largest difference between 2 groups) in upper left corner. Anosim p value=.287 for CD phenotypes.](/cms/asset/60d167d3-598d-40e5-8d67-8a6d1efc7a65/igas_a_1803396_f0002_c.jpg)
In contrast to the difference in microbial composition across different phenotypes of UC, we did not observe any difference when samples from patients with ileal (L1), colonic (L2), ileocolonic (L3) CD and healthy controls were compared. In fact, the microbial composition of CD patients with various disease locations largely overlapped (anosim p=.287). On the other hand, they significantly differed from the healthy controls (p=.001) (). Numerically higher FSS strength was observed for some bacterial markers, but none of these associations were statistically significant (Supplementary Figure 7).
Unsupervised cluster analyses
A heatmap with all the 54 bacterial markers demonstrates the complexity of the gut microbiota without recognizing distinct clusters regarding diagnosis, phenotype or f-calprotectin (Supplementary Figure 8).
Correlation between dysbiosis index and inflammatory activity
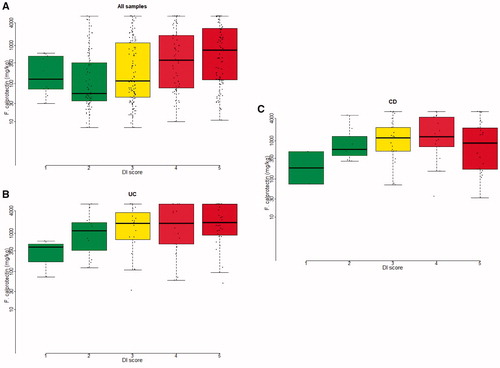
To examine the correlation between degree of dysbiosis and inflammatory activity, we correlated the DI with the concentration of f-calprotectin. When all samples from patients (IBD and symptomatic non-IBD) were analysed, the concentration of f-calprotectin increased with the degree of DI independent of diagnosis (). The correlation remained significant, when stratifying by diagnosis and analysing patients with UC (), CD () and symptomatic non-IBD (Supplementary Figure 9) separately (log linear regression, p<.001).
Figure 3. Log10 f-calprotectin (mg/kg) on vertical axis. Dysbiosis index score (DI) on horizontal axis. Dots are individual samples. (A) All samples. (B) UC samples and (C) CD samples. Linear regression between log10 f-calprotectin (mg/kg) as outcome and dysbiosis index (DI) score as dependent variable explained 75.6% (A), 87.3% (B) and 83.6% (C) of the variation in the observations (p<.001 for all three regressions).
The FSSs for the 54 bacterial markers are all influencing the DI. Supplementary Figure 10 demonstrates the association between every single bacterial marker and f-calprotectin. When focusing on some dominating phylae in the figure, a rise in Proteobacteria and a fall in Firmicutes associate to increasing f-calprotectin, even though no strong correlation between single bacterial markers and f-calprotectin can be found.
Microbial composition as predictor of disease course
Information on medical therapy and surgery during follow-up was available for 158/164 (96%) patients with IBD. In total, 41 patients (26%) required treatment escalation (anti-TNF treatment, N = 29; cyclosporine A treatment, N = 1 and surgery, N = 11).
Among patients who escalated therapy, high symptom scores were accompanied by endoscopic findings, increased f-calprotectin levels and/or increased CRP concentrations, whereas non-escalators had normal levels of clinical and biochemical markers.
We aimed for a minimum of 12 months follow-up after diagnosis, since most patient who experience treatment escalation, escalate within 12 months [Citation31]. In our cohort, 95% of the patients had a follow-up period of >12 months. Of those who escalated, 90% of the patients with UC and 86% of the patients with CD escalated within 1 year (Supplementary Figure 11). Among patients with UC, 20/84 (24%) experienced treatment escalation, whereas 21/68 (31%) patients with CD experienced treatment escalation. In UC, concentrations of CRP and f-calprotectin at inclusion were significantly higher among patients who escalated therapy compared to patients who did not escalate therapy during follow-up (p=.02 and p=.004, respectively). Correspondingly, the concentration of CRP at inclusion was significantly higher among patients with CD who eventually escalated (p=.005). The concentration of f-calprotectin at inclusion was only numerically higher among patients with CD who escalated (p=.11). However, the microbial composition at inclusion largely overlapped between escalators and non-escalators in both UC (Supplementary Figure 12) and CD (Supplementary Figure 14). No significant difference was observed between escalating patients and non-escalating patients when the FSSs for individual bacterial markers were compared, even though numerically different signals were observed for some bacterial markers in both UC and CD (Supplementary Figures 13 and 15).
Microbial composition as predictor of response to future anti-TNF treatment
Data on response to anti-TNF therapy 14 weeks after initiation of treatment, were available for 24/29 (83%) patients who were treated with an anti-TNF agent at some time during follow-up. Anti-TNF responders experienced a large drop in CRP, f-calprotectin and symptoms, in compliance with the definition of anti-TNF-induced remission (Supplementary Figure 16). Altogether, 3/9 (33%) patients with UC and 5/15 (33%) patients with CD achieved remission 14 weeks after the initiation of anti-TNF treatment. No significant difference was found in the overall gut microbiota composition or in specific bacterial markers between patients who achieved remission and those who did not achieve remission, even though numerically different FSS strengths were observed for some bacterial markers when comparing samples from remitters and non-remitters (Supplementary Figures 17–20).
Discussion
Using the GA-map™ Dysbiosis Test and faecal samples mostly collected prior to initiation of treatment in new-onset patients, we studied the gut microbiota composition in one of the largest adult IBD inception cohorts to date.
Numerous studies have reported alterations in the faecal microbiota of patients with established IBD [Citation17,Citation32–34]. Bacterial taxa as Eubacterium hallii [Citation35,Citation36] and Faecalibacterium prausnitzii [Citation18,Citation31,Citation37] have demonstrated properties promoting a healthy gut environment. On the other hand, taxa as Ruminococcus gnavus [Citation38] and Shigella spp. and Escherichia spp. [Citation39,Citation40], have been shown to act as pathobionts with pro-inflammatory and mucin-degrading capabilities. In accordance with previous literature [Citation19,Citation21,Citation41], we observed lower FSSs for Mycoplasma hominis, Eubacterium hallii, Firmicutes and Ruminococcus albus/R. bromii and higher FSSs for Shigella spp. and Escherichia spp., as well as Streptococcus spp. 2 in UC compared to healthy controls (Supplementary Figure 5(A)). When comparing CD and healthy controls, our findings also were in accordance with previous literature [Citation18,Citation42–44], with lower signals of markers detecting Mycoplasma hominis, Eubacterium hallii and Faecalibacterium prausnitzii, and higher signal for Ruminococcus gnavus in CD (Supplementary Figure 5(B)) already in this early disease state.
To examine the potential diagnostic capacity of the faecal microbiota, we compared IBD patients with symptomatic controls. Fluorescent signals for Firmicutes and Eubacterium hallii were significantly lower in samples from patients with new-onset IBD compared to symptomatic non-IBD controls (). However, it is doubtful if the assessment of dysbiosis with this method has diagnostic value applicable for clinical use, since established methods as f-calprotectin measurement have shown sovereign capabilities in IBD diagnostics [Citation45–47].
In UC, the FSSs for Firmicutes, Lachnospiraceae, Eubacterium hallii and Ruminococcus albus/bromii were lower, whereas the signal for Bacteroides fragilis was higher among patients with UC compared to symptomatic controls (Supplementary Figure 6(A)). Interestingly, Bacteroides fragilis holds anti-inflammatory properties [Citation48,Citation49], and an upregulation of Bacteroides fragilis observed in parallel with a downregulation of Ruminococcus in UC, could possibly demonstrate a response of the host microbiota cross-talk promoting intestinal homeostasis.
Between patients with CD and symptomatic controls, however, the microbiota composition largely overlapped, with non-significant differences among the bacterial markers (top hits in Supplementary Figure 6(B)). These findings elucidate the diagnostic potential of the faecal microbiota, and this potential to separate IBD from non-IBD in symptomatic patients seems to be especially strong in UC, and rather weak in CD. In contrast, earlier studies have found a diagnostic potential also in CD. It has been proposed that a group of eight microorganisms, including a decreased abundance of Faecalibacterium, an unknown Peptostreptococcaceae, Anaerostipes, Methanobrevibacter, an unknown Christensenellaceae, Collinsella and an increased abundance of Fusobacterium and Escherichia, could be used to differentiate stool samples of patients with CD from non-CD, i.e., healthy controls, patients with anorexia, IBS or UC(42). The extent to which these findings are causative or a consequence of disease history, various types of treatments and inflammation is largely unknown, since samples were obtained from patients with established disease. On the other hand, another study of treatment-naïve paediatric IBD has also demonstrated a diagnostic potential related to the gut microbiota, in CD [Citation50]. Gevers et al. examined faecal samples and mucosal biopsies obtained from a large inception cohort of treatment-naïve children with paediatric onset CD and children with non-inflammatory conditions. The authors identified a microbiota signature in mucosal biopsies that correlated strongly with disease status. In contrast to the discriminative capacity of rectal and ileal biopsies, the microbiome composition of faecal samples was less shifted towards a dysbiotic state and, thereby, far less discriminative [Citation50].
Notably, the faecal microbiota composition of symptomatic non-IBD patients shared similarities with the composition of patients with IBD (). Additionally, we found an association between DI and f-calprotectin in this group (Supplementary Figure 9). This could possibly indicate that the gut microbiota plays a role in several gastrointestinal diseases, since symptomatic non-IBD patients were represented by different gastrointestinal diagnoses, including IBS. This finding is to some extent supported by previous literature, where alterations in gut microbiota composition have been reported among other gastrointestinal diseases such as IBS [Citation21].
We compared the faecal microbiota of different phenotypes of UC and CD. In UC, the microbiota was more dysbiotic in extensive and left-sided disease compared to disease limited to the rectum (). This difference was mainly driven by lower FSSs for Bifidobacterium spp., Eubacterium hallii, Actinobacteria and Firmicutes in samples from patients with extensive disease, compared to samples from patients with proctitis (). The extent to which these findings reflect causative differences or are explained by possible differences in stool consistency [Citation51] and inflammatory activity [Citation19,Citation52,Citation53], can only be speculated on.
Previous studies have reported differences in gut microbiota between CD patients with different phenotypes. In general, a more pronounced dysbiosis has been observed in patients with ileal CD compared with patients with colonic disease [Citation54]. Our data indicate that these findings do not seem to be evident at diagnosis ( and Supplementary Figure 7) and suggest that these differences could be secondary to inflammation or treatment. Notably, we were not able to examine all dysbiosis-associated taxa, since our analyses were restricted to 54 pre-defined bacterial markers.
We observed a strong correlation between the degree of dysbiosis and the inflammatory activity, defined by f-calprotectin levels. This correlation between DI and f-calprotectin was independent of diagnosis, when samples from symptomatic individuals, both IBD and non-IBD, were analysed (). The correlation remained significant, when stratifying by diagnosis and analysing patients with UC () and CD () separately. The FSSs for the 54 bacterial markers are all influencing the DI. Supplementary figure 10 demonstrates the relation of every single bacterial marker to f-calprotectin level. When focusing on two well-known phylae among the 54 bacterial markers, Proteobacteria and Firmicutes, we demonstrate a rise in Proteobacteria and a fall in Firmicutes as f-calprotectin levels increase. These findings are consistent with the shown association between DI and f-calprotectin, as a rise in Proteobacteria and a fall in Firmicutes, enhances the DI. However, the correlation between single markers and f-calprotectin is weaker than the correlation of all signals together, elucidating the significance of calculation the DI when applying this method for faecal microbiota assessment.
Our findings indicate that alterations in the gut microbiota composition are present already at diagnosis, suggesting that changes in the gut microbiota occurred at an early disease phase, potentially even before diagnosis of adult-onset IBD and independent of medical therapy. Our data support previous studies which have examined the inflammatory activity in the context of specific taxa, rather than overall degree of dysbiosis. Even though a recent meta-analysis indicates that the decrease in Faecalibacterium prausnitzii seems to be most pronounced in patients with clinically active disease, few cross-sectional studies have demonstrated a correlation between abundance of specific bacterial taxa and inflammatory activity [Citation19,Citation53]. We have recently reported an inverse correlation between temporal changes in the relative abundance of Faecalibacterium prausnitzii and concentrations of f-calprotectin [Citation52]. Importantly, inflammation may translate into higher oxygen concentrations which may induce an environment that negatively affects obligate anaerobes and results in a diminished mucus layer [Citation55].
Finally, we explored the prognostic and predictive potential of the GA-map™ Dysbiosis Test to foresee treatment escalation and response to future anti-TNF treatment. The identification of prognostic biomarkers has been the aim of many studies, including our own parallel studies of glycomics, methylation and protein profiling [Citation9,Citation56,Citation57]. Lee et al. identified expression profiles of T cell exhaustion in CD8 T cells that predicted treatment escalation in IBD [Citation4], defining escalation as the need for ≥2 immunosuppressants and/or surgery after initial disease remission. We recognise that clinical decisions and timing on treatment escalations may vary across centres. We used more stringent criteria to define treatment escalation than previous studies, and included biological agents, cyclosporin A or surgery in the definition, rather than introduction of immunosuppression per se. Immunosuppressant as methotrexate and AZA was mainly used as co-medication to biologics in this cohort, but there is a substantial number of patients treated with AZA without experiencing further treatment escalation. Avoiding immunomodulators in the definition, could potentially add limitations to the study, as the AZA-treated patients also experience a more aggressive disease course than those treated with 5-ASA alone (UC), or a short period of GC, with further de-escalation of therapy. However, the fact that the proportion of patients experiencing treatment escalation to biologics, cyA and/or surgery was quite similar between the centres (22–29%), indicates that patients were treated according to rather similar principles across the five European centres.
Several bacterial markers showed numerically lower FSSs among UC patients who escalated therapy compared to those who remained on their initial treatment during follow-up (Supplementary Figure 13). This might reflect a less rich and diverse gut microbiota already at diagnosis of UC among patients with a poor prognosis. Prognostic clinical variables such as extensive disease and possibly inflammatory activity [Citation7] may have influenced our results. An explanation for this might be that patients with a severe disease course more often were diagnosed with extensive colitis, and had higher concentrations of CRP and f-calprotectin compared to those who experienced an indolent disease course, without need of treatment escalation ().
Alterations in microbiota composition have previously been associated with response to biological agents, including anti-TNF treatment [Citation19,Citation58,Citation59]. In contrast to these previous studies, we could not identify any difference in microbial composition or DI between responders and non-responders. However, the low number of anti-TNF treated patients limited our analyses, and the absence of significant differences may reflect low statistical power.
A major strength of this study is the inclusion of newly diagnosed patients with a high proportion being treatment-naïve (69%). Thus, results are less influenced by previous treatments and inflammation compared to most foregoing studies. The main benefit of using the GA-map® technology over other applications comes from the standardisation and consistency of results given, which in turn are indexed against a normal control population. The lack of clustering demonstrated in the heatmap (Supplementary Figure 8) underscores the potential of the DI to characterize the faecal microbiota and to separate diagnostic groups.
Nevertheless, there are also limitations of a predetermined primer-based methodology compared to 16S rRNA sequencing technology. Metagenomics provide a broader characterization of the gut microbiota and may unravel the functional potential of the gut microbiota [Citation60,Citation61]. In contrast to faecal samples, analyses of mucosal biopsies may also shed light on the host-microbiota crosstalk. The absence of information on dietary intake is another limitation of the study, since dietary factors differ between geographic areas and impact on the gut microbiota [Citation62,Citation63].
Conclusions
By using the GA-map™ Dysbiosis Test, we demonstrate that the microbiota composition of patients with new-onset UC and CD differed from healthy individuals. UC samples also differed from symptomatic non-IBD patients. Differences in microbiota composition were also seen between different phenotypes of UC, but not in CD. Using the DI, we observed a correlation between degrees of inflammation and dysbiosis, irrespectively of disease status. Our data reveal that the GA-map™ Dysbiosis Test holds the potential to characterize the faecal microbiota composition and to assess the degree of dysbiosis in new-onset IBD. On the other hand, our results cannot demonstrate any proven diagnostic or predictive value of this method to support clinical decision making.
Supplemental Material
Download MS Word (2 MB)Acknowledgements
The authors would like to thank IBD-Character Consortium. Genetic analysis (GA). Haldor Husby.
Disclosure statement
ABK and CC are employed by Genetic Analysis (GA). MHV is member of the expert panel in GA. The other authors have no conflicts of interest to declare.
Additional information
Funding
References
- Xavier RJ, Podolsky DK. Unravelling the pathogenesis of inflammatory bowel disease. Nature. 2007;448(7152):427–434.
- Stange EF, Schroeder BO. Microbiota and mucosal defense in IBD: an update. Expert Rev Gastroenterol Hepatol. 2019;13(10):963–976.
- Solberg IC, Vatn MH, Hoie O, et al. Clinical course in Crohn's disease: results of a Norwegian population-based ten-year follow-up study. Clin Gastroenterol Hepatol. 2007;5(12):1430–1438.
- Lee JC, Lyons PA, McKinney EF, et al. Gene expression profiling of CD8+ T cells predicts prognosis in patients with Crohn disease and ulcerative colitis. J Clin Invest. 2011;121(10):4170–4179.
- Beaugerie L, Seksik P, Nion-Larmurier I, et al. Predictors of Crohn's disease. Gastroenterology. 2006;130(3):650–656.
- Thia KT, Sandborn WJ, Harmsen WS, et al. Risk factors associated with progression to intestinal complications of Crohn's disease in a population-based cohort. Gastroenterology. 2010;139(4):1147–1155.
- Monstad I, Hovde O, Solberg IC, et al. Clinical course and prognosis in ulcerative colitis: results from population-based and observational studies. Ann Gastroenterol. 2014;27(2):95–104.
- Weersma RK, Xavier RJ, Weersma RK, et al. Multiomics analyses to deliver the most effective treatment to every patient with inflammatory bowel disease. Gastroenterology. 2018;155(5):e1–e4.
- Ventham NT, Kennedy NA, Adams AT, et al. Integrative epigenome-wide analysis demonstrates that DNA methylation may mediate genetic risk in inflammatory bowel disease. Nat Commun. 2016;7:13507.
- Biasci D, Lee JC, Noor NM, et al. A blood-based prognostic biomarker in IBD. Gut. 2019;68(8):1386–1395.
- Rudolph SJ, Weinberg DI, McCabe R, et al. Long-term durability of Crohn's disease treatment with infliximab. Dig Dis Sci. 2008;53(4):1033–1041.
- Kennedy NA. PANTS-study (Predicting Nonresponse to Anti-TNF in Crohn’s disease). ECCO; 2018. Available from: https://www.ecco-ibd.eu/publications/congress-abstract-s/abstracts-2018/item/op031-clinical-effectiveness-safety-and-immunogenicity-of-anti-tnf-therapy-in-crohn-x2019-s-disease-12-month-data-from-the-pants-study.html
- Kennedy NA, Heap GA, Green HD, et al. Predictors of anti-TNF treatment failure in anti-TNF-naive patients with active luminal Crohn's disease: a prospective, multicentre, cohort study. Lancet Gastroenterol Hepatol. 2019;4(5):341–353.
- Borg-Bartolo SP, Boyapati RK, Satsangi J, et al. Precision medicine in inflammatory bowel disease: concept, progress and challenges. F1000Res. 2020;9:54.
- Manichanh C, Rigottier-Gois L, Bonnaud E, et al. Reduced diversity of faecal microbiota in Crohn's disease revealed by a metagenomic approach. Gut. 2006;55(2):205–211.
- Lozupone CA, Stombaugh JI, Gordon JI, et al. Diversity, stability and resilience of the human gut microbiota. Nature. 2012;489(7415):220–230.
- Halfvarson J, Brislawn CJ, Lamendella R, et al. Dynamics of the human gut microbiome in inflammatory bowel disease. Nat Microbiol. 2017;2:17004.
- Sokol H, Pigneur B, Watterlot L, et al. Faecalibacterium prausnitzii is an anti-inflammatory commensal bacterium identified by gut microbiota analysis of Crohn disease patients. Proc Natl Acad Sci U S A. 2008;105(43):16731–16736.
- Magnusson MK, Strid H, Sapnara M, et al. Anti-TNF therapy response in patients with ulcerative colitis is associated with colonic antimicrobial peptide expression and microbiota composition. J Crohns Colitis. 2016;10(8):943–952.
- Galazzo G, Tedjo DI, Wintjens DSJ, et al. Fecal microbiota dynamics and its relation with disease course in Crohn's disease. J Crohns Colitis. 2019;13(10):1273–1282.
- Casén C, Vebø HC, Sekelja M, et al. Deviations in human gut microbiota: a novel diagnostic test for determining dysbiosis in patients with IBS or IBD. Aliment Pharmacol Ther. 2015;42(1):71–83.
- Consortium I-C; 2020; Available from: https://cordis.europa.eu/project/rcn/106191_en).htm
- Lennard-Jones JE. Classification of inflammatory bowel disease. Scand J Gastroenterol Suppl. 1989;170:2–6.
- Satsangi J, Silverberg MS, Vermeire S, et al. The Montreal classification of inflammatory bowel disease: controversies, consensus, and implications. Gut. 2006;55(6):749–753.
- Mokrowiecka A, Kumor A, Jakubczyk E, et al. The application of Montreal classification in different clinical and serological IBD subtypes. Hepatogastroenterology. 2010;57(101):787–793.
- Sprakes MB, Ford AC, Warren L, et al. Efficacy, tolerability, and predictors of response to infliximab therapy for Crohn's disease: a large single centre experience. J Crohns Colitis. 2012;6(2):143–153.
- West NR, Hegazy AN, Owens BMJ, et al. Oncostatin M drives intestinal inflammation and predicts response to tumor necrosis factor-neutralizing therapy in patients with inflammatory bowel disease. Nat Med. 2017;23(5):579–589.
- Osipenko MF, Livzan MA, Skalinskaya MI, et al. Fecal calprotectin concentration in the differential diagnosis of bowel diseases. Ter Arkh. 2015;87(2):30–33.
- Vebø HC, Sekelja M, Nestestog R, et al. Temporal development of the infant gut microbiota in immunoglobulin E-sensitized and nonsensitized children determined by the GA-map infant array. Clin Vac Immunol. 2011;18(8):1326–1335.
- R: a language and environment for statistical computing; 2019. Available from: https://www.R-project.org/
- Varela E, Manichanh C, Gallart M, et al. Colonisation by Faecalibacterium prausnitzii and maintenance of clinical remission in patients with ulcerative colitis. Aliment Pharmacol Ther. 2013;38(2):151–161.
- Knox NC, Forbes JD, Peterson CL, et al. The gut microbiome in inflammatory bowel disease: lessons learned from other immune-mediated inflammatory diseases. Am J Gastroenterol. 2019;114(7):1051–1070.
- Sartor RB, Wu GD. Roles for intestinal bacteria, viruses, and fungi in pathogenesis of inflammatory bowel diseases and therapeutic approaches. Gastroenterology. 2017;152(2):327–339.e4.
- Sokol H, Seksik P, Rigottier-Gois L, et al. Specificities of the fecal microbiota in inflammatory bowel disease. Inflamm Bowel Dis. 2006;12(2):106–111.
- Engels C, Ruscheweyh H-J, Beerenwinkel N, et al. The common gut microbe Eubacterium hallii also contributes to intestinal propionate formation. Front Microbiol. 2016;7:713.
- Satokari R. Contentious host-microbiota relationship in inflammatory bowel disease—can foes become friends again? Scand J Gastroenterol. 2015;50(1):34–42.
- Miquel S, Martin R, Rossi O, et al. Faecalibacterium prausnitzii and human intestinal health. Curr Opin Microbiol. 2013;16(3):255–261.
- Dethlefsen L, Eckburg PB, Bik EM, et al. Assembly of the human intestinal microbiota. Trends Ecol Evol (Amst). 2006;21(9):517–523.
- Hold GL, Smith M, Grange C, et al. Role of the gut microbiota in inflammatory bowel disease pathogenesis: what have we learnt in the past 10 years? World J Gastroenterol. 2014;20(5):1192–1210.
- Morgan XC, Tickle TL, Sokol H, et al. Dysfunction of the intestinal microbiome in inflammatory bowel disease and treatment. Genome Biol. 2012;13(9):R79.
- Papa E, Docktor M, Smillie C, et al. Non-invasive mapping of the gastrointestinal microbiota identifies children with inflammatory bowel disease. PLoS One. 2012;7(6):e39242.
- Pascal V, Pozuelo M, Borruel N, et al. A microbial signature for Crohn's disease. Gut. 2017;66(5):813–822.
- Joossens M, Huys G, Cnockaert M, et al. Dysbiosis of the faecal microbiota in patients with Crohn's disease and their unaffected relatives. Gut. 2011;60(5):631–637.
- Machiels K, Joossens M, Sabino J, et al. A decrease of the butyrate-producing species Roseburia hominis and Faecalibacterium prausnitzii defines dysbiosis in patients with ulcerative colitis. Gut. 2014;63(8):1275–1283.
- Roseth AG, Aadland E, Jahnsen J, et al. Assessment of disease activity in ulcerative colitis by faecal calprotectin, a novel granulocyte marker protein. Digestion. 1997;58(2):176–180.
- Bjarnason I. The use of fecal calprotectin in inflammatory bowel disease. Gastroenterol Hepatol (NY). 2017;13(1):53–56.
- Zhulina Y, Cao Y, Amcoff K, et al. The prognostic significance of faecal calprotectin in patients with inactive inflammatory bowel disease. Aliment Pharmacol Ther. 2016;44(5):495–504.
- Nakajima A, Sasaki T, Itoh K, et al. A soluble fiber diet increases Bacteroides fragilis group and IgA production in the gut. Appl Environ Microbiol. 2020;86(13):e00405–e00420.
- Hiippala K, Kainulainen V, Suutarinen M, et al. Isolation of anti-inflammatory and epithelium reinforcing bacteroides and Parabacteroides spp. from a healthy fecal donor. Nutrients. 2020;12(4):935.
- Gevers D, Kugathasan S, Denson LA, et al. The treatment-naive microbiome in new-onset Crohn's disease. Cell Host Microbe. 2014;15(3):382–392.
- Gorkiewicz G, Thallinger GG, Trajanoski S, et al. Alterations in the colonic microbiota in response to osmotic diarrhea. PLoS One. 2013;8(2):e55817.
- Björkqvist O, Repsilber D, Seifert M, et al. Alterations in the relative abundance of Faecalibacterium prausnitzii correlate with changes in fecal calprotectin in patients with ileal Crohn's disease: a longitudinal study. Scand J Gastroenterol. 2019;54(5):577–585.
- Olbjørn C, Cvancarova Småstuen M, Thiis-Evensen E, et al. Fecal microbiota profiles in treatment-naïve pediatric inflammatory bowel disease – associations with disease phenotype, treatment, and outcome. Clin Exp Gastroenterol. 2019;12:37–49.
- Willing B, Halfvarson J, Dicksved J, et al. Twin studies reveal specific imbalances in the mucosa-associated microbiota of patients with ileal Crohn's disease. Inflamm Bowel Dis. 2009;15(5):653–660.
- Schirmer M, Franzosa EA, Lloyd-Price J, et al. Dynamics of metatranscription in the inflammatory bowel disease gut microbiome. Nat Microbiol. 2018;3(3):337–346.
- Clerc F, Novokmet M, Dotz V, et al. Plasma N-glycan signatures are associated with features of inflammatory bowel diseases. Gastroenterology. 2018;155(3):829–843.
- Kalla R, Adams A, Vatn S, et al. Proximity extension assay based proteins show immune cell specificity and can diagnose and predict outcomes in inflammatory bowel diseases: IBD Character Study. Gastroenterology. 2017;152(5):S606–S607.
- Ananthakrishnan AN, Luo C, Yajnik V, et al. Gut microbiome function predicts response to anti-integrin biologic therapy in inflammatory bowel diseases. Cell Host Microbe. 2017;21(5):603–610.e3.
- Doherty MK, Ding T, Koumpouras C, et al. Fecal microbiota signatures are associated with response to ustekinumab therapy among Crohn's disease patients. mBio. 2018;9(2):e02120.
- Moen AEF, Lindstrøm JC, Tannaes TM, et al. The prevalence and transcriptional activity of the mucosal microbiota of ulcerative colitis patients. Sci Rep. 2018;8(1):17278.
- Moen AEF, Tannaes TM, Vatn S, et al. Simultaneous purification of DNA and RNA from microbiota in a single colonic mucosal biopsy. BMC Res Notes. 2016;9:328.
- Chiara MM, Franco S, Marco P, et al. Nutrition, IBD and gut microbiota: a review. Nutrients. 2020;12(4):944.
- Senghor B, Sokhna C, Ruimy R, et al. Gut microbiota diversity according to dietary habits and geographical provenance. Hum Microb J. 2018;7–8:1–9.