
Abstract
Objectives
Light microscopical analysis in two dimensions, combined with immunohistochemistry, is presently the gold standard to describe the enteric nervous system (ENS). Our aim was to assess the usefulness of three-dimensional (3D) imaging by X-ray phase-contrast tomography in evaluating the ENS of the human bowel.
Material and methods
Myenteric ganglia were identified in full-thickness biopsies of the ileum and colon by hematoxylin & eosin staining. A1-mm biopsy punch was taken from the paraffin blocks and placed into a Kapton® tube for subsequent tomographic investigation. The samples were scanned, without further preparation, using phase-contrast tomography at two different scales: overview scans (performed with laboratory setups), which allowed localization of the nervous tissue (∼1µm effective voxel size); and high-resolution scans (performed with a synchrotron endstation), which imaged localized regions of 320x320x320 µm3 (176 nm effective voxel size).
Results
The contrast allowed us to follow the shape and the size changes of the ganglia, as well as to study their cellular components together with the cells and cellular projections of the periganglional space. Furthermore, it was possible to show the 3D network of the myenteric plexus and to quantify its volume within the samples.
Conclusions
Phase-contrast X-ray tomography can be applied for volume analyses of the human ENS and to study tissue components in unstained paraffin-embedded tissue biopsies. This technique could potentially be used to study disease mechanisms, and to compare healthy and diseased tissues in clinical research.
Introduction
Gastrointestinal diseases are common in all ages of the population. It is of great importance to improve the diagnostic accuracy, and to determine the etiology and affected cell types in various diseases. Enteric neuropathy with inflammatory and/or degenerative changes in the enteric nervous system (ENS) may be one causal factor to gastrointestinal dysfunction [Citation1,Citation2]. The ENS is composed of two distinct components with different functions: the submucosal plexus and the myenteric plexus. The latter is situated between the inner and outer muscle layers and governs the peristaltic movements of the bowel [Citation3]. The plexus consists of ganglia built up by neurons, their axons and dendrites, glial cells and connecting neuronal fascicles between the ganglia. In addition, interstitial cells of Cajal (ICCs) and telocytes (fibroblast-like cells in previous literature) with their long and thin cytoplasmic projections surround and penetrate the ganglia and nerves in certain localizations [Citation4].
Patterns and causes of dysmotility can be analyzed by different techniques in clinical practice [Citation5]. Tissue samples for diagnostic purposes of the ENS demand full-thickness biopsies, obtained by surgery in full anesthesia, with potential risks for the patient [Citation6]. Traditional histopathological studies of ENS are performed in two-dimensional (2D), 3–5 µm thick, sections using various tissue staining procedures combined with immunohistochemistry of several proteins. Due to the nature of this technique, only a small number of myenteric ganglia in a thin segment are available for evaluation [Citation1,Citation2,Citation6]. Three-dimensional (3D) reconstructions can be done only by building up images either from many serial sections, or in whole-mount specimen, with fluorescence confocal scanning microscopes; thus, with some difficulties to study the exact details of the various tissue components and their relationships [Citation7–10].
X-ray computed tomography (CT) provides volumetric information in a non-destructive way and is widely used for medical applications. Standard X-ray attenuation-based microtomography would normally not show any contrast between different cell types or soft tissues, because of their low and relatively homogenous X-ray attenuation coefficient. Aside from attenuation, however, an X-ray wave that interacts with a material is also subject to a shift in its phase. Novel X-ray imaging techniques can obtain contrast from this phenomenon, in what is commonly called X-ray phase-contrast imaging (PCI). For hard X-rays and low atomic number materials, such as biological tissues, PCI provides the possibility to significantly increase the contrast (or alternatively decrease the radiation dose while keeping a comparable contrast) compared with attenuation-based imaging [Citation11,Citation12]. PCI can be performed with a wide variety of modalities and setups. Until recently, state-of-the-art results would require highly coherent X-rays only produced at synchrotron facilities [Citation13]. Laboratory setups, of easier accessibility, are, however, starting to show comparable results [Citation14].
Our hypothesis was that 3D PCI of unstained paraffin-embedded tissue from the bowel would allow to (a) give an overview and analysis of the cells within and around the ganglia and (b) determine the volume, shape and spatial change of the nervous myenteric plexus. The aim of the present methodologic study was to determine whether the method can be applied to study and describe the cellular morphology and possible changes of the my enteric plexus in the human ileum and colon.
Material and methods
The study was performed in accordance with the Helsinki declaration and approved by the Regional Ethics Review Board at Lund University (2012/527 and 2016/943, Date of approval 16/10/2012 and 15/11/2016). Subjects gave their written, informed consent before entering the study.
Sample preparation
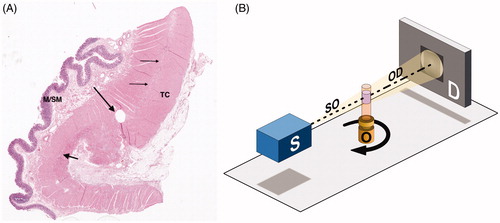
Two full-thickness bowel samples were obtained; one from the colon of a 60-year old man, resected from the macroscopically normal part 5 cm above the carcinoma, and one biopsy from the ileum of a 56-year old woman suffering from Ehlers-Danlos syndrome and gastrointestinal dysmotility, with diagnosed atrophy of the myenteric ganglia in conventional immunohistochemistry [Citation14,Citation15]. The tissue samples were fixed in buffered formalin at room temperature and embedded in paraffin. The representative part of the ENS was chosen in a 4 µm thick hematoxylin and eosin-stained (H&E) section under the light microscope in both samples (). A biopsy punch of 1 mm diameter was taken from the paraffin block and placed into a Kapton® tube (Paramount, Indiana, US) for mounting in the subsequent tomographic investigation [Citation16].
Figure 1. Sample preparation and experimental setup. (A) Colon, normal full thickness. The thin arrows show the intermyenteric connective tissue plate, the short thick arrow points to a myenteric ganglion. The round hole is the sample area (long thick arrow) (hematoxylin and eosin; M/SM: mucosa/submucosa; TC: tenia coli). (B) Schematic of the experimental setup for propagation-based phase-contrast X-ray tomography. The sample object (O), contained in a Kapton® tube, is placed between an X-ray source (S) and a detector (D) and rotates 180° around its axis during the measurement. Details on equipment and parameters can be found in the Supplementary Appendix.
X-ray tomography
X-ray phase-contrast CT was performed on different instruments: two custom-designed laboratory µCT setups, located at the Institute for X-Ray Physics, University of Göttingen [Citation16], and a dedicated synchrotron radiation nano-CT endstation (GINIX), installed at the P10/PETRAIII beamline, Hamburg [Citation17]. All the setups use propagation-based, phase-contrast methods, in which the sample is placed between source and detector, and the phase information is obtained by free space propagation and self-interference of the coherent X-ray beam without any need of additional optical elements (). In all cases, phase retrieval is necessary to correctly extract the phase information before CT reconstruction [Citation18].
The two laboratory setups allowed to image the whole 1 mm wide and 1.5-2.5 mm long samples with anisotropic effective voxel size of ∼1µm (; ∼15 h scan time per sample), enabling an identification of the neural tissue structure. The two systems could run in parallel, which was used to optimize time consumption.
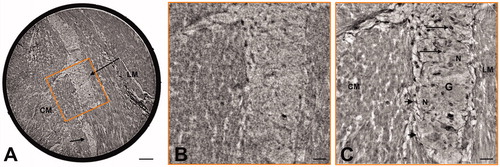
Figure 2. Comparison between laboratory setup and synchrotron endstation. (A) Example of transversal slice from the overview scan of the healthy colon sample acquired with one of the laboratory setups (voxel size 0.92 µm). The 1-mm diameter Kapton® tube is fully visible within the field-of-view as a black ring around the biopsy punch. The contrast is enough to identify the t. muscularis with circular (CM) and longitudinal (LM) muscle layers. In between, parts of one large ganglion (long arrow) and an interganglional nerve fascicle (short arrow) can be seen. The orange square illustrates the size of the region of interest (ROI) on which a high-resolution scan was acquired in the synchrotron setup. Bar: 100 μm. (B) Digital zoom of the overview scan to the orange ROI depicted in (A), for direct qualitative comparison with the high-resolution scan. Bar: 25 μm. (C) Slice of the high-resolution scan (voxel size 176 nm) acquired in the synchrotron setup that matches the orange ROI depicted in (A). Part of the ganglion (G) is clearly visible between the circular (CM) and longitudinal (LM) muscle layers. Some of the neurons (N) and glial cells (arrows) are well recognized. Just at the border of the ganglion there are small spindle-shaped cells (arrowheads). Bar: 25 μm.
Selected regions-of-interest (ROIs) of 320x320x320 µm3 were scanned with an isotropic effective voxel size of 176 nm at the synchrotron-based endstation (; ∼2.5–3 h scan time), using inline holography based on a coherent divergent beam exiting from an X-ray waveguide [Citation16,Citation17]. Holographic phase retrieval based on the CTF-approach, ring removal and tomographic reconstructions were performed with in-house reconstruction pipelines [Citation19].
Complete information regarding the experimental setups and the reconstruction pipelines is provided in the Supplementary Appendix. In the following, the scans obtained with the laboratory setups will be called overview scans, while the ones obtained in the synchrotron endstation will be named high-resolution scans.
Image analysis
All the obtained volumetric datasets could be digitally sectioned along any arbitrary slicing plane, enabling 3D virtual histology of the samples. In the histological evaluation, the term ‘spindle-shaped cells’ was used to describe the cells around the ganglia, which can represent either ICC, telocytes, or fibroblasts/cytes, because no differentiation could be made without immunohistochemistry.
In the case of the overview scans, the neural tissue was segmented using the Magic Wand tool of Amira™ (Thermo Fisher Scientific™, Waltham, Massachusetts, US), which uses a gray-value-based ‘region growing’algorithm. This enabled a 3D rendering of the neural tissue structure, which was visualized with the same software. From the segmented data, the ratio of neural tissue volume over total examined tissue volume was also calculated. Finally, an evaluation of the neural tissue thickness was performed with the Filament tool in Amira™, which performs a skeletonization of the segmented structure and then measures a distance map on the voxels that are part of the skeleton.
Results
3D Virtual histology
In the high-resolution 3D virtual histology, the contrast was sufficient to follow and analyze the shape and the size changes of the myenteric ganglia, their various cellular components, i.e. neurons and glial cells, the periganglional space and the smooth muscle cells (). For comparison, the same cell components are shown in traditional light microscopy ().
Figure 3. Colon, periganglional space. High-resolution scan. Peripheral part of a ganglion with a broader, tangentially represented periganglional space containing several spindle-shaped cells (thick, short arrows show cellular bodies) with long and very thin cellular projections that are almost parallel to each other (thin, long arrows). Note that one of the thin projections on the left tightly follows the border of the ganglion. G: glial cells; N: neurons; SMC: smooth muscle cells. Bar: 25 μm.
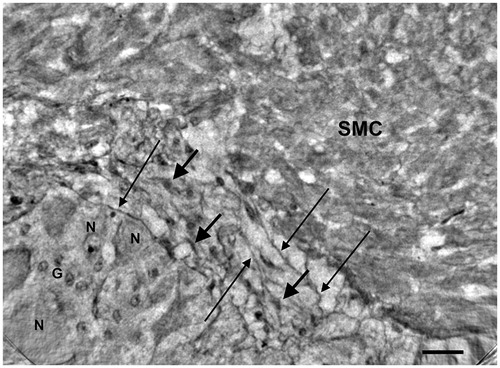
Figure 4. Colon, peripheral part of a ganglion (starting slice of Video 1).High-resolution scan. The end of the ganglion is tangentially sectioned. The short thick arrow shows a spindle-shaped cell (A) with very long projections (long thin arrows) that appear to run on the surface of the ganglion (upper right) and probably penetrate into the ganglion (lower left). A similar spindle-shaped cell (B; long, thick arrow), with part of the projections on the right, is between the ganglion and the smooth muscle cells. At the bottom of the ganglion there are thin filamentous projections (short thin arrows). Arrowheads: nuclei; G: glial cell; N: neurons; SMC: smooth muscle cells. Bar: 25 μm.
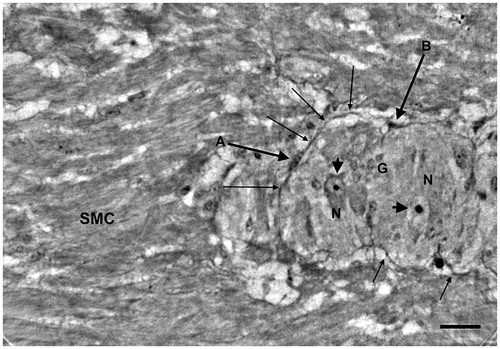
Figure 5. Colon, the same ganglion as (end slice of Video 1). High-resolution scan. The ganglion almost occupies the whole field. Thin cellular projections from a spindle cell seem to penetrate the ganglion (thin arrows). A spindle cell with two projections is within the ganglion near one of the neurons (arrowhead).At the bottom of the ganglion there are several thin projections (thick arrows) in the space between the ganglion and the surrounding muscle cells. G: glial cells; N: neurons; SMC: smooth muscle cells. Bar: 25 μm.
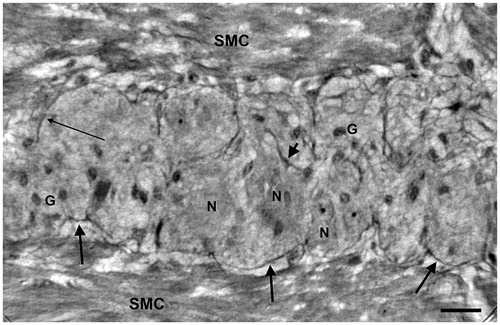
Figure 6. Ileum. High-resolution scan. The myenteric ganglion is little with a few neurons (arrows) showing intracellular dense granules (upper neuron) or vacuoles (lower neuron). G: ganglion; CM: circular muscle; LM: longitudinal muscle. Bar: 25 μm.
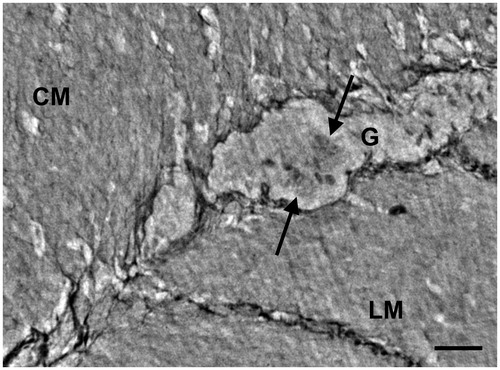
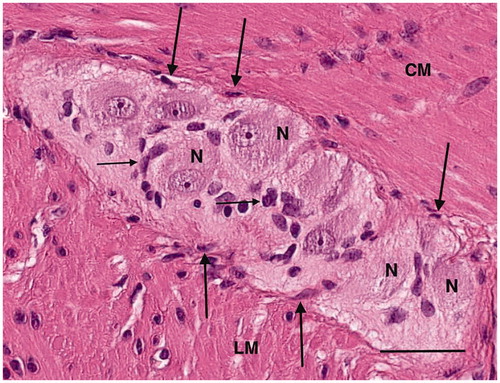
Figure 7. Colon, myenteric ganglion. High magnification light microscopy. Several neurons (N), glial cells (thin arrows) and spindle-shaped cells (thick arrows) between the ganglion and the surrounding muscle. CM: circular muscle; LM: longitudinal muscle; hematoxylin and eosin. Bar: 25 μm.
In the healthy colon, long and very thin cytoplasmic projections could be observed from the periganglional spindle-shaped cells on a tangential view of the periganglional space (). Small spindle-shaped cells were found at the border of the ganglion (), from which projections could be found penetrating the ganglion (). The details of the various components of the ganglion and periganglional space can be followed through the volume, as exemplified by Video 1, provided as Supplemental Material. The first frame of the video corresponds to , showing two very long cellular projections of the spindle-shaped cell A. The right upper projection runs on the surface of the ganglion at the border, whereas the lower left projection probably penetrates the ganglion. There are several neurons with or without nuclei; the small round nuclei, forming/gathering sometimes in small groups, are glial cells. At approximately 02 s in the video, there is a larger spindle-shaped cell in the middle with two projections running through the ganglion. The last frame shows the ganglion of , with thin cellular projections situated both at the border and penetrating into the ganglion itself. Furthermore, one spindle-shaped cell (arrowhead on ) in the middle of the ganglion appears to almost be touching the plasma membrane of a neuron.
In the ileum from the patient, the ganglia were much smaller with a few neurons and glial cells without intraganglionic projections from the periganglional cells (). Spindle-shaped cells and projections were seen in the intermyenteric connective tissue plate and fine projections in the intercellular space between the muscle cells, but detailed analysis of the muscle cells was not possible (not shown).
Volumetric structure and quantification
In the colon, the 3D network was built up by the ganglia and the interconnecting nerve bundles, already noticeable with an appropriate slicing of the overview scan (). The network was even more discernible with the volume rendering of the segmented neural structure (). The segmented neural tissue had a volume of 0.04 mm3, corresponding to a 7.2% ratio of neural tissue volume over total examined tissue volume. The thickness analysis showed two main trunks, identifiable as ganglia in the virtual histology, with thickness ranging between 80 µm and 130 µm along their length, connected by smaller structures (). A short video clip illustrating these concepts in the healthy colon sample is provided as Supplemental Material (Video 2).
Figure 8. Qualitative and quantitative analysis of the neural tissue volumetric structure in the overview scans. (A) Arbitrary slicing planes allow to follow the network of ganglia (G) and interconnecting nerve bundles in the healthy colon sample (overview scan performed with the liquid metal jet setup). (B) A volume rendering of the segmented neural tissue (in green)helps to visualize the 3D network and study its shape. (C) Spheres (color-coded based on their diameter) are fitted in the volumes to approximate the thickness of the structure in each point. (D) Thickness estimation applied to the ileum sample from a patient affected by Ehlers-Danlos syndrome and gastrointestinal dysmotility(overview scan performed with the rotating anode setup). The color scale is the same as in C, for comparison purposes. G: ganglia; arrows: interganglional nerve fascicles. In A, B and C, the box surrounding the sample measures approximately 1050 x 1050 x 700 µm3. In D, the box measures approximately 1100 x 1100 x 1100 µm3, as the extracted biopsy punch was taller. A video clip illustrating these concepts in the healthy colon sample is provided as Supplemental Material (Video 2).
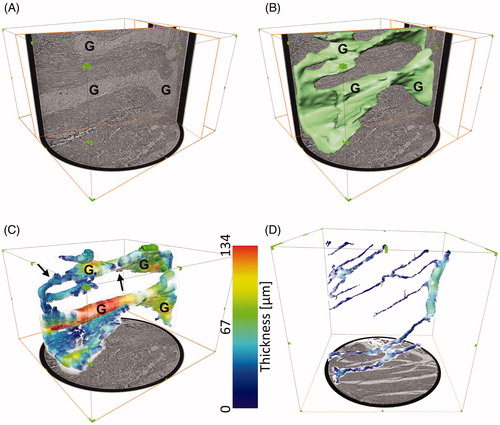
In the ileum, the segmented neural tissue had a volume of 0.005 mm3, corresponding to a 1.0% ratio of neural tissue volume over total examined tissue volume. The thickness analysis showed a main trunk, with thickness ranging between 60 µm and 70 µm, and several thinner branches, only in part connected to the main trunk within the examined volume ().
Discussion
The main finding of the present methodology description was that X-ray phase-contrast tomography could visualize and separate the different cellular components of the myenteric plexus in health and disease in unstained human ileum and colon. The 3D method could also provide the absolute and relative volume of the ENS compared with the whole sample volume.
The gold standard to describe pathological changes of the ENS in health and disease is by light microscopical examination, combined with immunohistochemistry, and quantitative analysis of neurons, glial cells, ICCs, telocytes and inflammatory cells, as well as up- or downregulation of diverse neuropeptides [Citation14]. Despite the clear merits of routine immunohistochemistry in resolution and specific imaging of neuropeptides, this well-established method also has its shortcomings. Firstly, due to a large number of different neuropeptides, the combination and variation of the composition of neuropeptides may vary indefinitely, both within health and within the same disease entity. No pathognomonic changes of neuropeptides for enteric neuropathy have so far been described. Secondly, histology is based on 2D sections, and extension to 3D datasets based on parallel slices is very tedious, time-consuming and does not result in isotropic resolution due to slice thickness, alignment problems, and slicing artefacts. Fluorescence confocal microscopy with dual immunohistochemistry has been used with either serial thin cryostat sections with a maximal thickness of 15 µm [Citation7–9,Citation20], or serial optical sections of whole mount preparations [Citation10]. In those studies, it is difficult to exactly determine the connections between ENS, ICCs and fibroblast-like cells [Citation4]. The volumes of fibroblast-like cells and ganglia were determined, but the whole volume of the ENS in the biopsies was not reported [Citation10,Citation20]. Recently, a different time-consuming method was introduced for confocal microscopic examination after tissue cleaning, immunohistochemistry and quantitative analysis of full thickness human colon, jejunum and pancreas, without embedding and sectioning [Citation21].
By using 3D phase-contrast tomography, structural alterations associated with different physiological or pathological states can be interrogated in large volumes at controllable isotropic resolution. While synchrotron radiation in principle offers resolutions higher than in optical microscopy, it is typically not readily accessible for clinical research and pathology. However, as we also show in this work, compact laboratory µCT instrumentation and advanced phase retrieval methods are able to yield 3D reconstructions of larger samples at a resolution of a few µm, and an image quality which is high enough to segment the relevant structures.
Our present work shows that the 3D analysis of the ENS and related cellular components is possible on routinely fixed, unstained paraffin-embedded biopsies of human bowel. This gives the possibility to both provide reliable morphologic and quantitative information about the status of the human ENS. The greatest methodological advance in research, and possibly in diagnostics, is by using 3D as a reliable judgment of atrophy or hypertrophy by the determination of real ENS volume, and not only the ganglia volume as with light microscopy [Citation10,Citation15], with minor mechanical handling of the tissue sample. At the same time, complementary information can be obtained through the possibility to image the alteration of the microstructure over a segment of a few mm, including connections between different cell types, as can be seen on Video 1. A high-resolution scan can be performed on the sample immediately after an overview scan, without any further necessary sample preparation procedure. As such, it is possible to identify interesting areas with an overview scan, and then focus on them with a high-resolution scan. Within and around the ganglion, the neurons, glial cells and spindle-shaped cells can be observed. In a previous study using double immunostaining, we could report that telocytes in the colon can both ‘envelope’ the ganglion, and can be situated within the ganglion, in close connection with neurons [Citation4]. The phenomenon of probable penetration of fine projections from spindle-like cells into the ganglion could also be identified by the present method. This technique could also be enhanced by applying osmic acid fixation, which provides increased contrast to the cellular membranes [Citation22]. The small probed volume (1 mm diameter x 1.5-2.5 mm depth) could be extended by sampling several biopsy punches from the same block. This would also increase the statistical significance of the estimated relative volumes of ENS over total sample volume, which are bound to be dependent on the representative part of the ENS selected for the biopsy punch.
The disadvantages of this 3D-method are: (a) the cost and time of the analysis and data management, including availability of the facility, and (b) difficulties regarding the interpretation of certain cell types. Nevertheless, while the cost of the laboratory setups is high, they are made with commercially available equipment, which in the future will become more affordable and more powerful. Also, it was already demonstrated that laboratory setups can be implemented in a way that requires less space, strongly reduces scan durations and is flexible in choice of field-of-view and resolution, achieving a resolution below 1 µm [Citation23]. If beam time is available, the GINIX endstation portfolio has also been recently expanded by a parallel-beam configuration, allowing for fast overview scans with slightly enhanced resolution and contrast compared to the ones presented in this work, but with scan times as short as ∼70 s [Citation24]. Beyond that, recent advances in computer architecture and software may allow the processing and analysis of data sets from numerous patients in the future. The spindle-shaped cells within the periganglional connective tissue can represent either ICC, telocytes, or fibroblasts/cytes. These cells cannot yet be differentiated in the nano-tomographic pictures, although the ‘spindle-shaped cells’ (probably telocytes) can be very well followed within the ganglion, as shown in the high-resolution video clip (Video 1). We can expect that further advancements in X-ray sources, phase retrieval and segmentation methods will improve differentiation of various cells in the future. At present, double/triple immunohistochemistry, with or without confocal fluorescence microscopy [Citation4,Citation7,Citation8,Citation25–27], is a satisfactory, cheaper and quicker method for this purpose. However, staining and 3D visualization of myenteric ganglia by the new method of Graham and López et al. [Citation21] takes several weeks, and demands many manual steps. Despite the disadvantages, our long-term goal will be to include more individuals to examine whether 3D X-ray phase-contrast tomography is applicable for the study of gastrointestinal disease mechanisms comparing healthy and diseased tissues. Although the small volume of ENS in our patient was in alignment with the ganglia atrophy observed in immunohistochemistry [Citation15], one sample is not enough to state the difference between health and disease. Different methods are needed to evaluate tissue biopsies and may complete each other. While the approach is still user-dependent in order to identify the most representative area, once a ROI is chosen, the method is very reproducible from time to time and mainly automatic. It also does not require special sample preparation, as paraffin-embedding is already routinely used for histological studies. Furthermore, even though not as good as in paraffin-embedded samples, the same technique has been shown to still provide contrast in hydrated neural tissue [Citation28], if the shrinking induced by paraffin-embedding is of major concern.
In conclusion, the present methodology paper shows that X-ray phase-contrast tomography can be applied to the volume analysis of the human ENS in health and disease and to study tissue components and the relationship between various cellular components of the ENS in full-thickness bowel biopsies, which is a promising novel technique for research and possible future clinical applications in selected cases.
Supplemental Material
Download Zip (14.3 MB)Acknowledgments
We want to acknowledge Maria Teresa Moreira Jara and Maria Nilsson for technical help with sample staining and Michael Sprung, Fabian Westermeier, and Markus Osterhoff for the crucial help with all technical issues during the beamtime.
Disclosure statement
The authors have no conflicts of interest.
Additional information
Funding
References
- Knowles CH, De Giorgio R, Kapur RP, et al. The London Classification of gastrointestinal neuromuscular pathology: report on behalf of the Gastro 2009 International Working Group. Gut. 2010;59(7):882–887.
- Knowles CH, Veress B, Kapur RP, et al. Quantitation of cellular components of the enteric nervous system in the normal human gastrointestinal tract-report on behalf of the Gastro 2009 International Working Group. Neurogastroenterol Motil. 2011;23(2):115–124.
- Goyal RK, Hirano I. The enteric nervous system. N Engl J Med. 1996;334(17):1106–1115.
- Veress B, Ohlsson B. Spatial relationship between telocytes, interstitial cells of Cajal and the enteric nervous system in the human ileum and colon. J Cell Mol Med. 2020;24(6):3399–3406.
- Keller J, Bassotti G, Clarke J, International Working Group for Disorders of Gastrointestinal Motility and Function, et al. Expert consensus document: advances in the diagnosis and classification of gastric and intestinal motility disorders. Nat Rev Gastroenterol Hepatol. 2018;15(5):291–308.
- Veress B, Nyberg B, Tornblom H, et al. Intestinal lymphocytic epithelioganglionitis: a unique combination of inflammation in bowel dysmotility: a histopathological and immunohistochemical analysis of 28 cases. Histopathology. 2009;54(5):539–549.
- Vanderwinden JM, Rumessen JJ, De Laet MH, et al. CD34+ cells in human intestine are fibroblasts adjacent to, but distinct from, interstitial cells of Cajal. Lab Invest. 1999;79(1):59–65.
- Vanderwinden JM, Rumessen JJ, De Laet MH, et al. CD34 immunoreactivity and interstitial cells of Cajal in the human and mouse gastrointestinal tract. Cell Tissue Res. 2000;302(2):145–153.
- Toma H, Nakamura K, Kuraoka A, et al. Three-dimensional structures of c-Kit-positive cellular networks in the guinea pig small intestine and colon. Cell Tissue Res. 1999;295(3):425–436.
- Cobine CA, Hennig GW, Kurahashi M, et al. Relationship between interstitial cells of Cajal, fibroblast-like cells and inhibitory motor nerves in the internal anal sphincter. Cell Tissue Res. 2011;344(1):17–30.
- Cloetens P, Ludwig W, Baruchel J, et al. Holotomography: quantitative phase tomography with micrometer resolution using hard synchrotron radiation X rays. Appl Phys Lett. 1999;75(19):2912–2914.
- Kitchen MJ, Buckley GA, Gureyev TE, et al. CT dose reduction factors in the thousands using X-ray phase contrast. Sci Rep. 2017;7(1):15953.
- Stampanoni M, Mokso R, Marone F, et al. Phase-contrast tomography at the nanoscale using hard X rays. Phys Rev B. 2010;81(14):140105.
- Lindberg G, Tornblom H, Iwarzon M, et al. Full-thickness biopsy findings in chronic intestinal pseudo-obstruction and enteric dysmotility. Gut. 2009;58(8):1084–1090.
- Ohlsson B, Dahlin LB, Englund E, et al. Autonomic and peripheral neuropathy with reduced intraepidermal nerve fiber density can be observed in patients with gastrointestinal dysmotility. Clin Case Rep. 2020;8(1):142–148.
- Töpperwien M, van der Meer F, Stadelmann C, et al. Three-dimensional virtual histology of human cerebellum by X-ray phase-contrast tomography. Proc Natl Acad Sci Usa. 2018;115(27):6940–6945.
- Salditt T, Osterhoff M, Krenkel M, et al. Compound focusing mirror and X-ray waveguide optics for coherent imaging and nano-diffraction. J Synchrotron Radiat. 2015;22(4):867–878.
- Mohammadi S, Larsson E, Alves F, et al. Quantitative evaluation of a single-distance phase-retrieval method applied on in-line phase-contrast images of a mouse lung. J Synchrotron Radiat. 2014;21(Pt 4):784–789.
- Lohse L, Robisch AL, Töpperwien M, et al. A phase-retrieval toolbox for X-ray holography and tomography. J Synchrotron Radiat. 2020;27(Pt 3):852–859.
- Grover M, Bernard CE, Pasricha PJ, et al. Platelet-derived growth factor receptor α (PDGFRα)-expressing “fibroblast-like cells” in diabetic and idiopathic gastroparesis of humans. Neurogastroenterol Motil. 2012;24(9):844–852.
- Graham KD, López SH, Sengupta R, et al. Robust, 3-dimensional visualization of human colon enteric nervous system without tissue sectioning. Gastroenterology. 2020;158(8):2221–2235.
- Dahlin LB, Rix KR, Dahl VA, et al. Three-dimensional architecture of human diabetic peripheral nerves revealed by X-ray phase contrast holographic nanotomography. Sci Rep. 2020;10(1):7592.
- Eckermann M, Topperwien M, Robisch AL, et al. Phase-contrast X-ray tomography of neuronal tissue at laboratory sources with submicron resolution. J Med Imaging (Bellingham). 2020;7(1):013502.
- Frohn J, Pinkert-Leetsch D, Mißbach-Güntner J, et al. 3D virtual histology of human pancreatic tissue by multiscale phase-contrast X-ray tomography. J Synchr Radiat. (under review).
- Vannucchi MG, Traini C, Manetti M, et al. Telocytes express PDGFRα in the human gastrointestinal tract. J Cell Mol Med. 2013;17(9):1099–1108.
- Chen Y, Tsai YH, Liu YA, et al. Application of three-dimensional imaging to the intestinal crypt organoids and biopsied intestinal tissues. ScientificWorldJournal. 2013;2013:624342.
- Liu Y-A, Chung Y-C, Pan S-T, et al. 3-D illustration of network orientations of interstitial cells of Cajal subgroups in human colon as revealed by deep-tissue imaging with optical clearing. Am J Physiol Gastrointest Liver Physiol. 2012;302(10):G1099–G1110.
- Töpperwien M, Markus A, Alves F, et al. Contrast enhancement for visualizing neuronal cytoarchitecture by propagation-based X-ray phase-contrast tomography. Neuroimage. 2019;199:70–80.