
Abstract
Objective
Anastomotic leakage is a common complication following large abdominal surgery, often developing to life-threatening abdominal sepsis due to late diagnosis. Currently, diagnostics rely on systemic hemodynamic and infection monitoring. We hypothesized that intraperitoneal microdialysis allows detection of peritonitis prior to changes in standard clinical parameters in a pig model.
Materials and Methods
We included six pigs; five underwent intraperitoneal fecal contamination, one had sham surgery for a total of 10 h. Microdialysis was established in four intraabdominal quadrants and two hepatic lobes. All pigs were hemodynamically monitored with pulmonary artery and femoral artery catheters. Blood samples were assessed for inflammatory markers, terminal complement complex (TCC), interleukin (IL)-6, IL-10, and plasminogen activator inhibitor-1 (PAI-1).
Results
Microdialysis showed intraperitoneal lactate increase during the first two hours after fecal contamination, which remained elevated throughout the observation time with concurrent decrease of glucose. Arterial lactate remained within reference range (<1,6mM). Systemic inflammatory markers TCC, IL-6, IL-10 and PAI-1 increased significantly after minimum four hours. Mean arterial pressure, stroke volume variation and cardiac output were not compromised the first five hours. Sham surgery did not influence any of the parameters.
Conclusion
Intraperitoneal fecal contamination leads to a rapid and pronounced intraperitoneal increase in lactate, decrease in glucose while pyruvate and glycerol levels remain unchanged. This distinct metabolic pattern of peritoneal inflammation can be easily detected by microdialysis. Observation of this pattern may minimize time to safe diagnosis of intestinal perforations after intraperitoneal fecal contamination.
Introduction
Undetected anastomotic leakage (AL) leads to peritonitis and may represent a life-threatening complication after major abdominal surgery. Both short- [Citation1,Citation2] and long-term [Citation3] morbidity and mortality increase, the short-term survival being dependent on reintervention after AL [Citation1,Citation2]. The incidence of AL after colorectal surgery has been reported between 5% and 19%, depending on the location of the performed anastomosis, the investigated cohort and probably also on AL definitions, which differed widely between studies [Citation4]. Currently, detection of AL is based on clinical examination, analyses of circulating inflammatory parameters, hemodynamic monitoring, and radiological imaging. All methods have low sensitivity and specificity for early detection of AL [Citation5–7], increasing the risk of progress to sepsis with activation of the innate immune system. Activation of the complement system, cytokines IL-6 and IL-10, as well as coagulation system are hallmarks of this response [Citation8]. The latest Surviving Sepsis Campaign guidelines [Citation9] highlight that delayed initiation of sepsis treatment is known to worsen patient outcome [Citation10–12].
Using intraperitoneal microdialysis for assessment of metabolites from glucose breakdown, alone [Citation13–17] or in combination with inflammatory markers [Citation18,Citation19], have shown to be useful in detection of AL. However, clinical studies have revealed low predictive values, and defined patterns enabling specific diagnosis of peritonitis is lacking [Citation20]. Inflammation is hallmarked by activation of leukocytes, which consume glucose and generate lactate, despite the presence of oxygen [Citation21,Citation22]. Comparable metabolic changes were reported in previous studies investigating intraperitoneal microdialysis in patients developing AL [Citation14,Citation17]. Observing the metabolic pattern after a controlled fecal contamination of the peritoneum may serve the interpretation of microdialysis results in future clinical studies.
In this study, we aimed to describe the pattern of intraperitoneal inflammation and metabolism after controlled peritoneal fecal contamination induced peritonitis in pigs. Changes in intraperitoneal microdialysis were observed for 10 h and related to systemic hemodynamic parameters and circulating inflammatory markers. We hypothesized that intraperitoneal microdialysis allows detection of peritonitis prior to changes in standard systemic clinical parameters.
Materials and methods
Animals
Six Norwegian landrace pigs (Sus scrofa domesticus) with a body weight of 30 kg (range 27.5-31.5 kg) were included. The experiments were performed in accordance with the Norwegian laboratory animal regulations and in coherence with ARRIVE guidelines [Citation23].
The pigs were premedicated with intramuscular ketamine (20 mg/kg), azaperone (3 mg/kg) and atropine (0.02 mg/kg), supplemented with intravenous (IV) pentobarbital (1–2mg/kg) if required, and transported to the operating theatre. Anesthesia was deepened with additional pentobarbital (1–3mg/kg) and morphine (0.5 mg/kg). Pigs were tracheotomized, and anesthesia maintained with isoflurane 1.0% volume end tidal concentration (0.5–1.5%vol) and IV morphine infusion (1–2mg/kg/h) until no reaction to compressive nose pinch throughout the study period. Mechanical ventilation in a volume-controlled mode was regulated according to PaO2 >12 kPa and pH (7.35–7.45) targets.
Experimental protocol and surgery
ECG electrodes and pulse oximeter were applied, followed by hemodynamic monitoring with a pulmonary artery and central venous catheter through the external jugular vein, one on each side, arterial line in the right common carotid artery, and an arterial catheter with thermistor in the femoral artery (PiCCO Technology, Maquet-Getinge, Göteborg, Sweden). Suprapubic urinary catheter was applied. After a midline laparotomy, four microdialysis catheters (CMA 71, with a 30 mm long 100 kDa cut off membrane, MDialysis, Solna, Sweden) were percutaneously placed between the loops of the small intestine; one in each abdominal quadrant. Two additional microdialysis catheters were inserted into the liver parenchyma. The left transversal colon was opened with a two cm incision and 50 cm3 of autologous diluted feces was spread to all parts of the peritoneum (0.75 g feces/kg body weight in isotone saline to a total volume of 50 cm3) to induce peritonitis. The colon incision and the laparotomy were closed in two layers. Each animal received initial fluid resuscitation (1000 mL for the first two hours) with Ringer acetate to compensate for reduced nutritional intake and reduction of sympathetic tone due to general anesthesia. During the first two hours after fecal contamination, additional fluid could be administered by signs of hypovolemia. Thereafter, Ringer acetate was given at a fixed rate of 10 mL/kg/hour regardless of hemodynamic parameters; additional fluid or vasopressor administration was not allowed. Additional glucose was given if serum glucose was < 3 mM. The pigs were observed for a maximum of 10 h, then euthanized by intravenous injections of pentobarbital, morphine and 50 mM potassium chloride. Five out of six pigs got fecal peritonitis, the sixth pig had sham surgery without fecal instillation and served as control.
Hemodynamics
The PiCCO (Pulse Induced Continuous Cardiac Output)-catheter provided the cardiac output measurements based on transpulmonal thermodilution, hourly recalibration and pulse contour analysis. The systemic vascular resistance (SVR) and stroke volume variation (SVV) were calculated from the same data. Mean pulmonary arterial pressure (MPAP) was obtained continuously from the pulmonary artery catheter.
Microdialysis
The principles of the microdialysis method are thoroughly described by Ungerstedt and colleagues [Citation24]. In brief, the microdialysis catheter consists of a semipermeable membrane that is placed into, or in proximity to, the tissue of interest. A small pump secures the continuous flow (1 µL/min) of perfusion fluid (Voluven, Fresenius Kabi) through the catheter. The obtained dialysate is analyzed bedside for the metabolites lactate, pyruvate, glucose and glycerol (ISCUS Flex Analyzer, MDialysis, Solna, Sweden).
Inflammatory markers
Plasma terminal complement complex (TCC) also termed soluble C5b-9 (sC5b-9) was measured in an enzyme-linked immunosorbent (EIA), previously described in detail [Citation25]. Briefly, the monoclonal antibody aE11, specific for a C9 neoepitope in TCC, was used as capture antibody and a biotinylated monoclonal anti-C6 (Quidel Corporation, San Diego, CA) was used as detection antibody. Both antibodies cross-react with pig epitopes making the assay suitable in detecting porcine as well as human TCC. Plasma IL-6 was analyzed by Quantikine Porcine Immunoassay kits from R&D Systems (Minneapolis, MN), whereas IL-10 was analyzed by a porcine kit from BioSource Invitrogen (Carlsbad, CA). Plasma plasminogen activator inhibitor-1 (PAI-1) was measured in citrate plasma by a porcine PAI-1 kit (Molecular Innovations, Novi, MI).
Data collection
Hemodynamic parameters were collected every 20 s (ICUpilot™, MDialysis, Solna, Sweden). Respiratory parameters and blood gas analysis were collected every hour. The inflammatory markers were sampled from plasma at baseline and every second hour. Microdialysate collected the first 20 min after catheter insertion was discarded. The following 30 min of microdialysate represent baseline. After peritoneal contamination microdialysate was sampled every 30 min throughout the experiment and analyzed bedside. Microdialysis data was sampled from 24 (4 × 6) abdominal- and 12 (2 × 6) hepatic microdialysis catheters. In each animal we calculated the mean of the two catheters so each animal has single mean values at each time point. The hepatic median and IQR values are based on the mean of the two liver catheters. In this observational study, the microdialysis data were not blinded for the investigator as no change in therapy or protocol was allowed.
Statistics
Three of 36 catheters were deleted from the data set, due to catheter malfunction. Missing values and obvious incorrect single measurements were replaced by the average of the value before and after the missing value. By subsequent missing values, the cells were left open as missing data. One pig suffered a shorter period of hypoxia because of an accidentally detached ventilator hose (after seven hours elapsed time), and data for the next two hours was excluded. One of the five peritonitis pigs got an unmanageable sepsis and died after six hours, whereas the remaining four were stable throughout the experiment.
This is an exploratory study where we, based on similar studies, expected to see large changes in target variables of >100%. With assumed low variation in the microdialysis data, we estimated 5 animals to be sufficient to show significant difference. Power calculation on the lactate variable revealed a sample size of 3–5 animals when anticipating 60–70% increase, a significance level of 5% and a power of 80%.
The data were analyzed using SPSS software (IBM, New York, USA). We tested for differences between baseline and values after induction of peritonitis, each pig serving as its own control. A Mixed Model Analysis was applied, performing a pairwise post hoc Bonferroni corrected comparison of each time point to baseline. p-values <.05 were considered statistically significant.
Results
Microdialysis
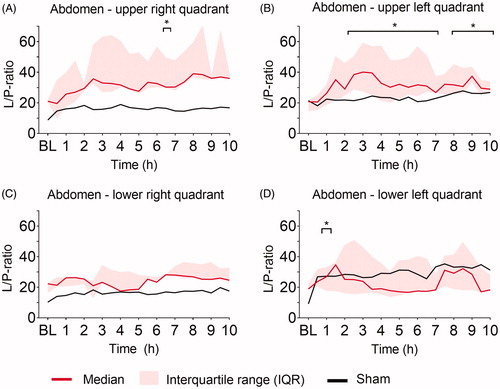
Ninety minutes after induction of peritonitis through left transversal colon incision and fecal instillation, intraperitoneal lactate increased significantly in all four abdominal quadrants (). Intraperitoneal lactate remained elevated throughout the experiment. The sham pig showed no increase in intraperitoneal lactate through the 10 h. The most pronounced lactate increase was observed in the upper quadrants closest to the colonic incision. Hepatic and systemic lactate values did not change significantly from baseline throughout the experiment and were comparable to levels in the sham animal (). Intraperitoneal glucose decreased significantly in all four quadrants within the first two hours after peritoneal contamination and remained low throughout the experiment, whereas hepatic and blood glucose did not change significantly and was comparable to levels in the sham animal (). Pyruvate was significantly increased compared to baseline at single time-points only, the tendency was a higher pyruvate level in all four quadrants compared to the sham (). The lactate-to-pyruvate (L/P)-ratio increased in three out of four quadrants compared to the sham animal but was significantly increased compared to baseline at single-time points only, except for the upper left abdominal quadrant (). Hepatic pyruvate and L/P-ratio in peritonitis pigs were comparable to levels in the sham animal (Supplementary Figure 1). No significant changes in glycerol were found intraperitoneally and hepatically (Supplementary Figure 2). The lactate-to-glucose (L/G)-ratio increased in all four quadrants, but due to large variance in the results caused by very low glucose values in the denominator, there were no significant changes from baseline (Supplementary Figure 3).
Figure 1. Lactate (mM). Lactate at baseline (BL), and the following ten hours (h) after fecal contamination of the peritoneum, measured by microdialysis in (A) upper right, (B) upper left, (C) lower right, (D) lower left abdominal quadrant, (E) liver, and by blood gas analysis in (F) arterial blood. Mixed model with post-hoc comparison to baseline and Bonferroni correction for multiple testing. *p ≤ .05.
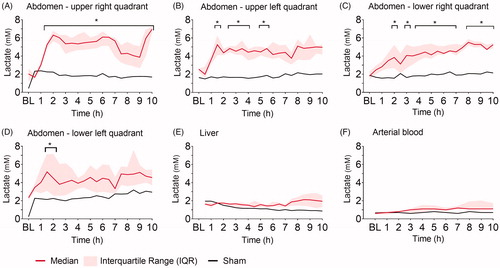
Figure 2. Glucose (mM). Glucose at baseline (BL), and the following ten hours (h) after fecal contamination of the peritoneum, measured by microdialysis in (A) upper right, (B) upper left, (C) lower right, (D) lower left abdominal quadrant, (E) liver, and by blood gas analysis in (F) arterial blood. Mixed model with post-hoc comparison to baseline and Bonferroni correction for multiple testing. *p ≤ .05.
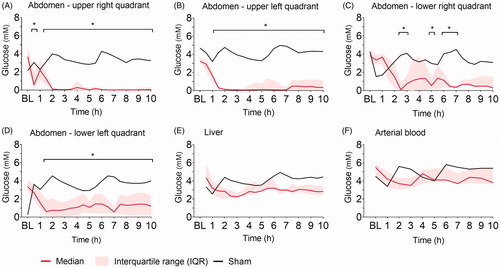
Figure 3. Pyruvate (µM). Pyruvate at baseline (BL), and the following ten hours (h) after fecal contamination of the peritoneum, measured by microdialysis in (A) upper right, (B) upper left, (C) lower right, (D) lower left abdominal quadrant. Mixed model with post-hoc comparison to baseline and Bonferroni correction for multiple testing. *p ≤ .05.
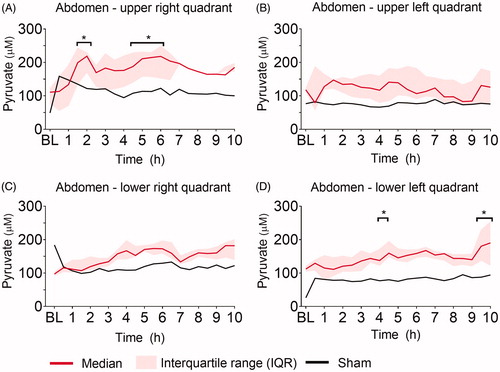
Figure 4. Lactate-to-Pyruvate (L/P)- ratio. L/P-ratio at baseline (BL), and the following ten hours (h) after fecal contamination of the peritoneum, measured by microdialysis in (A) upper right, (B) upper left, (C) lower right, (D) lower left abdominal quadrant. Mixed model with post-hoc comparison to baseline and Bonferroni correction for multiple testing. *p ≤ .05.
Clinical parameters
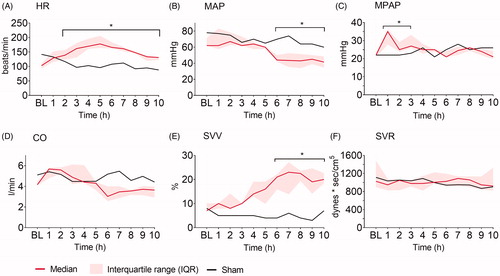
Heart rate (HR) increased and mean arterial pressure (MAP) decreased significantly compared to baseline in animals with fecal peritonitis after two and six hours, respectively (). Mean pulmonary artery pressure (MPAP) was significantly increased during the first three hours after fecal instillation (). Cardiac output (CO) showed a nonsignificant decreasing trend starting at six hours (). Stroke volume variation (SVV) increased significantly compared to baseline after six hours (), while systemic vascular resistance (SVR) remained unchanged throughout the experiment (). The sham animal showed only minor hemodynamic changes throughout the experiment.
Figure 5. Hemodynamic parameters. (A) Heart rate (HR), (B) mean arterial pressure (MAP), (C) mean pulmonary arterial pressure (MPAP), (D) cardiac output (CO), (E) stroke volume variation (SVV), and (F) systemic vascular resistance (SVR) at baseline (BL), and the following ten hours (h) after fecal contamination of the peritoneum. Mixed model with post-hoc comparison to baseline and Bonferroni correction for multiple testing. *p ≤ .05.
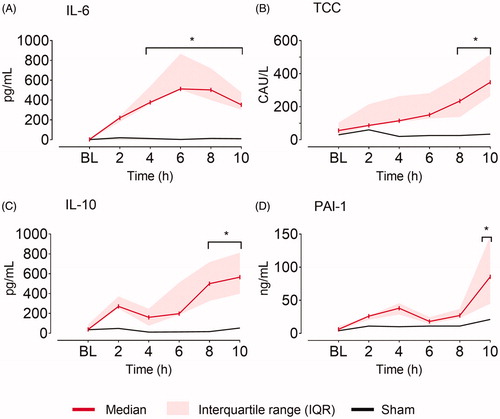
The inflammatory markers slowly increased after fecal instillation. Significant differences compared to baseline were observed after four hours for IL-6, after eight hours for TCC and IL-10 and after 10 h for PAI-1, while the sham animal remained at baseline values throughout the experiment ().
Figure 6. Serum inflammatory markers. (A) Interleukin 6 (IL-6), (B) terminal complement complex (TCC), (C) interleukin 10 (IL-10), and (D) plasminogen activator inhibitor 1 (PAI-1) at baseline (BL), and the following ten hours (h) after fecal contamination of the peritoneum. Mixed model with post hoc comparison to baseline and Bonferroni correction for multiple testing. *p ≤ .05.
Discussion
Intraperitoneal microdialysis showed rapid and distinct increase in intraperitoneal lactate in all four quadrants starting one hour after induction of peritonitis. Concurrently, intraperitoneal glucose was very low. While intraperitoneal lactate and glucose were highly pathologic, systemic lactate and glucose remained stable within normal range and without major changes throughout the course of the experiment. Peritoneal contamination lead to an inflammatory hypodynamic circulation, with systemic hemodynamic parameters significantly different from baseline after six hours and systemic inflammatory markers significant after four to 10 h. This affirms the systemic inflammation due to peritonitis.
Microdialysis
Clinical studies on postoperative AL detection by microdialysis have shown that lactate and glucose may be superior in detecting AL compared to systemic parameters of circulation. However, a recent review highlights that only low predictive values are achieved using intraperitoneal microdialysis [Citation20]. In this study, we show that sudden increase in lactate and drop in glucose after 1.5 h of controlled peritoneal contamination is detected in all four quadrants. Nevertheless, differences between quadrants were observed. These differences may be due to technical difficulties in obtaining even fecal distribution between all intestinal loops, bowel peristaltic could have caused uneven stool-spread over time, and gravity could lead to uneven distribution over time as the pig was placed in the right lateral position. For lactate the largest effects were seen in the right quadrants facing downwards. Probably, it is best to detect a leakage close to the anastomosis [Citation26], but after a while when the peritonitis has become diffuse, it is also possible to detect the AL with catheters placed in distant abdominal locations. We were able to capture this by placing catheters in all four quadrants and follow the development of the diffuse peritonitis over time.
The observed pattern after fecal contamination in this study consists of decreasing glucose, increasing lactate, combined with normal to increased pyruvate levels and absence of glycerol increase is in line with previous clinical microdialysis studies of AL detection [Citation14,Citation17]. The mechanism behind the findings is that inflammation intensely activates leucocytes, which are using aerobic glycolysis in addition to degradation of pyruvate to lactate, that is, the Warburg effect [Citation27]. As no ischemia occurs, cell membrane damage is absent, and glycerol remains low. Pyruvate is normal to slightly elevated and consequently L/P-ratio inconsistently increased, probably dependent on glucose supply. Thus, we observed elevated intraperitoneal lactate levels and low glucose values and moderately increased L/P-ratio with no signs of hypoperfusion or ischemia, making the observed pattern distinctive for inflammation. Future clinical studies should therefore focus on this aggregated pattern of decreased glucose, increased lactate, normal to increased pyruvate, moderately increased L/P-ratio and low glycerol, rather than single measures of glucose or lactate, which may over-come the low predictive values in detecting AL.
Hemodynamics
In this study, only heart rate and mean pulmonary artery pressure increased within the first hours after fecal contamination, whereas cardiac output and MAP started to decline first after 5 h reflecting a hemodynamic unstable situation. A recent study on physiological changes after colorectal surgery, identified a significantly increased heart rate on postoperative day one to be associated with AL [Citation28], but the specificity of these findings is low, since several factors (like postoperative hypovolemia and pain) also induce tachycardia. After five hours of fecal contamination, hemodynamic signs of systemic inflammation became apparent, which are in line with previous studies on induced porcine peritonitis and hemodynamics [Citation29]. The clinical triad hypotension, decreased cardiac output, and increased systemic vascular resistance defines the first phase in human septic shock. In this study, only mean arterial pressure was significantly decreased within 10 h of fecal contamination, highlighting that systemic changes develop over a relatively long time-period and hemodynamic monitoring can therefore not be used for early detection of AL. Of note, all peritonitis pigs showed an early, time-limited increase in MPAP. This is characteristic for pigs and is a result of an inflammatory response caused by pulmonary intravascular macrophages [Citation30], but does not hinder translation to the human situation [Citation31].
Biomarkers
The increase in serum inflammatory markers several hours after fecal contamination underlines that peritoneal inflammation leads to systemic inflammation. IL-6 was significantly different from baseline four hours after contamination, followed by IL-10 and TCC after eight hours. Thus, also systemic inflammatory markers show time delay compared to metabolic changes in the peritoneal cavity detected by microdialysis. We analyzed serum inflammatory markers to monitor the presence of a systemic inflammation, not to identify the inflammation focus, in our case the AL. Expanding the analysis to measuring cytokines in the microdialysate or drain fluid could lead to earlier detection of intraperitoneal inflammation than measurement of systemic cytokines in the context of AL [Citation5]. Our focus being on bedside detection of AL, such analyses were not conducted. Amongst 206 patients undergoing colorectal surgery, AL patients showed significantly higher levels of systemic IL-6 than nonleakage patients, but with poor predictive values [Citation32]. IL-6 and IL-10 from peritoneal drain fluid yielded fair prediction values in the same analysis. Another study of a similar population showed no difference in postoperative IL-6 serum levels between patients with or without subsequent AL [Citation33]. Ellebaek et al found a difference between leakage and non-leakage patients in serum cytokine concentration by early, yet not by late AL [Citation34]. The impact of major surgery itself triggers cascades of cytokines between trauma and healing [Citation35]. Taken together, the association of cytokines to AL is still unclear and intraperitoneal detection of altered metabolism stands currently out as clinically more promising and feasible to use bedside.
Limitations
The number of study pigs is small and with only one sham. However, the low variability in the data provided significant differences, the sham solely served for graphical presentation of the normal situation and use of additional animals was considered unnecessary in regard to animal well-fare regulations aiming at reducing numbers of animals in research. Unlike common clinical practice, we did not correct hypotension by fluid resuscitation or vasopressor administration. The purpose was to emphasize the hemodynamic impact of the inflammation. Thus, regional ischemia might have been introduced. However, arterial and hepatic lactate remained low throughout the experiment, and ischemic hyperlactatemia was thus not present, and we consider a severe hypoperfusion unlikely. The use of a high cut-off (100 kDa)-, rather than a 20 kDa-catheter could result in a loss of perfusion fluid and dilution of the sampled metabolites [Citation36], however, we have shown that this can be prevented by using a colloidal perfusion fluid applied in this study [Citation37]. Because of the experimental time frame of 10 h our study lacks information about the later postoperative course. This study models a peritonitis by surgical bowel perforation and fecal instillation, which theoretically could cause another biochemical pattern than a leaking surgical anastomosis in a clinical setting. However, we regarded the controlled state of inflammation as necessary to be able to discriminate inflammatory from ischemic changes.
Future implications
Improved definition of the metabolic and inflammatory pattern after AL may contribute to development and improvement of decision algorithms. The use of the herein described metabolic pattern to develop an algorithm, which could e.g. trigger a diagnostic CT, even prior to clinical signs of infection, is interesting for clinical application. The consequence could be earlier initiation of antibiotic treatment with radiological and/or surgical intervention. Based on the results from this animal study and another yet unpublished study, we are evaluating the abdominal metabolic pattern in an ongoing clinical trial (NCT03631173) using microdialysis in detection of anastomotic leakage after Whipple’s surgery. The microdialysis catheter is placed in close vicinity to the pancreaticojejunal anastomosis. A leakage in this anastomosis is detected as elevated glycerol values due to pancreatic lipases splitting triglycerides to free fatty acids and glycerol. However, also after a chemical leakage of pancreatic enzymes an inflammatory process starts. Preliminary results indicate that the pattern of increased lactate, decreased glucose and somewhat increased L/P-ratio caused by this peritoneal inflammation corroborate the results from this animal study.
Conclusion
A rapid and pronounced increase in intraperitoneal lactate, decrease in intraperitoneal glucose simultaneous with unchanged to increased pyruvate and glycerol levels monitored by microdialysis was observed after peritoneal instillation of feces and revealed a distinct metabolic pattern of inflammation. Intraperitoneal microdialysis detected peritonitis earlier than standard clinical monitoring, and especially the observed metabolic pattern of inflammation should be further evaluated in clinical studies.
Supplemental online material
PDF of Data supplement uploaded.
Supplemental Material
Download PDF (408 KB)Disclosure statement
No potential conflict of interest was reported by the author(s).
Data availability statement
Any data available on request.
Additional information
Funding
References
- Bakker IS, Grossmann I, Henneman D, et al. Risk factors for anastomotic leakage and leak-related mortality after colonic cancer surgery in a nationwide audit. Br J Surg. 2014;101(4):424–432; discussion 32.
- Boström P, Haapamäki MM, Rutegård J, et al. Population-based cohort study of the impact on postoperative mortality of anastomotic leakage after anterior resection for rectal cancer. BJS Open. 2019;3(1):106–111.
- Mirnezami A, Mirnezami R, Chandrakumaran K, et al. Increased local recurrence and reduced survival from colorectal cancer following anastomotic leak: systematic review and meta-analysis. Ann Surg. 2011;253(5):890–899.
- McDermott FD, Heeney A, Kelly ME, et al. Systematic review of preoperative, intraoperative and postoperative risk factors for colorectal anastomotic leaks. Br J Surg. 2015;102(5):462–479.
- Su'a BU, Mikaere HL, Rahiri JL, et al. Systematic review of the role of biomarkers in diagnosing anastomotic leakage following colorectal surgery. Br J Surg. 2017;104(5):503–512.
- Kornmann VN, Treskes N, Hoonhout LH, et al. Systematic review on the value of CT scanning in the diagnosis of anastomotic leakage after colorectal surgery. Int J Colorectal Dis. 2013;28(4):437–445.
- Hirst NA, Tiernan JP, Millner PA, et al. Systematic review of methods to predict and detect anastomotic leakage in colorectal surgery. Colorectal Dis. 2014;16(2):95–109.
- Skjeflo EW, Sagatun C, Dybwik K, et al. Combined inhibition of complement and CD14 improved outcome in porcine polymicrobial sepsis. Crit Care. 2015;19(1):415.
- Rhodes A, Evans LE, Alhazzani W, et al. Surviving Sepsis Campaign: International Guidelines for Management of Sepsis and Septic Shock: 2016. Crit Care Med. 2017;45(3):486–552.
- Pruinelli L, Westra BL, Yadav P, et al. Delay within the 3-hour surviving sepsis campaign guideline on mortality for patients with severe sepsis and septic shock. Crit Care Med. 2018;46(4);500–505.
- Ferrer R, Martin-Loeches I, Phillips G, et al. Empiric antibiotic treatment reduces mortality in severe sepsis and septic shock from the first hour: results from a guideline-based performance improvement program. Crit Care Med. 2014;42(8):1749–1755.
- Peltan ID, Brown SM, Bledsoe JR, et al. ED door-to-antibiotic time and long-term mortality in sepsis. Chest. 2019;155(5):938–946.
- Verdant CL, Chierego M, De Moor V, et al. Prediction of postoperative complications after urgent laparotomy by intraperitoneal microdialysis: A pilot study. Annals of Surgery. 2006;244(6):994–1002.
- Ellebaek Pedersen M, Qvist N, Bisgaard C, et al. Peritoneal microdialysis. Early diagnosis of anastomotic leakage after low anterior resection for rectosigmoid cancer. Scand J Surg. 2009;98(3):148–154.
- Ellebaek M, Qvist N, Fristrup C, et al. Mediastinal microdialysis in the diagnosis of early anastomotic leakage after resection for cancer of the esophagus and gastroesophageal junction. Am J Surg. 2014;208(3):397–405.
- Daams F, Wu Z, Cakir H, et al. Identification of anastomotic leakage after colorectal surgery using microdialysis of the peritoneal cavity. Tech Coloproctol. 2014;18(1):65–71.
- Ellebaek MB, Rahr HB, Boye S, et al. Detection of early anastomotic leakage by intraperitoneal microdialysis after low anterior resection for rectal cancer: a prospective cohort study. Colorectal Dis. 2019;21(12):1387–1396.
- Matthiessen P, Strand I, Jansson K, et al. Is early detection of anastomotic leakage possible by intraperitoneal microdialysis and intraperitoneal cytokines after anterior resection of the rectum for cancer? Dis Colon Rectum. 2007;50(11):1918–1927.
- Oikonomakis I, Jansson D, Hörer TM, et al. Results of postoperative microdialysis intraperitoneal and at the anastomosis in patients developing anastomotic leakage after rectal cancer surgery. Scand J Gastroenterol. 2019;54(10):1261–1268.
- Ellebaek MB, Daams F, Jansson K, et al. Peritoneal microdialysis as a tool for detecting anastomotic leakage in patients after left-side colon and rectal resection. A systematic review. Scand J Gastroenterol. 2018;53(12):1625–1628.
- Hume DA, Radik JL, Ferber E, et al. Aerobic glycolysis and lymphocyte transformation. Biochem J. 1978;174(3):703–709.
- Vander Heiden MG, Cantley LC, Thompson CB. Understanding the Warburg Effect: The Metabolic Requirements of Cell Proliferation. Science. 2009;324(5930):1029–1033.
- Kilkenny C, Browne WJ, Cuthill IC, et al. Improving bioscience research reporting: The ARRIVE Guidelines for reporting animal research. PLoS Biol. 2010;8(6):e1000412.
- Ungerstedt U. Microdialysis-principles and applications for studies in animals and man. J Intern Med. 1991;230(4):365–373.
- Mollnes TE, Lea T, Froland SS, et al. Quantification of the terminal complement complex in human plasma by an enzyme-linked immunosorbent assay based on monoclonal antibodies against a neoantigen of the complex. Scand J Immunol. 1985;22(2):197–202.
- Jansson K, Strand I, Redler B, et al. Results of intraperitoneal microdialysis depend on the location of the catheter. Scand J Clin Lab Invest. 2004;64(1):63–70.
- Warburg O. On the origin of cancer cells. Science. 1956;123(3191):309–314.
- Stearns AT, Liccardo F, Tan KN, et al. Physiological changes after colorectal surgery suggest that anastomotic leakage is an early event: a retrospective cohort study. Colorect Dis. 2019;21(3):297–306.
- Park I, Lee JH, Jang D-H, et al. Characterization of fecal peritonitis-induced sepsis in a porcine model. J Surg Res. 2019;244:492–501.
- Winkler GC. Pulmonary intravascular macrophages in domestic animal species: Review of structural and functional properties. Am J Anat. 1988;181(3):217–234.
- Pischke SE, Hestenes S, Johansen HT, et al. Sepsis causes right ventricular myocardial inflammation independent of pulmonary hypertension in a porcine sepsis model. PLoS One. 2019;14(6):e0218624.
- Sammour T, Singh PP, Zargar-Shoshtari K, et al. Peritoneal cytokine levels can predict anastomotic leak on the first postoperative day. Dis Colon Rectum. 2016;59(6):551–556.
- Reisinger KW, Poeze M, Hulsewe KW, et al. Accurate prediction of anastomotic leakage after colorectal surgery using plasma markers for intestinal damage and inflammation. J Am Coll Surg. 2014;219(4):744–751.
- Ellebaek MB, Baatrup G, Gjedsted J, et al. Cytokine response in peripheral blood indicates different pathophysiological mechanisms behind anastomotic leakage after low anterior resection: a pilot study. Tech Coloproctol. 2014;18(11):1067–1074.
- Ni Choileain N, Redmond HP. Cell response to surgery. Arch Surg. 2006;141(11):1132–1140.
- Sabroe JE, Ellebaek MB, Qvist N. Intraabdominal microdialysis - methodological challenges. Scand J Clin Lab Invest. 2016;76(8):671–677.
- Khan F, Pharo A, Lindstad JK, et al. Effect of perfusion fluids on recovery of inflammatory mediators in microdialysis. Scand J Immunol. 2015;82(5):467–475.