
Abstract
Background and objectives
Fatty liver disease (FLD) and hypertension are separately associated with cardiovascular (CV) mortality. The two conditions are related in multiple ways. This work aimed to study the joint effect and interaction of FLD and hypertension in respect to overall and CV mortality.
Methods
The population-based cohort, Kuopio Ischaemic Disease Risk Factor Study, followed 1569 middle-aged non-diabetic Finnish men for 34 years. Considering adjustment for age, body mass index, smoking and alcohol consumption, separate and combined effects of FLD and hypertension and their interaction at the multiplicative and additive scales regarding all-cause and CV death were assessed using Cox proportional hazards models.
Results
FLD and hypertension coexisted in 8.54% of the men (n = 134). FLD and hypertension associated, independently and combined, with an increased hazard of all-cause and CV deaths. Non-CV mortality associated with FLD, but not with hypertension. We found a negative interaction between FLD and hypertension regarding the hazard of all-cause (relative excess risk due to interaction (RERI), −0.97; 95% confidence interval (CI), −1.65 to −0.28) and CV mortality (RERI, −1.74; 95% CI, −2.98 to −0.5). The interaction was also found on a multiplicative scale.
Conclusions
We found evidence of a negative interaction between FLD and hypertension in respect to CV mortality. We thus recommend adjusting for FLD or hypertension when studying the effect of the other condition on mortality or CV diseases in middle-aged men.
Introduction
Fatty liver disease (FLD) is a state of accumulation of lipids in hepatic tissues clinically classified as alcoholic and non-alcoholic FLD [Citation1]. It is estimated that at least a quarter of the world’s population has a form of FLD [Citation2]. With a heavier disease burden than its implication in liver cirrhosis and hepatic carcinoma, FLD has recently emerged as a risk factor for cardiovascular (CV) mortality independently of obesity, dyslipidemia, diabetes mellitus and other risk factors commonly associated with it [Citation3,Citation4].
Hypertension is the most common CV risk factor and leader in CV death [Citation5]. As FLD, the association of hypertension with CV diseases is considered independent. However, hypertension is related to FLD in multiple ways. First, FLD and hypertension are highly prevalent and co-prevalent as they both associate with the metabolic syndrome. More than 1 billion humans live with hypertension, and about half of them present FLD [Citation6]. Second, multiple studies have demonstrated hypertension to be a determinant of FLD with the evidence of a biological gradient between blood pressure levels on the one hand, and the risk of onset of FLD and fibrosis progression on the other hand [Citation7–9]. Third, FLD has associated with the incidence of hypertension in many studies, independently of obesity and other cardiometabolic risk factors. A biological gradient also exists between the progression or resolution of FLD and the incidence of hypertension [Citation7,Citation10–12].
While the two conditions are established as separate predictors of CV outcomes, the bidirectional relationship of FLD and hypertension and their shared associations with cardiometabolic risk factors suggest that a biological interaction in respect to CV disease outcomes could exist between FLD and hypertension. It is also possible that either FLD or hypertension could partially mediate the association between the other condition and CV disease outcomes. Interactions across independent variables can be multiplicative or additive. An interaction between two conditions occurs when the effect related to the co-existence of the two conditions differ from the product (interaction on a multiplicative scale) or the sum (interaction on an additive scale) of their individual effects. In this study, we investigated the joint effect and interaction of FLD and hypertension regarding CV mortality using an interaction framework.
Methods
Data source
The participants of this study are middle-aged men who enrolled in the Kuopio Ischaemic Heart Disease Risk Factor Study (KIHD). The KIHD is an ongoing population-based cohort that includes 2682 randomly sampled Finnish men who lived in the region of Kuopio between March 1984 and December 1989 [Citation13]. The participants provided informed consent and, through the cause-of-death registry of Finland (license TK-53-1770-16) and the Finnish Care Register for Healthcare (license THL/93/5.05.00/2013), we assessed the men’s status of health on an annual basis.
As FLD prevalence is highest among individuals with diabetes mellitus [Citation14], and because of the documented impact of diabetes mellitus on FLD progress and association with CV diseases [Citation15], we excluded participants with diabetes mellitus at baseline (n = 162). We also excluded men who reported abstinence from alcohol drinking at baseline (n = 366) as they differed from other study participants in terms of overall health, health behaviors, education level and socioeconomic status [Citation16]. Moreover, we excluded 585 men with missing values to settle for a total of 1569 men included in this study. The men were followed-up for a median of 29 years, and a maximum of 34 years with no loss to follow-up.
Variable measurement
As an indicator of the presence or absence of FLD, we computed the fatty liver index (FLI) using Bedogni et al. [Citation17] equation. The equation relies on waist circumference, body mass index (BMI), serum triglyceride and serum gamma-glutamyl transferase concentrations. In line with this, we considered FLI values < 30 as normal and values ≥60 as indicative of fatty liver [Citation18]. We defined hypertension as either (i) self-reported hypertension and a confirmed use of antihypertension medication or (ii) a mean systolic ≥160 or diastolic ≥105 blood pressure on baseline examination. The choice of the blood pressure measurement threshold to define hypertension was based on a sensitivity analysis.
All study participants were seen at baseline by a physician who conducted a physical examination and a research nurse who measured the participants’ height, waist circumference, weight and blood pressure. Blood pressure assessment comprised an average of six measurements combining sitting, laying and standing. The participants were also interviewed at baseline regarding their medical history and they filled detailed structured questionnaires to self-report their smoking status, alcohol consumption, illnesses and medications. Blood samples were drawn from study participants at baseline. The procedures for collection, process and analysis of blood samples are described elsewhere [Citation19].
Age in years, BMI (categorical variable with cut points: 25, 27.5, 30 and 32.5 kg/m2; ≤25 considered as the normal weight category), smoking status (never smoker, previous smoker, current smoker) [Citation20], BMI-smoking interaction [Citation21] and alcohol consumption in grams per week were considered as covariates as they associate with FLD, hypertension and CV outcomes in general.
In our study, we considered as outcomes of interest: all-cause mortality, CV mortality (International Statistical Classification 10th revision (ICD-10) codes I) and non-CV mortality (codes other than I). Mortality data were obtained using the cause-of-death registry [Citation22].
Data analysis
Study participants’ baseline characteristics were compared across categories of FLI and hypertension and between survivors and non-survivors using Chi-square, Kruskal–Wallis and Mann–Whitey’s U tests.
The total effect of separate and combined FLD and hypertension and their interaction regarding all-cause and CV mortality were assessed in terms of hazard ratios (HRs) using Cox proportional hazards regression with the duration from baseline until death or 31 December 2018 as the period at risk for each study participant. We defined a composite variable (FLD.hypertension) to indicate different combinations of FLD and hypertension categories. For each CV event as outcome, we fitted six types of Cox proportional hazard models: (1) age-adjusted models (only including age as a covariate; FLD:hypertension as the exposure variable), (2) fully adjusted models (adjusted for age, BMI, smoking status, BMI-smoking interaction and alcohol consumption; FLD:hypertension as the exposure variable), (3) age-adjusted interaction models (age-adjusted; FLD, hypertension and the interaction term FLD:hypertension as exposure variables), (4) fully adjusted interaction models, (5) FLD-stratified models (fully adjusted, stratified on FLD; hypertension as the exposure variable) and (6) hypertension-stratified models (fully adjusted, stratified on hypertension; FLD as the exposure variable).
Departing from the absolute effects of the composite FLD:hypertension variable in the Cox proportional hazards models, we computed the relative excess risk due to interaction (RERI) and the synergy index as measures of the additive interaction between FLD and hypertension [Citation23,Citation24]. We estimated the interaction measures’ 95% confidence interval (CI) using the delta method by Hosmer and Lemeshow [Citation25]. We also reported the FLD–hypertension interaction on the multiplicative scale. In addition, we run an analysis with 31 December 2003 as a limit date of follow up to check if our findings are biased by the extended follow up time.
To determine the threshold for diagnosing inaugural hypertension using baseline visit blood pressure measurements in patients who were not on antihypertensive medication at baseline, we conducted a sensitivity analysis using, as dependent variables, main results from the fully adjusted Cox regression models on mortality hazard and interaction between FLD and hypertension. As changing variables, we used (i) mean diastolic blood pressure with cutoff values ranging from 80 to 120 mm Hg, (ii) mean systolic blood pressure with cutoff values ranging from 130 to 190 mm Hg and (iii) pulse pressure (the difference between mean systolic and mean diastolic blood pressure at baseline) with cutoff values ranging from 30 mm Hg and 65 mm Hg.
We conducted all computations using R version 4.0.3 (R Foundation for Statistical Computing, Vienna, Austria) (https://www.R-project.org) and built the models using the R package Survival Analysis – version 3.2-7 (https://CRAN.R-project.org/package = survival).
Results
During the 34 years of follow-up, we registered 933 (59.46%) all-cause deaths, 44.16% of which were CV deaths (n = 412). There was a higher proportion of hypertension among the non-survivors (26.80% vs. 14.47%, p < .001). Survivors tended to be younger (median age, 48.9 vs. 54.5 years; p < .001), to have a lower BMI (median, 25.83 vs. 26.71 kg/m2; p < .001), to have a lower proportion of smokers at baseline (22.64 vs. 43.30%; p < .001) and to consume less alcohol (median, 36.60 vs. 47.80 g/week; p = .001) than the non-survivors, and they had a lower median FLI score (28.66 vs. 38.19; p < .001).
Among the studied participants, 23.71% had FLD (n = 372) and 21.80% had hypertension (n = 342) at baseline. 8.54% of the men presented with both FLD and hypertension (n = 134). The participants’ characteristics varied across FLI and hypertension categories, and so did survival in term of all-cause and CV mortality, but not in term of non-CV mortality ().
Table 1. Baseline characteristics and follow-up differences by fatty liver index (FLI) and hypertension (HTN).
The results of the Cox regression analysis () of the fully adjusted models showed an association of FLD and hypertension, independently and combined, with an increased hazard of all-cause and CV deaths. Non-CV mortality associated with FLD, but not with hypertension. Men who smoked at baseline were four times as likely to die than never smokers (HR, 4.05; 95% CI, 2.91–5.61) with even a greater hazard of CV mortality (HR, 5.66; 95% CI, 3.21–9.97). Men with a BMI over 32.5 kg/m2 had double the hazard of all-cause mortality (HR, 2.18; 95% CI, 1.15–4.14) and triple the hazard of CV mortality (HR, 3.18; 95% CI, 1.15–8.77) than men with a BMI under 25 kg/m2. Alcohol consumption associated with an increased risk of CV and non-CV (Supplementary material 1).
Table 2. Hazard ratios (HRs) of FLD and hypertension for mortality and cardiovascular outcomes in the study population (n = 1569).
In the sensitivity analysis, HRs of all-cause and CV mortality of the main FLI and hypertension categories, in comparison to the (normal FLI, no hypertension) category, varied scantly with changes of systolic, diastolic and pulse pressure cutoff points (Supplementary material 2).
Interaction analysis
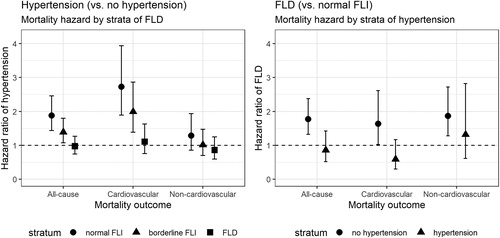
illustrates HRs and their related 95% CI for (i) the association between hypertension and mortality across strata of FLD and (ii) the association between FLD and mortality across strata of hypertension. An increased risk of all-cause and CV mortality was associated with hypertension in the normal and borderline FLI strata and with FLD in the no-hypertension stratum. These associations were not significant in the other strata. Despite, the HRs of the association between hypertension and mortality outcomes appeared to decrease with FLI increase, and of the association between FLD and mortality outcomes to decrease in the presence of hypertension (Supplementary material 3).
Figure 1. Fully adjusted hazard ratios (HRs) with 95% CIs for all-cause mortality, cardiovascular mortality and non-cardiovascular mortality stratified by fatty liver index and hypertension categories. FLD: fatty liver disease; FLI: fatty liver index.
The analysis of the fully adjusted Cox proportional hazard models that included an interaction term between FLI categories and hypertension suggested a multiplicative negative interaction between FLD and hypertension regarding the hazard of all-cause (HR, 0.51; 95% CI, 0.35–0.74) and CV mortality (HR, 0.38; 95% CI, 0.23–0.64). Computation of the interaction on additive scale affirmed the negative interaction between FLD and hypertension regarding all-cause (RERI, −0.97; 95% CI, −1.65 to −0.28) and CV mortality (RERI, −1.74; 95% CI, −2.98 to −0.5) (). In the analysis limiting the follow up to 31 December 2003, the results of both the age-adjusted and fully adjusted models remained significant for CV mortality.
Table 3. Estimates of the biological interaction of fatty liver disease and hypertension on mortality and cardiovascular outcomes.
Supplementary material 4 illustrates the sensitivity analysis results for the p value of the RERI for the interaction between FLD and hypertension in respect to the hazard of all-cause and CV mortality at different cutoff points of blood pressure measures defining hypertension. The interaction results were significant at definitions of hypertension using blood pressure cutoff points ≥149/104 mm Hg. The RERI measure of interaction had the lowest p values at a definition of hypertension using a systolic blood pressure cutoff point of 160–161 mm Hg and a diastolic blood pressure cutoff point of 105 mm Hg. The results remained significant at a hypertension cutoff point of 180/110 mm Hg. Supplementary material 4 is presented as an interactive plot in Supplementary material 4(a,b).
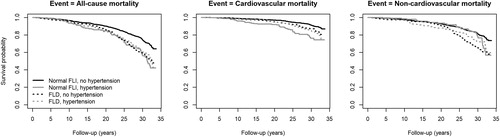
The survival curves of the fully adjusted models, stratified by FLD and hypertension categories, are shown in . Among the categories, the (normal FLI, no hypertension) category had the best survival probability throughout the follow up period. In comparison to the (FLD, hypertension) category, (normal FLI, hypertension) had a similar overall probability of survival with all-cause mortality as the outcome and a lower overall probability of survival with CV mortality as the outcome. In term of non-CV mortality, (normal FLI, hypertension) survival curve was close to (normal FLI, no hypertension). Kaplan–Meier’s crude survival curves presented in closely similar patterns (Supplementary material 5).
Figure 2. Fully adjusted survival curves for all-cause mortality, cardiovascular mortality and non-cardiovascular mortality. FLI: fatty liver index.
Discussion
We proved a negative interaction between FLD and hypertension vis-à-vis all-cause and CV mortality on both the additive and the multiplicative scales in non-diabetic middle-aged men. While FLD and hypertension associated, both separately and combined, with a substantial risk of all-cause and CV mortality, the co-existence of the two conditions associated with a similar or lower overall hazard of mortality than the individual conditions. This negative interaction (RERI for CV mortality, −1.74; 95% CI, −2.98 to −0.5) is suggestive that FLD and hypertension are not independent of each other regarding their effect on CV mortality. To the best of our knowledge, no other study assessed the interaction between FLD and hypertension on survival.
Our findings raise the possibility for different mechanistic interaction hypotheses. Mutual antagonism is a possible explanation, where each of FLD and hypertension causes the outcome alone, but when they coexist, they block each other’s effect [Citation26]. Mediation can also explain, at least partially, the negative interaction between hypertension and FLD as it is already established that at least one of the two conditions can be a precursor of the other. Another explanation of the negative interaction between FLD and hypertension is competitive interaction, in which the outcome is not affected by cumulated exposure of different sources. This explanation could also rely on a fourth factor that stands in the causal pathway between both FLD and CV disease, and hypertension and CV disease. Finally, the results could be related to a factor that confounds FLD, hypertension and CV disease. For instance, a genetic factor that affects lipid metabolism in a way that causes FLD but prevents atherosclerosis, such as the I148M variant in patatin-like phospholipase domain-containing protein 3 (PNPLA3) [Citation27], would be a possibility for our findings if this genetic factor also induces hypertension. A genetically homogeneous population such as our study’s favors genetic explanations.
Given the low reliability of single attended office blood pressure measurement in establishing hypertension diagnosis [Citation28], the current guidelines for diagnosing hypertension on a single office visit can only be made if there is evidence of CV disease and blood pressure measurements higher than 180/110 mm Hg [Citation29]. Relying on these criteria would, however, underestimate the diagnosis of hypertension in our study participants. We conducted a sensitivity analysis to allow an optimal blood pressure measurement cutoff point for the diagnosis of hypertension. Our findings were robust to different blood pressure thresholds, but we found that a cutoff point of 160/105 was the best for our study of the FLD–hypertension interaction on mortality. The sensitivity analysis also suggests that our findings could be more pronounced at high blood pressure values.
Strengths and weaknesses
Our study is strong by its quality of data, its adequate sample size and follow-up time, and its solid methodology. We adjusted our models for age, BMI, tobacco smoking and alcohol consumption, and restricted our data by sex, ethnicity and population stratification, and diabetes status. We did not adjust for diet and physical activity although they associate with our independent and dependent variables of interest, but adjusting for BMI was considered sufficient to block their related backdoor paths according to the counterfactual causal model [Citation30]. Based on what we knew from the literature, we estimated that our adjustment is sufficient to control for confounding for the effect of FLD and for the effect of hypertension on mortality and CV outcomes and, therefore, to infer causal interaction. Our findings are unlikely to be the result of a bias induced by the adjustment for covariates since the age-only-adjusted models yielded very close results.
Due to the bidirectional relationship between FLD and hypertension, time-varying confounding could be a serious source of bias in our study. Marginal structural modeling could handle this issue and extend our study. Also, for our findings to have an implication on the mechanistic interaction between FLD and hypertension, an assumption on the monotonicity of the effects of FLD and hypertension on CV mortality is required. This assumption might not be solid considering this bidirectional relationship between FLD and hypertension. Moreover, our findings have a limited generalizability as they concern only middle-aged non-diabetic Finnish men. While we used a sensitivity analysis to consider different thresholds defining hypertension, an ascertainment of the hypertension diagnosis through out-of-office blood pressure measurements would have brought more confidence to our findings. Nevertheless, our findings are clearly valid at high blood pressure values. Another improvement of our study would include a wider range of the population involving diabetic individuals and consider hypertension subtypes and levels of control. Also, FLD assessment could benefit from a better measurement method such as liver ultrasonography, or ideally, liver biopsy. Finally, mediation and pathway analyses could be another extension of our study.
Conclusions
A negative interaction was found between FLD and hypertension regarding all-cause and CV mortality. We recommend adjusting for FLD or hypertension when studying the effect of the other condition on mortality or CV diseases in middle-aged men.
Supplemental Material
Download TIFF Image (7.7 MB)Supplemental Material
Download TIFF Image (9.3 MB)Supplemental Material
Download MS Word (22.9 KB)Supplemental Material
Download PDF (286.8 KB)Supplemental Material
Download MS Word (27.3 KB)Acknowledgements
Ethical approval and licenses: The study protocol was approved by the Research Ethics Committee of the University of Eastern Finland and the Research Ethics Committee Hospital District of Northern Savo, Finland (no. 143/97), and each participant gave written informed consent. The KIHD Study was performed in accordance with the Declaration of Helsinki. Cause of Death registry – Statistics Finland (license TK-53-1770-16). Care Register for Healthcare – National Institute for Health and Welfare (license THL/93/5.05.00/2013).
Disclosure statement
The authors declare no conflict of interest.
Data availability statement
The University of Eastern Finland can be approached for requests of access to the KIHD dataset.
References
- Brunt EM. Nonalcoholic steatohepatitis: definition and pathology. Semin Liver Dis. 2001;21(1):3–16.
- Paik JM, Golabi P, Younossi Y, et al. Changes in the global burden of chronic liver diseases from 2012 to 2017: the growing impact of nonalcoholic fatty liver disease. Hepatology. 2020.
- Wu S, Wu F, Ding Y, et al. Association of non-alcoholic fatty liver disease with major adverse cardiovascular events: a systematic review and meta-analysis. Sci Rep. 2016;6:33386.
- Mantovani A, Scorletti E, Mosca A, et al. Complications, morbidity and mortality of nonalcoholic fatty liver disease. Metabolism. 2020;111S:154170.
- Forouzanfar MH, Liu P, Roth GA, et al. Global burden of hypertension and systolic blood pressure of at least 110 to 115 mm Hg, 1990–2015. JAMA. 2017;317(2):165–182.
- López-Suárez A, Guerrero JMR, Elvira-González J, et al. Nonalcoholic fatty liver disease is associated with blood pressure in hypertensive and nonhypertensive individuals from the general population with normal levels of alanine aminotransferase. Eur J Gastroenterol Hepatol. 2011;23:1011–1017.
- Ryoo J-H, Suh YJ, Shin HC, et al. Clinical association between non-alcoholic fatty liver disease and the development of hypertension. J Gastroenterol Hepatol. 2014;29(11):1926–1931.
- Ryoo J-H, Ham WT, Choi J-M, et al. Clinical significance of non-alcoholic fatty liver disease as a risk factor for prehypertension. J Korean Med Sci. 2014;29(7):973–979.
- Singh S, Allen AM, Wang Z, et al. Fibrosis progression in nonalcoholic fatty liver vs nonalcoholic steatohepatitis: a systematic review and meta-analysis of paired-biopsy studies. Clin Gastroenterol Hepatol. 2015;13:643–654.e1–9.
- Oikonomou D, Georgiopoulos G, Katsi V, et al. Non-alcoholic fatty liver disease and hypertension: coprevalent or correlated? Eur J Gastroenterol Hepatol. 2018;30(9):979–985.
- Huh JH, Ahn SV, Koh SB, et al. A prospective study of fatty liver index and incident hypertension: the KoGES-ARIRANG study. PLOS One. 2015;10(11):e0143560.
- Feng R-N, Du S-S, Wang C, et al. Lean-non-alcoholic fatty liver disease increases risk for metabolic disorders in a normal weight Chinese population. World J Gastroenterol. 2014;20(47):17932–17940.
- Salonen JT. Is there a continuing need for longitudinal epidemiologic research? The Kuopio Ischaemic Heart Disease Risk Factor Study. Ann Clin Res. 1988;20:46–50.
- Vernon G, Baranova A, Younossi ZM. Systematic review: the epidemiology and natural history of non-alcoholic fatty liver disease and non-alcoholic steatohepatitis in adults. Aliment Pharmacol Ther. 2011;34(3):274–285.
- Zhou Y-Y, Zhou X-D, Wu S-J, et al. Synergistic increase in cardiovascular risk in diabetes mellitus with nonalcoholic fatty liver disease: a meta-analysis. Eur J Gastroenterol Hepatol. 2018;30(6):631–636.
- Ilomäki J, Hajat A, Kauhanen J, et al. Relationship between alcohol consumption and myocardial infarction among ageing men using a marginal structural model. Eur J Public Health. 2012;22(6):825–830.
- Bedogni G, Bellentani S, Miglioli L, et al. The fatty liver index: a simple and accurate predictor of hepatic steatosis in the general population. BMC Gastroenterol. 2006;6(1):33.
- Jensen T, Niwa K, Hisatome I, et al. Increased serum uric acid over five years is a risk factor for developing fatty liver. Sci Rep. 2018;8(1):1–8.
- Salonen JT, Salonen R, Seppänen K, et al. HDL, HDL2, and HDL3 subfractions, and the risk of acute myocardial infarction. A prospective population study in eastern Finnish men. Circulation. 1991;84(1):129–139.
- Dikalov S, Itani H, Richmond B, et al. Tobacco smoking induces cardiovascular mitochondrial oxidative stress, promotes endothelial dysfunction, and enhances hypertension. Am J Physiol Heart Circ Physiol. 2019;316(3):H639–H646.
- Banack HR, Kaufman JS. Estimating the time-varying joint effects of obesity and smoking on all-cause mortality using marginal structural models. Am J Epidemiol. 2016;183:122–129.
- World Health Organization. ICD-10: international statistical classification of diseases and related health problems: tenth revision. 2nd ed. Geneva: World Health Organization; 2004.
- Rothman KJ. Synergy and antagonism in cause–effect relationships. Am J Epidemiol. 1974;99(6):385–388.
- Andersson T, Alfredsson L, Källberg H, et al. Calculating measures of biological interaction. Eur J Epidemiol. 2005;20(7):575–579.
- Hosmer DW, Lemeshow S. Confidence interval estimation of interaction. Epidemiology. 1992;3:452–456.
- Rothman KJ, Professor TLLA, Greenland S. Modern epidemiology. Third, mid-cycle revision edition. Philadelphia, Baltimore, New York: LWW; 2012.
- Simons N, Isaacs A, Koek GH, et al. PNPLA3, TM6SF2, and MBOAT7 genotypes and coronary artery disease. Gastroenterology. 2017;152(4):912–913.
- Stergiou G, Anastasios K, Gianfranco P, et al. Office blood pressure measurement: the weak cornerstone of hypertension diagnosis. Hypertension. 2018;71(5):813–815.
- Unger T, Borghi C, Charchar F, et al. 2020 International Society of Hypertension Global Hypertension Practice Guidelines. Hypertension. 2020;75(6):1334–1357.
- Pearl J, Paz A. Confounding equivalence in causal inference. J Causal Infer. 2014;2(1):75–93.