
Abstract
Objectives
Despite advances in immunosuppression and surgical technique, pancreas transplantation is still associated with a significant graft loss rate. The Pancreas Donor Risk Index (PDRI) is a pre-transplant scoring tool derived from a US population. We sought to validate the PDRI in a Norwegian population.
Methods
We retrospectively retrieved donor data for 344 pancreas transplants undertaken in Norway between 2000 and 2019, utilising the Scandiatransplant database, and matched these to the respective recipients. The PDRI score was calculated for each transplanted pancreas, these were then stratified into quintiles. The association between the PDRI quintiles and 1-year graft survival was calculated, and this was repeated for the different types of pancreas transplantation. The association between PDRI as a continuous variable, and graft survival was determined. Donor and recipient data were compared to the original US population.
Results
The overall 1-year graft survival was 82.7%. There were no significant differences in survival between the different PDRI quintiles. When viewed as a continuous variable, increased PDRI score was not associated with decreased graft survival. Significant differences between the Norwegian and US populations were found.
Conclusions
When applied to a Norwegian population, the PDRI score was unable to predict 1-year graft survival.
Introduction
A pancreas transplant is the definitive treatment of diabetes mellitus. Despite advances in immunosuppressive therapy, antibiotic therapy, and anticoagulation, there is a significant rate of graft loss. According to a 25-year survey of pancreas transplantations in the US by Gruessner et al., the 5-year graft survival rates vary between 53% for pancreas transplantation alone (PTA), and 73% for simultaneous pancreas-kidney transplantations (SPK) [Citation1]. A substantial number of graft losses occur within the first year post-transplantation. In the same study by Gruessner, the one-year graft function rates were 79.5% for PTA and 85.2% for SPK. However, the 5-year conditional graft survival rates, at the one-year post-transplant mark, reached more than 70% for PTA, and 85% for SPK in the most recent surveyed period. In other words, if the pancreas graft survives past the one-year mark, the graft survival rate is comparable to that of deceased donor renal transplant recipients [Citation2].
To increase the rate of pancreas graft survival one must address all aspects of the transplantation process. The donor selection criteria must be stringent enough not to transplant suboptimal grafts with assumed worse outcomes. On the other hand, too rigid criteria will in turn lead to a decline in the number of grafts available for transplantation.
Several donor factors have been known to be associated with outcomes [Citation1,Citation3,Citation4]. Attempts have been made to systematically assemble these factors into scoring systems available to clinicians for the selection of pancreas grafts. The Eurotransplant Pancreas Advisory Committee developed the pre-procurement pancreas suitability score (P-PASS), a scoring system based on nine pre-procurement factors [Citation5]. However, the P-PASS findings have not been reproduced in subsequent studies [Citation6–8] and have since been weaned from use. In 2010 Axelrod et al. devised the Pancreas Donor Risk Index (PDRI), a similar pre-procurement scoring system based on eight pre-transplantation donor variables, and in addition cold ischaemia time and transplantation type, in a North American setting [Citation9]. The eight donor variables include donor, sex, age, ethnicity, body mass index (BMI), cause of death (COD), creatinine, and donation after cardiac death (DCD) status. The PDRI was designed to give a DRI of 1.0 to a ‘median’ donor, and a higher DRI implies an increased risk of graft failure. In this study based on a US population, an increased PDRI was found to be associated with an increased 1-year graft loss rate. However, the general validity of the PDRI outside the US is not well-established [Citation8,Citation10–12]. Since parameters in the PDRI are related to general health-related features of the population under study, possible differences between various countries and populations may limit the general validity of any scoring system. In Norway, a pancreas pre-procurement score is not commonly used in organ procurement. Assessing the suitability of a donor organ is left to the retrieving transplant surgeon. A valid pre-procurement score could aid this decision-making process, facilitating quality of care improvement and research. We hypothesized that the differences between a Norwegian donor and recipient population differ from the US ones, thereby limiting the predictability of the PDRI scoring system. The objective of this study was therefore to ascertain the validity of the PDRI to predict graft survival in a Norwegian setting.
Materials and methods
All recipients gave written informed consent. The study was approved by the Regional Data Protection Agency.
The current study was performed as a retrospective registry analysis. In Norway, all transplantations are performed at Oslo University Hospital. All pancreas transplantations performed between 1 January 2000, up to 2 February 2019, were included in the analysis. Donor data from organs donated to Norwegian recipients is stored in a common database run by Scandiatransplant, an organ exchange organisation for the countries Denmark, Finland, Iceland, Norway, Sweden, and Estonia, the organisation is co-owned by the member transplant hospitals. The database lists information on the donors, as well as the matching recipients. The retrieved recipient data was then again matched to their medical records. Data were controlled for missing entries or incomplete data. Exclusion criteria were missing donor data necessary for PDRI calculation as defined by Axelrod [Citation9], or missing information on pancreas graft survival of the recipients. In instances of incomplete data in the Scandiatransplant database, the donor coordinator’s physical progress charts served as an additional source. Graft loss was defined as explantation of the organ or a return to exogenous insulin therapy. The PDRI value was calculated using the formula presented in the same paper, with unit conversion performed when needed, and further categorized by PDRI quintiles identical to Axelrod’s. Transplantations were categorized by type of graft; PTA, SPK, or Pancreas after kidney transplantation (PAK).
The Norwegian donor and recipient cohorts were then compared to the one published by Axelrod, and the PDRIs ability to predict 1-year graft failure was calculated.
Statistical analyses
Group comparisons between donors, recipient- and graft characteristics were performed with the Chi-square test, or a two-sample t-test for equality of proportions for categorical variables, and a Welch corrected independent samples t-test for continuous variables. Graft survival data with inter-group comparisons between graft types and PDRI quintiles were done by Kaplan-Meier log-rank test for equality of survivor functions. Cox regression was used for determining the association between graft survival and PDRI viewed as a continuous variable. All p-values presented are two-tailed, and values <.05 were regarded as statistically significant. Statistical analysis was conducted using Stata/SE for Windows, version 16.1 (StataCorp LLC, College Station, TX, USA).
Results
Demographics
A total of 383 pancreas donors were identified from the introduction of the Scandiatransplant database in 1994 up until today. Twenty-six were excluded due to lack of consent before 1 January 2000. Two donors lacked data necessary for the calculation of a PDRI score, 13 patients were Danish citizens, without 1-year follow-up data available, and thus represented censored cases in the survival analysis. Eleven patients had yet to undergo their one-year follow-up and were excluded. This left 344 patients for final analysis (PTA 94, SPK 236, and PAK 13) (). There was no further follow-up for study purposes after the one-year mark. The baseline donor and recipient demographics are presented in .
Figure 1. PRISMA flow diagram describing the inclusion and exclusion process of donor/recipient matches in a Norwegian population 2000–2019. All 13 were Danish recipients—included in the analyses, represented as censored cases in the Kaplan Meier survival analysis.
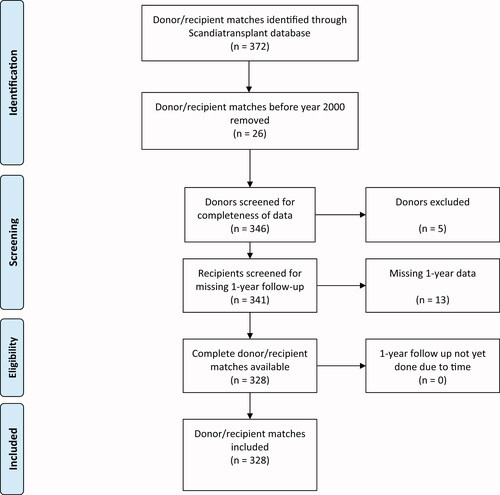
Table 1. Donor and recipient characteristics in a Norwegian cohort of pancreas transplantation 2000–2019.
The Norwegian cohorts for both donor and recipients were compared to the cohorts published by Axelrod et al. Further comparisons were made by the type of transplant. The Norwegian donor cohort differed in most of the parameters needed for the PDRI calculation. There was a marked difference in the ethnical composition of donors, with a largely Caucasian donor group (97.7 vs. 73.3, p < .001). The cause of death also differed, with the predominant cause being cerebrovascular accidents in the Norwegian cohort (NO: 38.1% vs. US: 20.8%, p < .001) as opposed to head trauma in the US cohort (US: 67.7% vs. NO: 26.5%, p < .001).
The Norwegian donors utilised were significantly older than the US donors (31.5 vs. 26.3 years, p < .001). The anthropometric factors reached statistical significance for BMI and weight, but in a clinical setting, they were numerically quite comparable. The Norwegian cold ischaemia time was notably shorter than the US one (9.3 vs. 13.6 h, p < .001), possibly reflecting the smaller geographical distribution. Also, of note is that DCD has yet to be utilised for pancreas transplantations in Norway, whereas it accounted for 1.4% of the donations in the US population.
All parameters for the Norwegian cohort are presented in .
Table 2. Comparison of the US and Norwegian cohort characteristics in donors and recipients of pancreas transplantations.
The calculated PDRI in the Norwegian cohort ranged from 0.58 to 2.41, with a median PDRI of 0.93 (IQR 0.71–1.36), and a similar distribution was found for PTA and SPK, but not for PAK, which displayed a narrower range (). The distribution showed a shift downward in both upper and lower limits, as compared to the US PDRI, which ranged from 0.64 to 2.86 [Citation9]. The details of the US–Norwegian parameters are presented in .
Table 3. Distribution of PDRI in a Norwegian cohort, compared to the US-based original.
Graft survival
The overall 1-year graft survival from 2000 to 2019 was 82.7%. For PTA, this number was 71.3%, for SPK 87.4%, and for PAK 83.6% (, ). The survival rates between the three transplant modalities were significantly dissimilar, displaying a chi-square statistic of 10.68 (p = .005).
Figure 2. Kaplan Meier 1-year survival by graft type. PTA: pancreas transplant alone; SPK: simultaneous pancreas kidney transplantation; PAK: pancreas after kidney transplantation.
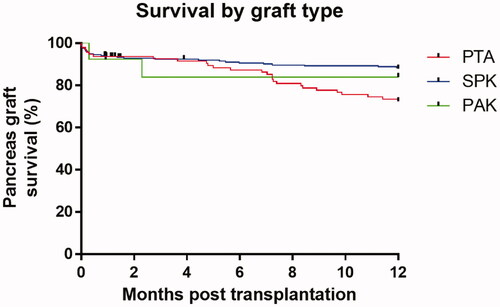
Figure 3. Kaplan Meier 1-year survival curves by graft type and PDRI quintile. PTA: pancreas transplant alone; SPK: simultaneous pancreas kidney transplantation; PAK: pancreas after kidney transplantation.
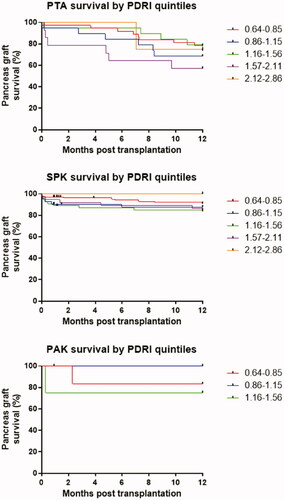
Table 4. 1-year pancreas graft survival in a Norwegian population, by PDRI and transplant type.
From the Kaplan-Meier curves, using the PDRI quintiles from Axelrod’s paper to categorise the recipients gave survival rates ranging from lowest to highest; 87.3, 82.0, 80.1, 74.6, and 80.0% with a chi-square statistic of 3.85 (p = .42). The survival rates did not reach statistical significance when compared to one another in any one combination ().
When adjusting the PDRI quintiles to fit the Norwegian range, the survival rates were 85.1, 90.8, 81.4, 77.6, and 79.3%, with a chi-square statistic of 4.32 (p = .36), but again failed to reach statistical significance in any internal comparison, as when analysed with the US quintiles.
When analysed with PDRI as a continuous variable, a univariate cox-regression failed to show any significant association with graft survival for all recipients [Hazard Ratio (HR) 1.58, (95% CI 0.87–2.85), p = .13]. Equally, there were no statistical significances between the PDRI as a continuous variable and graft survival between the different types of transplantation [PTA: HR 1.29, (95% CI 0.58–2.86), p = .53; SPK: HR 1.68, (95% CI 0.70–4.04), p = .24; PAK: HR 9.46, (95% CI 0.02–4547.62), p = .48].
Discussion
In this report, we have shown that the PDRI was unable to predict graft survival in neither SPK, PTA, nor PAK grafts in a Norwegian cohort. Although one should use caution when interpreting the results for PAK, due to the small number of recipients in this group.
The data did however display the same poorer outcome for PTA transplantations than for SPK, a finding that by now is accepted as normality.
The PDRI score has previously been sought validated against other populations than its original US. No correlations were found by Amaral et al. in Brazil [Citation11], or by Salamanca-Bustos et al. in a Spanish population [Citation10]. The latter however only included SPK transplants.
In a British population, Mittal et al. found a correlation between graft survival and PDRI in SPK transplantations, with a hazard ratio of 1.52, but no similar correlation was found between PTA and PAK transplantations and the PDRI score [Citation12]. Here, the authors highlight the differences in population between the US and UK. We found the same for the Norwegian population. Both our donor and recipient populations were ethnically very homogenous, with 97.7% of the donors and 98.6% of the recipients being Caucasian.
In a German single-centre study, Ayami et al. examined the correlation between PDRI score and graft survival in 327 transplantations [Citation13]. Here they demonstrated inferior graft survival in their final tertile, with an increased risk of graft failure, with a hazard ratio of 1.79, but only within this tertile. In a Dutch single-centre study by Blok et al. [Citation8], the authors stratified the transplantations into two on either side of the calculated mean PDRI of 1.24 and found a significantly detrimental outcome in the high PDRI group. A contradictory result was however demonstrated in a German single-centre study done by Franz et al., where they found no correlation with graft survival when the PDRI was stratified to either side of a calculated median of 1.198.
DCD has yet to be implemented as a routine procedure in Norway. To date only eight DCD donations have been performed [Citation14], but not for pancreata so far. In the US population, this accounted for 1.4% of the pancreatic donors. These are small numbers, so care should be taken not to overestimate the significance of this, but it is nevertheless one of the eight donor factors needed for the PDRI calculation.
The differences in COD in the two donor populations are most likely multifactorial. OECD has published data indicating a higher than 5-fold difference in death rates attributed to traffic accidents between Norway and the US [Citation15], which could be one possible explanation for this difference. In Axelrod’s paper, cerebrovascular accident (CVA) as COD increases the PDRI by a factor of 1.23, so the lower percentage of CVAs in the Norwegian material would, in turn, lower the mean PDRI in our population.
Most of the parameters included in the PDRI differed between the Norwegian and US cohorts (). It is therefore not surprising that the Norwegian PDRI values differ from the US ones. This in turn might be the reason behind the missing predictive accuracy of the PDRI score in this Norwegian cohort.
Nevertheless, it is important to keep in mind the nature of such explanatory or predictive models. One cannot easily single out one factor out of several to explain any positive or negative finding. But viewed as a whole, the many differences between several of the covariates can easily explain the findings.
The strength of this study is the completeness of data being available since all transplantations are performed at the same hospital, and therefore this also includes the one-year follow-up appointments. For this reason, there were no dropouts due to missing one-year data, apart from 13 Danish recipients that had all their follow-up performed in their country. In addition to the recipient data, the completeness of donor data was ensured through the Scandiatransplant database.
Another strength is that this study is in methodology close to the original PDRI article by Axelrod, and again to Mittal’s article, which allows for a more direct comparison.
The weaknesses are first and foremost the retrospective design. There were patients with incomplete datasets that mandated exclusion, but these were few. A prospective study with relatively small Norwegian transplant numbers is not easily achievable and would potentially necessitate several decades of data collection to include a reasonable number of donors. Secondly, when categorised into the three types of transplantation, the number becomes few. This is most apparent in the PAK group, with only 13 donors. One should therefore interpret the results for PAK with caution.
To overcome the weaknesses of few numbers, repeating the present study in the entire Scandiatransplant catchment area would be a possibility. Performed within the same time period, this would potentially have yielded more than 900 pancreas donors [Citation16]. Considering this involves six countries with different datasets and legislations, this would be difficult to accomplish within a reasonable timeframe. It would provide more robust numbers, but given the reasonable similar donor populations, it is questionable if this would significantly alter the results or conclusion.
Alternatively, developing donor risk scoring systems tailored to specific populations would probably be more suitable as a clinical tool. Another, possibly more robust alternative, would be to design a risk index that incorporated both donor and recipient variables. This has previously been sought validated in deceased kidney donor populations [Citation17]. This would potentially increase the predictive accuracy of the index further. However, the value of any risk scoring system is best viewed as a supplement to aiding clinical decisions. Existing transplant protocols identify potential organs suitable for transplantation within certain predefined criteria (e.g., age of donor, BMI, cause of death, CIT). But a potential caveat to this is that it may lead to the underutilisation of grafts. A risk stratification score at the time of donation can aid this decision, particularly in borderline grafts.
In conclusion, the US-derived PDRI score was not able to accurately predict 1-year pancreas graft survival in a Norwegian population. An explanation may lie in a difference of determining factors for graft survival, and a study aimed at identifying these would be required. Together with better monitoring of the pancreas transplant, this would potentially increase graft survival.
Author contributions
G.K. designed the study, collected, curated, and analysed data, wrote and revised the manuscript. R.H., E.N., E.M.A., and P.D.L. curated data and revised the manuscript. K.R. curated and analysed data and revised the manuscript. T.G.J. curated data and revised the manuscript. T.I.T. curated data and revised the manuscript, provided supervision, project administration, and funding acquisition. H.H. designed the study, curated and analysed data, revised the manuscript, provided supervision, project administration, and funding acquisition.
| Abbreviations | ||
| BMI | = | body mass index |
| CI | = | confidence interval |
| COD | = | cause of death |
| DCD | = | donation by cardiac death |
| HR | = | hazard ratio |
| OECD | = | organization for economic cooperation and development |
| PAK | = | pancreas after kidney transplantation |
| PDRI | = | pancreas donor risk index |
| P-PASS | = | pre-procurement pancreas suitability score |
| PTA | = | pancreas transplantation alone |
| SPK | = | simultaneous pancreas kidney transplantation |
Disclosure statement
The authors of this manuscript have no conflicts of interest to disclose.
Data availability statement
The datasets generated and analysed during the current study are not publicly available due to Norwegian national legislation prohibiting the publishing of information that could compromise research participant privacy. The collected data are of such nature that it falls under the provisions of the Norwegian Health Research Act. The data are available from Oslo University hospital’s data protection official for research upon reasonable request, contact via [email protected], for researchers who meet the criteria for access to confidential data.
Additional information
Funding
References
- Gruessner AC, Gruessner RW. Long-term outcome after pancreas transplantation: a registry analysis. Curr Opin Organ Transplant. 2016;21(4):377–385.
- Hart A, Smith JM, Skeans MA, et al. OPTN/SRTR 2014 annual data report: kidney. Am J Transplant. 2016;16(S2):11–46.
- Humar A, Ramcharan T, Kandaswamy R, et al. Technical failures after pancreas transplants: why grafts fail and the risk factors-a multivariate analysis. Transplantation. 2004;78(8):1188–1192.
- Sutherland DE, Gruessner RW, Dunn DL, et al. Lessons learned from more than 1,000 pancreas transplants at a single institution. Annals of Surgery. 2001;233(4):463–501.
- Vinkers MT, Rahmel AO, Slot MC, et al. How to recognize a suitable pancreas donor: a eurotransplant study of preprocurement factors. Transplant Proc. 2008;40(5):1275–1278.
- Schenker P, Vonend O, Ertas N, et al. Preprocurement pancreas allocation suitability score does not correlate with long-term pancreas graft survival. Transplant Proc. 2010;42(1):178–180.
- Woeste G, Moench C, Hauser IA, et al. Can the preprocurement pancreas suitability score predict ischemia-reperfusion injury and graft survival after pancreas transplantation? Transplant Proc. 2010;42(10):4202–4205.
- Blok JJ, Kopp WH, Verhagen MJ, et al. The value of PDRI and P-PASS as predictors of outcome after pancreas transplantation in a large European Pancreas Transplantation Center. Pancreas. 2016;45(3):331–336.
- Axelrod DA, Sung RS, Meyer KH, et al. Systematic evaluation of pancreas allograft quality, outcomes and geographic variation in utilization. Am J Transplant. 2010;10(4):837–845.
- Salamanca-Bustos JJ, Campos-Hernandez JP, Sanchez-Hidalgo JM, et al. Validation of the pancreatic donor risk index in simultaneous pancreas-kidney transplantation performed in Cordoba hospital from 2000 to 2015. Transplant Proc. 2016;48(9):3037–3039.
- Amaral PH, Genzini T, Perosa M, et al. Donor risk index does not predict graft survival after pancreas transplantation in Brazil. Transplant Proc. 2015;47(4):1025–1028.
- Mittal S, Lee FJ, Bradbury L, et al. Validation of the pancreas donor risk index for use in a UK population. Transpl Int. 2015;28(9):1028–1033.
- Ayami MS, Grzella S, Kykalos S, et al. Pancreas donor risk index but not Pre-Procurement pancreas allocation suitability score predicts pancreas graft survival: a cohort study from a large German Pancreas Transplantation Center. Ann Transplant. 2018;23:434–441.
- Bakkan P. Yearly report 2015 [pdf]. Norwegian resource group for organ donation; 2015. Available from: http://www.norod.no/wp-content/uploads/2018/01/%C3%85rsrapport-Organdonasjon-2015.pdf
- Wegman F. IRTAD Road safety annual report: OECD/IRT; 2019. Available from: https://www.itf-oecd.org/sites/default/files/docs/irtad-road-safety-annual-report-2019.pdf
- Scandiatransplant figures, historical data [Internet]; 2020. Available from: http://www.scandiatransplant.org/data/Scandiatransplant_tx_figures_01jan2020.xlsx.
- Clayton PA, McDonald SP, Snyder JJ, et al. External validation of the estimated posttransplant survival score for allocation of deceased donor kidneys in the United States. Am J Transplant. 2014;14(8):1922–1926.