
 ?Mathematical formulae have been encoded as MathML and are displayed in this HTML version using MathJax in order to improve their display. Uncheck the box to turn MathJax off. This feature requires Javascript. Click on a formula to zoom.
Abstract
Aims
Three types of gadoxetic acid enhanced MRI parameters have been proposed to quantify liver function. However, until now there is no consensus on which one that has the greatest potential for use in clinical practice. This study was conducted to compare the efficacy of three types of gadoxetic acid enhanced MR parameters for quantitative assessment of liver function.
Methods
Imaging data of 10 patients with chronic liver disease and 20 healthy volunteers were analyzed. Parameters based on signal intensity(SI), T1 changes or dynamic-hepatocyte-specific-contrast-enhancement MR were calculated. Their mutual correlations, discriminatory capacity between cirrhotic and healthy liver and correlations with Child-Pugh score and Model for end-stage liver-disease (MELD) were estimated.
Results
The strongest correlations were observed between relative enhancement of the liver and T1 time at 20 min after contrast agent injection, and between liver-spleen contrast ratio at 20 min after contrast agent injection and hepatic uptake rate (|r|> 0.90, p < .05, both). All parameters but input-relative blood flow (p = 0.17) were significantly different between patient and control group (p < .05), with AUROCs of liver-to-muscle ratio (LMR), increase of LMR and hepatic extraction fraction greater than 0.90 (p < .05). Liver-to-spleen ratio, LMR and hepatic uptake index presented a strong correlation with Child-Pugh score and MELD (|r|> 0.8, p < .05).
Conclusion
Simple SI-based parameters were as good as more complex parameters in evaluating liver function at gadoxetic acid enhanced MR. In clinical routine LMR seems to be the easiest-to-use parameter for quantitative evaluation of liver function.
Introduction
Gadoxetic acid enhanced MR is used increasingly since it not only allows for excellent detection and characterization of hepatic lesions but also provides information on liver function [Citation1,Citation2]. The liver function can be evaluated quantitatively on both global and regional levels, which is of importance when planning hepatobiliary surgery, especially in patients with chronic liver disease (CLD) [Citation3,Citation4]. By adequate estimation of the function of the future liver remnant its regeneration potential can be estimated [Citation5] and postoperative liver failure might be avoided [Citation6].
Gadoxetic acid is a paramagnetic contrast agent shortening the T1 relaxation time that is actively taken up by the hepatocytes. The liver parenchyma enhancement depends on the balance between influx transporter organic anion-transporting polypeptides and the efflux transporter multidrug resistance protein 2 to the bile ducts [Citation7–9]. Normal hepatocytes obtain an optimal enhancement during a plateau 10 to 40 min after injection [Citation10]. As the expression of organic anion-transporting polypeptides negatively correlates with the severity of CLD and liver fibrosis, the liver parenchymal enhancement after gadoxetic acid injection (often 20 min) can be used for quantitative evaluation of the liver function [Citation11,Citation12].
Based on the aforementioned mechanism, three main approaches for liver function assessment have been suggested: measurement of liver parenchyma signal intensity (SI), T1 relaxometry (i.e., measurement of changes in T1 relaxation time) and dynamic-hepatocyte-specific contrast-enhanced (DHCE)-MRI [Citation11,Citation13]. These gadoxetic acid enhanced MR derived parameters can be obtained from the standard, clinical routinely-used dynamic hepatic contrast enhanced MRI images. They have been shown to correlate well to clinical indices of liver function, such as indocyanine green retention test, Child-Pugh score and model for end-stage liver disease (MELD) score [Citation13,Citation14].
However, several of the parameters used to describe liver function by gadoxetic acid enhanced MR are simply different mathematical expressions of the same physical phenomenon. For example, by adjusting the obtained SI of the liver with that of the spleen, at least four parameters have been raised: liver-to-spleen ratio (LSR) [Citation15], corrected LSR [Citation5], liver-spleen contrast ratio at 20 min after contrast agent injection (LSC_N20) [Citation16], and increase rate of the LSR (ΔLSR) [Citation17]. This has undoubtedly created difficulties in comparing results from different research groups. It is necessary to evaluate the consistency among these parameters. Additionally, previous published studies mainly compared the efficacy between SI and T1 relaxometry parameters [Citation13–15], but to our knowledge there are no studies comparing a great number of parameters published and there is no consensus on which one that has the greatest potential for use in clinical practice.
In the present study, the performance of SI derived parameters, T1 relaxometry and DHCE-MR derived parameters were compared in a group of patients with CLD and a group of healthy volunteers in an attempt to describe the performance of the parameters and to indicate which one has the greatest potential for clinical use.
Material and methods
Study subjects
The imaging data analyzed in this paper originates from a previously published study describing the analysis of DHCE-MRI derived parameters [Citation18]. In the original study, ten patients were included according to the inclusion and exclusion criteria as follows: 1. aged between 18 and 65 years old; 2. CLD caused by alcohol abuse or viral hepatitis; 3. no history of hepatobiliary surgery except for cholecystectomy; 4. no impaired renal function, i.e., glomerular filtration rate ≥30 ml·min−1·1.73 m−2; 5. no contraindication for MR examination. Twenty healthy volunteers with no history of CLD, hepatobiliary surgery or viral hepatitis/alcohol abuse served as control group. Subjects’ demographic and clinical characteristics, as well as the results of serum liver function tests from the visit closest to MR examination were documented (). This study was approved by the Regional Ethical Review Board of Stockholm (Regionala Etikprövningsnämnden i Stockholm, No. 04-721/1), Sweden. As this study was a retrospective research, the written informed consent was waived by the Regional Ethical Review Board of Stockholm (Regionala Etikprövningsnämnden i Stockholm).
Table 1. Clinical characteristics and serum liver function indices of study subjects.
MR procedure
MR examinations were performed on a 1.5 T scanner (Intera; Philips Medical Systems, Best, Netherlands), with a Philips four-channel body coil (sensitivity encoding, SENSE). A T1 weighted three-dimensional spoiled gradient-echo sequence was used for dynamic contrast-enhanced liver MR imaging acquisition (scanning parameters: repetition time, 4.1 ms; echo time, 2.0 ms; flip angle 10°; field of view, 415 mm; acquisition matrix resolution, 192 × 192; reconstruction matrix, 256*256; 40 slices, slice thickness, 10 mm; overlap, 5 mm; SENSE factor R, 2). Each volume was imaged in a single breath-hold (12 s scan time per volume) and the subjects were instructed to hold their breath at the same depth during every acquisition. Gadoxetic acid (Gd-EOB-DTPA, Primovist®, Bayer Healthcare, Berlin, 0.25 mmol · ml−1, 0.1 ml per kg body weight) was injected via the anterior cubital vein at an infusion rate of 2 ml s−1 achieved by a power injector. An additional bolus of 20 ml saline was flushed at the same rate immediately after the contrast agent injection. Images were obtained three times before contrast agent injection and then followed by repetitive sampling with a step-wise increase in sampling intervals up to a total sampling time of 45 min.
Image analysis
For determination of DHCE-MRI-derived parameter, hepatic extraction fraction (HEF), input-relative blood flow (irBF) and mean transit time (MTT) were calculated on a voxel-by-voxel basis using deconvolutional analysis, as demonstrated by previous studies [Citation18]. Total functional capacity of liver was expressed by HEFml, obtained by adding the individual HEF of every parenchymal voxel within defined boundaries (excluding the vascular voxels). Total liver volume (tVol) was obtained by adding the volumes of voxels within manually outlined liver borders. Liver parenchymal volume (pVol) was achieved by exclusion of vascular tissue voxels from tVol.
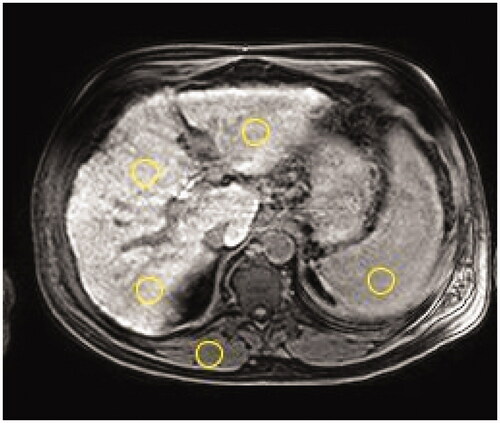
A 10-mm thick T1 weighted slice obtained at the level of bifurcation of the portal vein before contrast agent administration and after a 20-minute delay were analyzed to calculate the SI-and T1-relaxometry derived parameters. Researcher-defined circular regions of interest (ROIs, diameter ranges 10–30 mm) were placed carefully on left liver lobe, segment IV, right liver lobe, paravertebral muscle and the spleen. When placing ROIs, an attempt was always made to avoid blood vessels, bile ducts and marginal artifacts. ROI placement was replicated between the two time-points by visual comparison by two trained operators (Q.W and S.S) and confirmed by a senior radiologist (T.B.B) with 25 years of MR imaging analysis experience. The SI of liver was calculated as the average of the three liver ROIs ().
Figure 1. A T1 weighted transversal image at the level of the portal vein bifurcation of a 57-year-old male patient with fibrosis (Child-Pugh score 6 and MELD score 11). Circles show typical placement of the regions of interest to obtain signal intensity (SI) of liver (one in left lobe and two in right lobe), paravertebral muscle, and spleen.
Based on literature review, 12 frequently used parameters derived from SI-analysis and T1-relaxometry for quantitative evaluation of liver function were detected. However, as mentioned previously several of the formulas have a strict internal relationship where for example corrected LSR = LSR − 1, ΔLSR = LSC_N20 − 1, and T120min = T1red/ΔR1(T1red indicates reduction rate of T1 relaxation time, ΔR1, increase in the relaxation rate). Since the formulas of LSR, LSC_N20 and T120min are simpler to calculate than their counterparts those were chosen for subsequent investigations. Ultimately, 8 parameters were included in this study, and their corresponding formulas were defined as:
1. Relative enhancement (RE) of the liver [Citation19,Citation20]:
2. LSR [Citation15]:
3. LSC_N20 [Citation16]:
4. Liver-to-muscle ratio (LMR) [Citation15]:
5. Increase rate of LMR (ΔLMR) [Citation21]:
6. Hepatocellular uptake index (HUI) [Citation9]:
7. Liver T1 relaxation time at 20 min after contrast agent injection (T120min):
,
the calculation of ΔR1 is described in reference [Citation16] and the liver T1pre value was set to 586 ms [Citation17].
8. Hepatic uptake rate (Khep) [Citation16]:
in which the intrinsic T1 pre values of the liver and the spleen were set to 586 ms and 1057 ms respectively [Citation17].
Statistical analysis
Descriptive statistics were expressed as mean ± standard deviation or median with range as appropriate. Nonparametric test (Mann-Whitney U-test) was used to compare liver function parameters and liver volume of both groups. Correlations between different parameters were assessed by multivariate correlation analysis. Spearman rank correlation analysis was used to explore the correlations between different liver function parameters and clinical scores. Simple linear regression analysis was performed to determine the predictive power of the MRI derived parameters on the clinical scoring systems (Child-Pugh score and MELD). The significance threshold was set to α = 0.05. R programming (version 3.63, Vienna, R core Team, Austria) was used for statistical analysis and data visualization.
Results
Correlation between SI and T1-relaxometry-based parameters
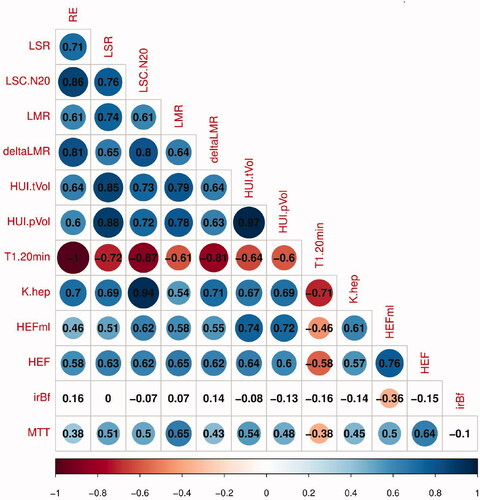
There was a moderate-to-strong correlation among the SI-derived parameters (r range 0.61–0.86, p < .05). Among T1-relaxometry parameters, T120min correlated with Khep strongly (|r|= 0.71, p < .05). SI-derived parameters presented a good correlation with T1-relaxometry parameters (|r|> 0.5, p < .05), in which T120min and RE, LSC_N20 and Khep showed a perfect linear correlation (r = 1, 0.94 respectively, p < .05) ().
Figure 2. Correlations between liver function parameters stated in numbers and in colors with a scale below. HEF, hepatic extraction fraction; HEFml, total liver functional capacity; HUI, hepatocellular uptake index, HUI-tVol calculated using total liver volume; irBF, input-relative blood flow; Khep, hepatic uptake rate; LMR, liver-to-muscle ratio; ΔLMR, Increase rate of Liver-to-muscle-ratio; LSC_N20, liver-spleen contrast ratio at 20 min after contrast agent injection; LSR, liver-to-spleen ratio; MTT, mean transit time; RE, relative enhance of the liver; T1 20 min, T1 at 20 min after contrast agent administration.
Correlation of DHCE-MRI-derived parameters with SI and T1-relaxometry-based parameters
A moderate-to-strong relationship was observed among the DHCE-MRI-derived parameters HEF, MTT and HEFml, with r ranging from 0.50 to 0.76 (p < .05). HEF, MTT and HEFml related moderately to most SI derived parameters (LSR, LSC_N20, LMR and HUI-tVol) (0.5 < r < 0.8, p < .05). The correlation coefficient r between HEF, MTT and HEFml and T1 relaxometry parameters (T120min, Khep) varied from −0.38 to 0.61(p < .05). There was not any significant correlation between irBF and all other liver functional parameters (p ≥ .05) ().
The overall performance of T1 relaxometry parameters (T120min, Khep) was better when correlating with SI-derived parameters than with DHCE-MRI derived parameters (HEF, MTT and HEFml) (|r| range 0.38–0.61 vs 0.54–1.00) ().
Liver function parameters and liver volume analysis
All liver function parameters but irBF (p = 0.17) were significantly reduced in patients compared with the control group (p < .05), with AUROCs ranging from 0.79 to 1.00. There was no significant difference in total liver volume between patients and healthy controls (p = 0.29) but after subtracting vessel voxels from total volume, patients had a significantly greater parenchymal volume (p < 0.05). However, its impact on HUI was small where AUROC of HUI-tVol and HUI-pVol was 0.85 and 0.87 respectively ().
Table 2. Results of liver function parameters and liver volume analysis.
Correlations between liver function parameters and clinical scores
The strongest correlation with the clinical scores Child-Pugh score and MELD was observed for LSR, LMR and HUI-tVol (|r|> 0.85, p < .05) (). No significant correlation was observed between MTT, RE, T120min and the two clinical scoring systems (, Supplemental Figures). At simple linear regression analysis, LSR, LMR and HUI-tVol were shown to be strongly associated with Child-Pugh score and MELD score (p < .05) ().
Figure 3. Correlation analysis between Child-Pugh score (B) and liver-to-muscle ratio (LMR) (A), and between Model for End-Stage Liver Disease (MELD) score and LMR (B).
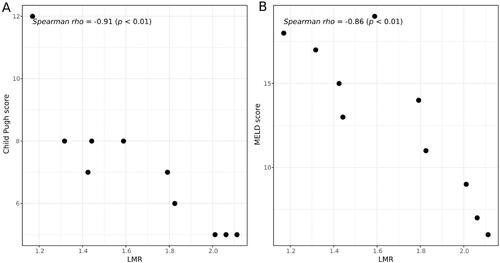
Table 3. Correlation of liver function parameters and clinical scoring systems.
Table 4. Simple linear regression analysis of MRI derived liver function parameters on two clinical scoring systems.
Discussion
In the present study, all three main approaches in quantitative assessment of liver function by Gadoxetic acid enhanced MR had rather similar performance, but LMR, one of the SI derived parameters, had slightly better diagnostic performance than any other parameter.
SI-derived parameters are currently the most widely used radiologic biomarker for quantitative assessment of liver function [Citation12]. Their value can be directly acquired from the MR images and their formulas are simple. As the absolute values of SI will differ across MR units, patients, and even scans, they are often adjusted by some internal tissues such as liver per se, spleen or muscle. Several of the obtained parameters are just mathematical expressions or are strongly related to each other, such as corrected LSR and LSR, ΔLSR and LSC_N20. For simplification the ones deemed simplest to calculate or most frequently used were evaluated in this study. All the SI-derived parameters had a good consistency (r range 0.61–0.86, p < .05) and all of them could differentiate CLD from normal liver, with AUROC > 0.85.
Previous studies have shown that liver volume deceases with the progression of fibrosis and that liver volume can be used to estimate liver function in CLD [Citation14,Citation22,Citation23]. In contrast, our data indicated that liver volume, no matter in the form of total liver volume (tVol) or liver parenchymal volume (pVol), was larger in the patient group than that of the control group, although the difference of the former (i.e., tVol) was not statistically significant. The discrepancy between our findings and previous published results might be explained by that the patients in the present study mainly had early phase CLD (dominated by Child-Pugh A and B) where liver swelling and hepatosteatosis might have increased the observed volume. HUI is a complex parameter which combines the SI of liver and spleen and liver volume. The possibility to correct for different proportions of the liver parenchyma was therefore further explored by using tVol and pVol in the assessment of liver function by HUI, but the AUROCs were similar in distinguishing between CLD group and the control group (HUI-tVol vs HUI-pHUI, 0.85 vs 0.87). Thus, larger studies with more evenly distributed cohorts are required to evaluate the efficacy of HUI and the potential gain in excluding non-liver parenchyma from the calculation.
The main disadvantages of SI-derived parameters are that they are confounded by technical factors, such as MR hardware, coil placement and scanning parameters and the subjective placement of ROIs not covering total segmental volumes. This results in low reproducibility making them less comparable between patients or at follow-up. Furthermore, SI is not linear to the concentration of contrast agent [Citation24].
To overcome the above-mentioned limitations, T1-relaxometry measurements, which better reflect the real uptake rate of the contrast agent, have been proposed. The common method to calculate the T1-relaxometry parameters is through T1 mapping obtained by an additional scanning sequence (such as Look-Locker Sequence or Modified Look-Locker Imaging Sequence, MOLLI), in which T1 relaxation time can be manually determined by placement of ROIs on T1 maps or automatically by a dedicated software [Citation13]. When analyzing contrast enhancement from images obtained in clinical practice another method of T1 relaxation time calculation has been developed [Citation16]. It is based on an ideal model where T1 relaxation time is obtained by calculating the increase of the relaxation rate (ΔR1) after contrast agent administration. A linear relationship between the contrast agent concentration and ΔR1 is then assumed. Thereby Khep can be estimated according to an assumption of a two-compartment model taking the pharmacokinetics of the contrast agent into account.
T1-relaxometry derived parameters have absolute values that directly reflect the changes in parenchyma enhancement over time, i.e., the contrast agent uptake rate, making comparisons between individuals and examinations more feasible [Citation13,Citation25]. They are not influenced by technical parameters such as MR scanner, placement of receiver coils or pulse sequence and should be more reliable and less subjective in liver function assessment. However, to obtain T1 relaxometry parameters, additional scanning sequences are required and their formulas involve rather complicated calculations.
DHCE-MR is a more complex technique for quantitative evaluation of liver function. It also needs multiple extra imaging sequences and involves complicated mathematics modeling. Using the method of deconvolutional analysis, the DHCE-MR derived parameters are determined by analyzing every voxel within the field of view based on an intensity-time curve. Compared with the former two approaches, it provides not only information on hepatic blood perfusion but also provides liver function maps, theoretically providing an indication on the functional capacity of the liver remnant after liver resection. The main limitation of DHCE-MRI-derived parameters is that their calculation requires sophisticated algorithms and that their imaging is time-consuming, which hinders its wide use in clinical practice.
Of all obtained parameters, LMR, ΔLMR, HEF, MTT and LSR had the largest AUROCs in distinguishing CLD from normal liver. These parameters also showed a close relationship at the correlation analyses, implying that the simpler ones can substitute to the more complex ones. Taken their correlation with clinical scores into consideration, the strongest correlation was seen for LMR and LSR. As spleen may be absent in some patients due to splenectomy, LMR might be the preferred radiologic biomarker for liver function estimation on gadoxetic acid enhanced MR. Besides, the correlation analysis between different MRI-derived parameters make it possible to compare the outcomes from research using different parameters.
There are some limitations to be acknowledged. Firstly, the sample size was limited, only 30 subjects of whom 10 had chronic liver diseases. Since only one patient had Child-Pugh C it was not possible to analyze whether the selected MRI derived parameters correlated to Child-Pugh score. Under this context, some results seemed too ‘perfect’, e.g., the AUROC of LMR was 1.00 and the respective correlation of LSR and LMR to Child-Pugh score was 0.91. Our conclusion should therefore be interpreted and used cautiously. Secondly, the inclusion and exclusion criteria were rough with some inherent bias. For example, the patient group was significantly older than the control group, and the gender distribution was not proportional. Larger studies with more consistent baseline characteristics are required to verify our preliminary findings. Thirdly, we lack data of hepatitis and fibrosis grade and no indocyanine green retention test was done. However, clinical classification systems, like Child-Pugh score and MELD, are also reliable and commonly-used for liver function assessment in MRI liver function studies [Citation19,Citation25–27]. Lastly, due to the limited sample size, we did not perform multivariable regression analysis to verify the independently predictive role of MRI derived liver function parameters on the clinical scoring systems (Child-Pugh score and MELD score).
In conclusion, simple SI based parameters were as good as more complex parameters in assessing liver function at gadoxetic acid enhanced MR. For clinical routine use, LMR seems to be an easy-to-use parameter for quantitative evaluation of liver function.
Ethics approval and consent to participate
The authors are accountable for all aspects of the work in ensuring that questions related to the accuracy or integrity of any part of the work are appropriately investigated and resolved. The study was conducted in accordance with the Declaration of Helsinki (as revised in 2013). The permit number(s) from the Regional Ethical Review Board in Stockholm (Regionala Etikprövningsnämnden i Stockholm) is 04-721/1.
Informed consent
Written informed consent was waived from all patients due to the nature of a retrospective study.
Author contributions
Conception and design: Q.W and T.B.B; Administrative support: H.N and T.B.B; Provision of study materials or patients: H.N., E.S. and T.B.B; Collection and assembly of data: Q.W. and H.N; Data analysis and interpretation: Q.W., S.K., M.L. and T.B.B; Original draft writing: Q.W; Writing review and editing: Y.Z, T.B.B and E.S and Final approval of manuscript: all authors.
| Abbreviations | ||
| MR | = | Magnetic Resonance |
| SI | = | Signal Intensity |
| MELD | = | Model for End-tage Liver-Disease |
| LMR | = | Liver-to-Muscle Ratio |
| CLD | = | Chronic Liver Disease |
| DHCE-MRI | = | Dynamic-Hepatocyte-Specific Contrast-Enhanced MRI |
| LSR | = | Liver-to-Spleen Ratio |
| LSC_N20 | = | Liver-Spleen contrast ratio at 20min after contrast agent injection |
| Primovist | = | Gadoxetic acid, Gd-EOB-DTPA |
| HEF | = | Hepatic Extraction Fraction |
| irBF | = | input-relative Blood Flow |
| MTT | = | Mean Transit Time |
| tVol | = | Total Liver Volume |
| pVol | = | Liver Parenchymal Volume |
| ROIs | = | Regions of Interest |
| T1red | = | Reduction Rate of T1 Relaxation Time |
| ΔR1 | = | Increase in the Relaxation Rate |
| RE | = | Relative Enhancement |
| ΔLMR | = | Increase Rate of LMR |
| HUI | = | Hepatocellular Uptake Index |
| T120min | = | T1 relaxation time at 20 min after contrast agent injection |
| Khep | = | Hepatic uptake rate. |
Supplemental Material
Download MS Word (478.7 KB)Acknowledgements
The authors would like to thank physicist Sven Petersson for valuable technical consultancy.
Disclosure statement
The authors declare that they have no competing interests.
Data availability statement
The datasets used and/or analysed during the current study available from the corresponding author upon reasonable request.
Additional information
Funding
References
- Van Beers BE, Pastor CM, Hussain HK. Primovist, eovist: what to expect? J Hepatol. 2012;57(2):421–429.
- Schwope RB, May LA, Reiter MJ, et al. Gadoxetic acid: pearls and pitfalls. Abdom Imaging. 2015;40(6):2012–2029.
- Nilsson H, Karlgren S, Blomqvist L, et al. The inhomogeneous distribution of liver function: possible impact on the prediction of post-operative remnant liver function. HPB. 2015;17(3):272–277.
- Okubo H, Mogami M, Ozaki Y, et al. Liver function test by gadolinium-ethoxybenzyl-diethylenetriamine pentaacetic acid-enhanced magnetic resonance imaging with consideration of intrahepatic regional differences. Hepatogastroenterology. 2013;60(127):1547–1551.
- Barth BK, Fischer MA, Kambakamba P, et al. Liver-fat and liver-function indices derived from Gd-EOB-DTPA-enhanced liver MRI for prediction of future liver remnant growth after portal vein occlusion. Eur J Radiol. 2016;85(4):843–849.
- Theilig D, Steffen I, Malinowski M, et al. Predicting liver failure after extended right hepatectomy following right portal vein embolization with gadoxetic acid-enhanced MRI. Eur Radiol. 2019;29(11):5861–5872.
- Geisel D, Ludemann L, Hamm B, et al. Imaging-Based liver function Tests-Past, Present and Future. Rofo. 2015;187(10):863–871.
- Tajima T, Takao H, Akai H, et al. Relationship between liver function and liver signal intensity in hepatobiliary phase of gadolinium ethoxybenzyl diethylenetriamine pentaacetic acid-enhanced magnetic resonance imaging. J Comput Assist Tomogr. 2010;34(3):362–366.
- Yamada A, Hara T, Li F, et al. Quantitative evaluation of liver function with use of gadoxetate disodium-enhanced MR imaging. Radiology. 2011;260(3):727–733.
- Brismar TB, Dahlstrom N, Edsborg N, et al. Liver vessel enhancement by Gd-BOPTA and Gd-EOB-DTPA: a comparison in healthy volunteers. Acta Radiol. 2009;50(7):709–715.
- Choi Y, Huh J, Woo DC, et al. Use of gadoxetate disodium for functional MRI based on its unique molecular mechanism. Br J Radiol. 2016;89(1058):20150666.
- Bae KE, Kim SY, Lee SS, et al. Assessment of hepatic function with Gd-EOB-DTPA-enhanced hepatic MRI. Dig Dis. 2012;30(6):617–622.
- Haimerl M, Verloh N, Zeman F, et al. Gd-EOB-DTPA-enhanced MRI for evaluation of liver function: Comparison between signal-intensity-based indices and T1 relaxometry. Sci Rep. 2017;7:43347.
- Yoneyama T, Fukukura Y, Kamimura K, et al. Efficacy of liver parenchymal enhancement and liver volume to standard liver volume ratio on Gd-EOB-DTPA-enhanced MRI for estimation of liver function. Eur Radiol. 2014;24(4):857–865.
- Kamimura K, Fukukura Y, Yoneyama T, et al. Quantitative evaluation of liver function with T1 relaxation time index on Gd-EOB-DTPA-enhanced MRI: comparison with signal intensity-based indices. J Magn Reson Imaging. 2014;40(4):884–889.
- Dahlqvist Leinhard O, Dahlstrom N, Kihlberg J, et al. Quantifying differences in hepatic uptake of the liver specific contrast agents Gd-EOB-DTPA and Gd-BOPTA: a pilot study. Eur Radiol. 2012;22(3):642–653.
- de Bazelaire CM, Duhamel GD, Rofsky NM, et al. MR imaging relaxation times of abdominal and pelvic tissues measured in vivo at 3.0 T: preliminary results. Radiology. 2004;230(3):652–659.
- Nilsson H, Blomqvist L, Douglas L, et al. Gd-EOB-DTPA-enhanced MRI for the assessment of liver function and volume in liver cirrhosis. Br J Radiol. 2013;86(1026):20120653.
- Tamada T, Ito K, Higaki A, et al. Gd-EOB-DTPA-enhanced MR imaging: evaluation of hepatic enhancement effects in normal and cirrhotic livers. Eur J Radiol. 2011;80(3):e311-316–e316.
- Kubota K, Tamura T, Aoyama N, et al. Correlation of liver parenchymal gadolinium-ethoxybenzyl diethylenetriaminepentaacetic acid enhancement and liver function in humans with hepatocellular carcinoma. Oncol Lett. 2012;3(5):990–994.
- Nishie A, Ushijima Y, Tajima T, et al. Quantitative analysis of liver function using superparamagnetic iron oxide- and Gd-EOB-DTPA-enhanced MRI: comparison with technetium-99m galactosyl serum albumin scintigraphy. Eur J Radiol. 2012;81(6):1100–1104.
- Ozaki K, Matsui O, Kobayashi S, et al. Selective atrophy of the Middle hepatic venous drainage area in hepatitis C-related cirrhotic liver: morphometric study by using multidetector CT. Radiology. 2010;257(3):705–714.
- Li WX, Zhao XT, Chai WM, et al. Hepatitis B virus-induced liver fibrosis and cirrhosis: the value of liver and spleen volumetry with multi-detector spiral computed tomography. J Dig Dis. 2010;11(4):215–223.
- Materne R, Smith AM, Peeters F, et al. Assessment of hepatic perfusion parameters with dynamic MRI. Magn Reson Med. 2002;47(1):135–142.
- Katsube T, Okada M, Kumano S, et al. Estimation of liver function using T1 mapping on Gd-EOB-DTPA-enhanced magnetic resonance imaging. Invest Radiol. 2011;46(4):277–283.
- Saito K, Ledsam J, Sourbron S, et al. Assessing liver function using dynamic Gd-EOB-DTPA-enhanced MRI with a standard 5-phase imaging protocol. J Magn Reson Imaging. 2013;37(5):1109–1114.
- Verloh N, Haimerl M, Zeman F, et al. Assessing liver function by liver enhancement during the hepatobiliary phase with Gd-EOB-DTPA-enhanced MRI at 3 tesla. Eur Radiol. 2014;24(5):1013–1019.