
 ?Mathematical formulae have been encoded as MathML and are displayed in this HTML version using MathJax in order to improve their display. Uncheck the box to turn MathJax off. This feature requires Javascript. Click on a formula to zoom.
Abstract
Background
Detecting pancreatic cancer at an earlier stage may contribute to an increased survival. Patients with stage I pancreatic cancer have a 5-year survival rate of 36%, while stage IV patients have a 5-year survival rate of 1% in Sweden. Research into novel blood-based biomarkers for pancreatic cancer is highly intensive and innovative, but has yet to result in any routine screening test. The aim of this study was to evaluate the specificity and sensitivity of a hypothetical blood test for pancreatic cancer used for screening purposes and the economic aspects of testing.
Method
A model of a screening test was created, with varying specificity and sensitivity both set at 80%, 85%, 90%, 95% or 99% and applied to selected risk groups. Excessive costs of false positive screening outcomes, QALYs, ICERs and total costs were calculated.
Results
Individuals with family history and genetic mutations associated with pancreatic cancer, new-onset diabetes ≥50 years of age and early symptoms had the highest positive predictive values and ICERs beneath the willingness-to-pay-level of EUR 100,000/QALY. Screening of the general population and smokers resulted in a high rate of false positive cases and extensive extra costs.
Conclusions
General screening for pancreatic cancer is not cost-effective, while screening of certain high-risk groups may be economically justified given the availability of a high-performing blood-based test.
Introduction
Pancreatic cancer has an overall 5-year survival rate of 6%. Stage I patients have a 5-year survival rate of 36% compared with a 5-year survival rate of 1% when the disease reaches stage IV (). There is even a difference in 5-year survival between stage IA and IB, 54% versus 30% [Citation1]. Despite advancements in surgical and oncological treatment, the survival rate of pancreatic cancer is comparable to the survival rate from the 1980s [Citation2,Citation3]. Surgical treatment is the only potentially curative treatment, with a 5-year survival rate between 17% and 22% in Sweden. Radical surgery (R0) in patients with no lymph node spread (N0), and adjuvant chemotherapy, may increase the estimated 5-year survival to >50% [Citation1]. However, at most 20% of all patients qualify for surgery [Citation4], making early detection of pancreatic cancer an important factor contributing to improved survival. It has been estimated that early pancreatic cancer grows rapidly and progresses on average to T4 stage in just over 1 year [Citation5].
Figure 1. Survival of pancreatic cancer in Sweden stratified by stage I to IV [Citation1].
![Figure 1. Survival of pancreatic cancer in Sweden stratified by stage I to IV [Citation1].](/cms/asset/bafc761c-a693-41f5-98c3-f530db2da77d/igas_a_2142481_f0001_c.jpg)
Between 5% and 10% of pancreatic cancer patients have a familial or genetic background. Surveillance often consists of magnetic resonance imaging (MRI) and endoscopic ultrasound (EUS) [Citation6]. Other risk factors for pancreatic cancer include diabetes, cigarette smoking, obesity, chronic pancreatitis and pancreatic cysts [Citation3]. Approximately half of pancreatic cancer patients have diabetes mellitus at the time of diagnosis, which is predominantly new-onset (<2 years in duration) and likely induced by the tumor [Citation7]. Tumor-derived and immunoregulatory proteins and various liquid biopsy approaches, such circulating tumor DNA, circulating tumor cells and exosomes have been evaluated in diagnostic settings [Citation8–13], but still no blood-based screening test is routinely used for pancreatic cancer in a clinical setting. Screening tests need to fulfill several criteria, including being capable to detect disease in its preclinical state, be safe, inexpensive and easy to administer and lead to improve health outcomes [Citation14].
Pancreatic cancer generates a large economic burden on society due to a high associated morbidity and mortality [Citation15]. In Sweden, the societal costs of pancreatic cancer were approximated to €125 million in 2018 and between €210 million (+68%) and €225 million (+80%) in 2030 [Citation16], largely due to the increasing incidence of the disease and changing demographics [Citation17].
The aim of this study was to evaluate the cost-effectiveness of screening for pancreatic cancer in Sweden using a hypothetical blood-based biomarker test with predetermined sensitivity and specificity in the general population and selected high-risk cohorts.
Method
Screening model
The specificity and sensitivity of the hypothetical screening test were both set at 80%, 85%, 90%, 95% or 99%. Test specifications such as accuracy, PPV and NPV were calculated. Pretest and posttest probabilities were calculated. Individuals chosen for hypothetical screening were the general population between 50 and 79 years, daily cigarette smokers between 50 and 79 years [Citation18,Citation19], individuals at risk for developing familial or hereditary pancreatic between 40 and 79 years [Citation20], individuals with new-onset diabetes between 50 and 79 years [Citation7,Citation21,Citation22], and individuals with early symptoms suggesting pancreatic cancer between 40 and 79 years [Citation23]. The age gap between 50 and 79 years was chosen due to cancer-specific incidence rates, and between 40 and 79 for individuals with a family history of pancreatic cancer and genetic mutations as screening in this group usually start at an younger age [Citation3].
The number of patients with new-onset diabetes was multiplied by the ratio of patients with simultaneous diabetes and pancreatic cancer, and the ratio of patients diagnosed with diabetes within two years prior to the cancer diagnosis, giving the number of patients who in theory could selected by screening. The number of patients with familial/hereditary pancreatic cancer and mean number of at-risk kindreds were acquired from Klein et al. [Citation20] and adapted to a Swedish setting. Early symptoms such as weight loss, abdominal pain, lethargy, and dyspepsia has been seen in up to two years before cancer diagnosis. The number of pancreatic cancer patients were multiplied by the ratio of pancreatic cancer patients with symptoms within 2 years pre-diagnosis [Citation23] and divided by the prevalence of pancreatic cancer within the early symptoms group to acquire the size of the potential screening population. These groups were chosen due to increased incidence of pancreatic cancer.
The incidence of pancreatic cancer in Sweden in 2020 was obtained [Citation24], divided into Localized (stage I-IIA), Regional (stage IIB-III), Distant (stage IV) and Unknown (unknown stage) [Citation25] and, split by sex and 5-year groups. Yearly survival up to 5 years after diagnosis was acquired [Citation1] and total number of patients were calculated for every year until 5 years post-diagnosis. Aggregated QALYs were calculated, pre- and post-screening, by multiplying the stage-specific mean life expectancy [Citation26] with health-related quality of life of pancreatic cancer patients [Citation27], and discounted by 3% [Citation28].
True positive screening cases were assumed to be diagnosed in localized stage, therefore shifting the stage-distribution towards the localized stage. This assumption was based on research showing that patients diagnosed in stage I were on average 1.3 adjusted years younger than patients diagnosed in stage IV. Similarly, patients with T1 cancers without distant metastasis were 1.06 and 1.19 years younger than patients with T2 and T3 cancers, respectively [Citation5].
Cost estimation
The Swedish Dental and Pharmaceutical Benefits Agency recommend a social economy perspective on health economic calculations. This includes costs of the disease, independent of the liable instance e.g., private person, state or municipality [Citation28]. A model of the direct and indirect cost of pancreatic cancer was created, following the recommendations of the Swedish Dental and Pharmaceutical Benefits Agency’s recommendations for health economic analysis [Citation28], and applied on pre- (current state) and post-screening stage distributed cases of pancreatic cancer. The direct cost was based on mean numbers of utilized resources and include diagnostics, surgery, oncology [Citation15,Citation29–33] and palliative care [Citation34]. All stages contributed to costs of diagnostics and oncology. Only Localized and Regional stages contributed to costs of surgery. Only Distant and Unknown stages contributed to costs of palliation. The indirect cost constitutes of loss of household production due to hospitalization and production loss due to premature mortality and are based on readily available data from Swedish statistics and relevant literature [Citation15,Citation29,Citation35–41], and calculated according to the following formula [Citation42]:
where ICPC = indirect cost of pancreatic cancer, P = value of lost production for persons of sex k and age a; k = sex; a = age; R = retirement age; E = employment to populations ratio for persons of sex k and age a; F = Social fees; S = survival rate for persons of sex k and age a to live to n years; L = lost production years for persons of sex k and age a; g = growth rate; r = discount rate; H = value of lost household production for persons of sex k and age a; W = number of weeks in a year; h = mean number of hours worked in a week for persons of sex k and age a; t = mean final tax for persons of sex k and age a; t = mean final tax for persons of sex k and age a; I = mean disability grade for persons of sex k and age a. The growth rate was set to 2.4% [Citation43] and the discount rate set to 3%, a commonly used discount rate in Sweden [Citation28]. An example of these values is presented in .
Table 1. Variables used in the cost estimation.
All false positive cases underwent diagnostics which included radiological examinations such as CT scans, abdominal ultrasound, MRI of the pancreas and ERCP, and were based on mean numbers of such examinations that patients with pancreatic cancer undergo and multiplied by the number of false positive cases [Citation15,Citation29,Citation31,Citation33,Citation44] (). The cost of this examination was included in the screening cost. We assumed that these false positive screening cases would later be identified as false positive and would not undergo any surgery or treatment.
Table 2. Cost items included in diagnostics of false positive screening cases, number per patient and cost in SEK [Citation15,Citation31–33].
All costs were calculated in SEK and converted to EUR following the yearly average exchange rate of 2018 (EUR 1= SEK 10.2567). The calculations are based on a one-time screening of the groups. Incremental cost-effectiveness ratio (ICER) was calculated for every screening group and sensitivity/specificity level of the test using the following formula:
where A is post-screening and B is pre-screening.
Results
The familial/hereditary and early symptoms risk groups had the highest positive predictive value in this hypothetical screening. Due to low pretest probability, the general population and smokers generated extensive extra costs. Low pretest probability generated large numbers of false positive cases which contributed to high costs. The new-onset diabetes group had a relatively high positive predictive value with low numbers of false positive cases, i.e., low extra costs. The test specifications are presented in and . The pretest and posttest probability are presented in . Pretest aggregated QALYs were calculated to 971. Post-test aggregated QALYs varied between 1042 and 1803 depending on the screening group and the test. ICER varied between EUR −17,829 and 1,091 for the early symptoms group, EUR 65,989 and 1,952,920 for the general population, EUR −10,115 and 80,267 for the new-onset diabetics, EUR 3,707 and 37,881 for the familial/hereditary group, and between EUR 63,679 and 2,015,078 for smokers depending on the test ().
Figure 2. Positive and negative predictive values (PPV and NPV) for a blood test used to detect pancreatic cancer among different populations. The solid lines represent PPV (y-axis to the left) and the dotted lines represent NPV (y-axis to the right) when the test has a specificity of 0.80, 0.85, 0.90, 0.95 and 0.99.
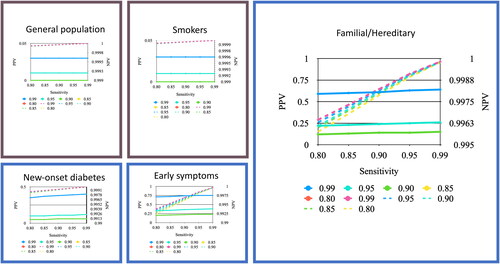
Figure 3. ICER of a blood test used to detect pancreatic cancer among different populations. The y-axis starts at EUR -50,000 as some ICERs were negative. The ICER for the general population and smokers continued over EUR 400,000 and are not visualized. Willingness to pay at EUR 100,000 is marked.
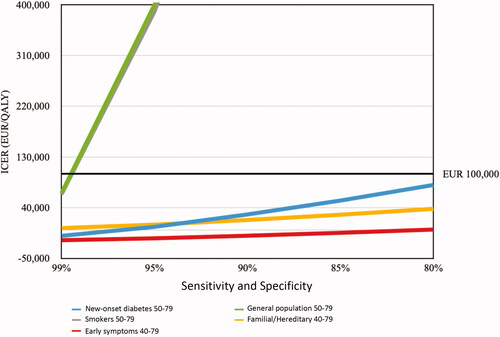
Table 3. Variables associated with the change in the specificity and sensitivity of the test.
Table 4. The pretest and posttest probability for a hypothetical test with sensitivity and specificity both set at 90% or 99%.
The outcomes of hypothetical screening in each risk category are exemplified below.
General population, aged 50–79 years
A 60-year-old non-smoking male with hypertension. Testing this man for pancreatic cancer with a screening tool with very high sensitivity and specificity both set at 99% would still yield a PPV of 3% and NPV of 99.9997%. Yearly screening of the general population would cost approximately EUR 66 million in excess costs associated with extended diagnostics of false positive cases.
Smokers, aged 50–79 years
A 70-year-old female with COPD, smoker since 40 years. Using the same test with both sensitivity and specificity of 99% would still yield a PPV and NPV like the previous case. The excess costs of a yearly screening of smokers would in total be EUR 8 million. Screening would be indefensible from an economical point of view. Tests with lower sensitivity and specificity generate more false positive cases and higher excess costs.
Familial/hereditary background, aged 40–79 years
A 45-year-old non-smoking and healthy female with family history of pancreatic cancer. A screening test with 99% specificity and sensitivity would yield a PPV 63% and an NPV 99.9828%. Yearly excess costs of diagnosing false positive cases in this group account for EUR 125,000.
A 55-year-old non-smoking male with hypertension and family history of pancreatic cancer. A screening test with 80% specificity and sensitivity would yield PPV 6% and NPV 99.5753%. Yearly excess costs of diagnosing false positive cases in this group account for EUR 2,500,000.
New-onset diabetes, 50–79 years
A 55-year-old non-smoking male with hypertension and recently diagnosed diabetes mellitus type 2. A test with 99% specificity and sensitivity would yield PPV 40% and NPV 99.9933%. The yearly excess costs in this group would account for EUR 593,000.
A 67-year-old non-smoking female with transitory ischemic attack 2 years ago and recently diagnosed diabetes mellitus type 2. A test with 95% specificity and sensitivity would yield PPV 11% and NPV 99.9651%. The excess costs would be EUR 3 million.
Early symptoms, 40–79 years
A 60-year-old, previously healthy and non-smoking male presents to the primary care with nausea, fatigue, and mid-back pain since a few months. A test with 99% specificity and sensitivity would yield PPV 75% and NPV 99.9688%. The excess costs would be EUR 632,000.
A 48-year-old non-smoking male presents to the primary care with unexplained weight loss and depression. A test with 95% specificity and sensitivity would yield PPV 37% and NPV 99.8374%. The excess costs would be EUR 3 million.
Discussion
The time it takes for pancreatic cancer to develop and progress is uncertain. It has been estimated that it may take 10 years for a non-metastatic pancreatic tumor to develop after the initial mutation and at least five more years to develop metastatic ability [Citation45]. However, once a tumor is clinically detectable the progression is rapid. A T1 tumor may grow into a T4 tumor in just over one year [Citation5] leading to abrupt death within a few months. Elevated levels of CA 19-9 have been observed two years prior to diagnosis with promising sensitivity and specificity 0–6 months prior the diagnosis [Citation46]. This leaves a potential window for early diagnosis. A screening test should aim to detect resectable, early-stage pancreatic cancer () and high-risk precursor neoplasms with high-grade dysplasia.
Pancreatic cancer has a low incidence (13.7 per 100,000) compared to other cancers, such as breast cancer (131 per 100,000 in females), colorectal cancer (36.8 per 100,000), lung cancer (50.8 per 100,000) and prostate cancer (119 per 100,000) [Citation47]. Low pretest probability, derived from the low incidence in the general population, makes it unsustainable to screen the whole population. This also generates a high rate of false positive outcomes and increases the cost of screening by approximately EUR 2000 per false positive case. Smokers had a similar pretest and posttest probability as the general population (). A way to evade this problem is to select screening groups with higher pretest probability (i.e., with higher prevalence), such as individuals with family history and genetic mutations, new-onset diabetes, or early symptoms.
The group with early alarm symptoms has an estimated 3% prevalence of pancreatic cancer. These patients may present with alarm symptoms 2 years prior to the clinical diagnosis [Citation23], most commonly to their primary care practitioner. The general practitioners face an immense challenge selecting patients for further diagnostic work-up. Screening for pancreatic cancer in a two-step manner has been suggested [Citation4]. Pre-selecting a moderate-risk group and using a screening tool to further enrich the group would lead to better pre- and posttest probability. Artificial Intelligence (AI)-based models could aid in this endeavor [Citation48–50]. The quality of the ANN models depends on the level of detail and quality of the data used to train and test the models. Further studies and improved ANN are needed before implementation in clinical practice.
Applying a screening test with higher sensitivity and specificity increases the performance of the test. For example, the posttest probability of the new-onset diabetes group was 0.06 with a test possessing 90% sensitivity and specificity; however, the probability increased to 0.4 with 99% sensitivity and specificity (). As perfect tests are rarely seen in a clinical setting, it is expected that a screening test will not possess 100% sensitivity and specificity. The subsequent consequences are false negative and false positive cases. In this scenario, the false positive cases contributed with costs of diagnostics, because it would be unethical not to move on to further diagnostic work-up. The additional costs of false positive outcomes, if the general population between 50 and 79 years would be screened, stretch up to EUR 66 million and are thus economically unjustifiable. We calculated the economic burden of pancreatic cancer in 2011 to a total of between EUR 96 and 104 million [Citation15] and in 2018 to a total of EUR 125 million in Sweden [Citation16].
Table 5. Screening of new-onset diabetes patients between 50 and 79 years with a hypothetical test with sensitivity and specificity both at 80% or 99%.
Screening of other forms of cancer has shown varied results. Colonoscopy in colorectal cancer has become the gold standard in screening, while mammography in breast cancer and prostate-specific antigen (PSA) in prostate cancer are still debated. PSA has a PPV of 24% in men aged 50–66 years, and could be tweaked up to 36% by combining total PSA with the free/total ratio of PSA [Citation51]. Mammography has a PPV varying between 4.4% and 28.6% for breast cancer in women older than 18 years [Citation52]. The PPVs presented here have comparable values depending on the group and test specifications. The early symptoms group has acceptable PPVs for screening, even in tests with lower specificity (90%) i.e., 22%. Groups with overall higher prevalence (familial/hereditary, new-onset diabetes, early-symptoms) needed better performing tests to achieve PPVs acceptable for screening purposes. PPVs in low-prevalence groups (general population and smokers) were too low to recommend screening and would lead to high numbers of false positive outcomes ( and ).
The Swedish Public Health Agency does not implement a predefined willingness-to-pay-threshold but sets the threshold depending on the severity of the illness and the difficulty of alternative treatments. Nevertheless, there is a generally accepted threshold of EUR 100,000/QALY and costs up to EUR 135,600/QALY being accepted [Citation53]. Based on the screening models and costs presented in the present study, screening would be acceptable for familial/hereditary, new-onset diabetes and early symptoms groups (). The early symptoms group achieved negative values of ICER. The post-test aggregated QALYs for this group were higher than the pre-test aggregated QALYs and the costs were lower, suggesting that screening would be both cheaper and more effective than status quo. Interestingly, at the sensitivity and specificity level of 99%, even the general population and smokers had an ICER of EUR 65,989 and 63,679, respectively. This indicates that if a high-performing screening test could be achieved, even broader screening would be possible.
The results of the present study are dependent on used models and made assumptions. Underestimation of the cost of pancreatic cancer could lead to lower ICER in the screened populations. On the other hand, the same model was used to calculate the pre-screening cost of pancreatic cancer. We assumed that true positive screening cases were diagnosed in the Localized stage. This may not be true, which would lead to lower gain in aggregated QALY and therefore higher ICERs.
Although the focus of this study has been on early diagnosis, a future blood-based biomarker test, likely a multiplex of different markers, may also be useful on other aspects of disease management. In this study, we accounted for single testing, but in a clinical scenario repeated testing may be indicated in individuals at risk of developing pancreatic cancer in asymptomatic as well as symptomatic individuals. A blood-based biomarker test may also be used for precision therapy by selecting individuals that may derive benefit from certain treatments or by monitoring response during therapy. The test may also be used for improved prognostication and staging as a complement to the TNM system.
It must be stated that the issue with lead-time and length bias leaves the benefit of screening uncertain [Citation54]. The clinical and economical consequences of blood-based screening of pancreatic cancer need to be verified by further studies on real-life patients. One important feature of a future test will be ability to distinguish benign pancreatic and hepatobiliary disease from malignant and premalignant disease.
Conclusion
While general population-based screening for pancreatic cancer may not be cost-effective, certain individuals with increased risk of developing pancreatic cancer, such as those with family history/genetic mutations, new-onset diabetes mellitus ≥50 years and early symptoms, may be considered for screening programs from a health economical point of view hingent upon the presence of a high-performing test.
Disclosure statement
RA serves as Chairman of the Board and DA is Scientific Advisor at Reccan.
References
- Regionala cancercentrum i samverkan. Kvalitetsregister för tumörer i pankreas och periampullärt. Årsrapport nationellt kvalitetsregister. 2020. Available from: https://cancercentrum.se/samverkan/.
- Faivre J, Forman D, Esteve J, et al. Survival of patients with primary liver cancer, pancreatic cancer and biliary tract cancer in Europe. EUROCARE working group. Eur J Cancer. 1998;34(14):2184–2190.
- Ansari D, Tingstedt B, Andersson B, et al. Pancreatic cancer: yesterday, today and tomorrow. Future Oncol. 2016;12(16):1929–1946.
- Kenner BJ, Chari ST, Maitra A, et al. Early detection of pancreatic cancer—a defined future using lessons from other cancers: a white paper. Pancreas. 2016;45(8):1073–1079.
- Yu J, Blackford AL, Dal Molin M, et al. Time to progression of pancreatic ductal adenocarcinoma from low-to-high tumour stages. Gut. 2015;64(11):1783–1789.
- Klatte DCF, Boekestijn B, Wasser M, et al. Pancreatic cancer surveillance in carriers of a germline CDKN2A pathogenic variant: yield and outcomes of a 20-year prospective follow-up. J Clin Oncol. 2022;40(28):3267–3277.
- Pannala R, Leirness JB, Bamlet WR, et al. Prevalence and clinical profile of pancreatic cancer-associated diabetes mellitus. Gastroenterology. 2008;134(4):981–987.
- Brand RE, Persson J, Bratlie SO, et al. Detection of early-stage pancreatic ductal adenocarcinoma from blood samples: results of a multiplex biomarker signature validation study. Clin Transl Gastroenterol. 2022;13(3):e00468.
- Pereira SP, Oldfield L, Ney A, et al. Early detection of pancreatic cancer. Lancet Gastroenterol Hepatol. 2020;5(7):698–710.
- Cohen JD, Li L, Wang Y, et al. Detection and localization of surgically resectable cancers with a multi-analyte blood test. Science. 2018;359(6378):926–930.
- Kim J, Bamlet WR, Oberg AL, et al. Detection of early pancreatic ductal adenocarcinoma with thrombospondin-2 and CA19-9 blood markers. Sci Transl Med. 2017;9(398):eaah5583.
- Zhu Y, Zhang H, Chen N, et al. Diagnostic value of various liquid biopsy methods for pancreatic cancer: a systematic review and meta-analysis. Medicine. 2020;99(3):e18581.
- Klein EA, Richards D, Cohn A, et al. Clinical validation of a targeted methylation-based multi-cancer early detection test using an independent validation set. Ann Oncol. 2021;32(9):1167–1177.
- Herman C. What makes a screening exam “good”? Virtual Mentor. 2006;8(1):34–37.
- Tingstedt B, Andersson E, Flink A, et al. Pancreatic cancer, healthcare cost, and loss of productivity: a register-based approach. World J Surg. 2011;35(10):2298–2305.
- Draus T, Ansari D, Wikström F, et al. Projected economic burden of pancreatic cancer in Sweden in 2030. Acta Oncol. 2021;60(7):866-871.
- Gordon-Dseagu VL, Devesa SS, Goggins M, et al. Pancreatic cancer incidence trends: evidence from the surveillance, epidemiology and end results (SEER) population-based data. Int J Epidemiol. 2018;47(2):427–439.
- Johansen D, Borgström A, Lindkvist B, et al. Different markers of alcohol consumption, smoking and body mass index in relation to risk of pancreatic cancer. A prospective cohort study within the malmö preventive project. Pancreatology. 2009;9(5):677–686.
- Statistics Sweden. Tobacco habits by indicator, study domain and sex. Percentage and estimated numbers in thousands. Year 2008-2009 - 2020-2020. 2021.
- Klein AP, Brune KA, Petersen GM, et al. Prospective risk of pancreatic cancer in familial pancreatic cancer kindreds. Cancer Res. 2004;64(7):2634–2638.
- Socialstyrelsen. Diagnoser, Sluten och/eller specialiserad öppen vård, Antal patienter, E11 Diabetes mellitus typ 2, Riket, Ålder: 0-85+. 2019.
- Statistics Sweden. Population by sex, year, region and age. 2020.
- Keane MG, Horsfall L, Rait G, et al. A case-control study comparing the incidence of early symptoms in pancreatic and biliary tract cancer. BMJ Open. 2014;4(11):e005720.
- Socialstyrelsen. Antal nya cancerfall, Ålder: 0-85+, Riket, Diagnos:157 Bukspottkörtel, oavsett tumörtyp 2020. 2021-12-15 edition. 2020.
- National Cancer Institute. Surveillance Epidemiology and End Results (SEER) Program: pancreas; stage distribution of SEER Incidence Cases, 2010-2019. 2022.
- Cucchetti A, Ercolani G, Taffurelli G, et al. A comprehensive analysis on expected years of life lost due to pancreatic cancer. Pancreatology. 2016;16(3):449–453.
- Müller-Nordhorn J, Roll S, Böhmig M, et al. Health-related quality of life in patients with pancreatic cancer. Digestion. 2006;74(2):118–125.
- Tandvårds- och läkemedelsförmånsverket. Tandvårds- och läkemedelsförmånsverkets allmänna råd. 2017.
- Ansari D, Tingstedt B, Andersson R. Pancreatic cancer - cost for overtreatment with gemcitabine. Acta Oncol. 2013;52(6):1146–1151.
- Regionalt cancercentrum Sydöst. Nationellt vårdprogram: bukspottkörtelcancer version 2.0. 2017.
- Alexandersson N, Rosell L, Wihl J, et al. Determinants of variable resource use for multidisciplinary team meetings in cancer care. Acta Oncol. 2018;57(5):675–680.
- Regionala cancercentrum i samverkan. Kvalitetsregister för tumörer i pankreas och periampullärt. Årsrapport 2018. 2018.
- Södra Regionvårdsnämnden. Regionala priser och ersättnignar för södra sjukvårdsregionen. 2019.
- Ljungman D, Hyltander A, Lundholm K. Cost-utility estimations of palliative care in patients with pancreatic adenocarcinoma: a retrospective analysis. World J Surg. 2013;37(8):1883–1891.
- Statistics Sweden. Swedish Time Use Survey 2010/11. Statistics Sweden; 2010/11.
- Statistics Sweden Average number of hours (actually) worked per week for employed persons aged 15-74 (LFS), hours by degree of attachment to the labour market, sex, age and year. 2021.
- Statistics Sweden. Final tax 2020. 2020-01-29 edition. Cited 2022 Sep 14.
- Statistics Sweden. Number of years remaining by year, level of education, region of birth, sex and age. 2020.
- Statistics Sweden. Grundtabeller AKU, 15–74 år, årsmedeltal enligt internationell definition. 2022-05-25 edition. Cited 2022 Sep 15.
- Ekonomifakta. https://www.ekonomifakta.se/Fakta/Skatter/Skatt-pa-arbete/Sociala-avgifter/.
- Försäkringskassan. Additional cost allowance for adults. Försäkringskassan; 2019.
- Myndigheten för samhällsskydd och beredskap. Beräkning av produktionsbortfall. Ett underlag för beräkning av samhällets kostnader för olyckor 2015. 2019.
- Almerud JET, Forsfält T, Glans E. Sveriges ekonomi – scenarier fram till år 2060. 2015.
- Sveriges Kommuner och Regioner. Bukspottkörtelcancer Nationellt Vårdprogram Version 3.1. 2021.
- Yachida S, Jones S, Bozic I, et al. Distant metastasis occurs late during the genetic evolution of pancreatic cancer. Nature. 2010;467(7319):1114–1117.
- Fahrmann JF, Schmidt CM, Mao X, et al. Lead-time trajectory of CA19-9 as an anchor marker for pancreatic cancer early detection. Gastroenterology. 2021;160(4):1373–1383.e6. e1376.
- Surveillance Epidemiology and End Results (SEER) Program. SEER*Explorer. 2018.
- Muhammad W, Hart GR, Nartowt B, et al. Pancreatic cancer prediction through an artificial neural network. Front Artif Intell. 2019;2:2.
- Malhotra A, Rachet B, Bonaventure A, et al. Can we screen for pancreatic cancer? Identifying a Sub-population of patients at high risk of subsequent diagnosis using machine learning techniques applied to primary care data. PLoS One. 2021;16(6):e0251876.
- Hsieh MH, Sun LM, Lin CL, et al. Development of a prediction model for pancreatic cancer in patients with type 2 diabetes using logistic regression and artificial neural network models. Cancer Manag Res. 2018;10:6317–6324.
- Hugosson J, Aus G, Bergdahl S, et al. Population-based screening for prostate cancer by measuring free and total serum prostate-specific antigen in Sweden. BJU Int. 2003;92(Suppl 2):39–43.
- Lehman CD, Arao RF, Sprague BL, et al. National performance benchmarks for modern screening digital mammography: update from the breast cancer surveillance consortium. Radiology. 2017;283(1):49–58.
- Svensson M, Nilsson FO, Arnberg K. Reimbursement decisions for pharmaceuticals in Sweden: the impact of disease severity and cost effectiveness. Pharmacoeconomics. 2015;33(11):1229–1236.
- Poruk KE, Firpo MA, Adler DG, et al. Screening for pancreatic cancer: why, how, and who? Ann Surg. 2013;257(1):17–26.