
Abstract
Background
Response evaluation after induction therapy with ustekinumab (UST) in Crohn’s disease (CD) is important for decisions on maintenance therapy. We aimed to assess the potential of fecal calprotectin (FC) levels to predict endoscopic response at week 16.
Methods
CD patients with FC >100 µg/g and endoscopic active disease (SES-CD> 2, Rutgeerts’ score ≥ i2) at initiation of UST therapy were enrolled. FC was determined at weeks 0, 2, 4, 8 and 16 and patients underwent a colonoscopy at week 16. The primary outcome was an endoscopic response at week 16 (SES-CD score ≥50% decrease or a decrease of ≥1 points in Rutgeerts’ score). The optimal cut-off levels of FC and change in FC to predict endoscopic response were determined using ROC statistics.
Results
59 CD patients were included. Endoscopic response was observed in 21/59 (36%) patients. The diagnostic accuracy for FC levels at week 8 to predict endoscopic response at week 16 showed a predictive value of 0.71. A decrease in FC levels ≥500 µg/g between baseline at week 8 indicates endoscopic response (PPV = 89%), whereas absence of any decrease indicates endoscopic non-response after induction (NPV = 81%).
Conclusions
Continuation of UST therapy without endoscopic response evaluation may be considered in patients with a decrease in FC levels of ≥500 µg/g at week 8. The decision on continuation of UST therapy or therapy optimization needs reconsideration in patients without a decrease of FC level. In all other patients, endoscopic response evaluation of induction therapy remains essential for therapeutic decisions.
Introduction
Ustekinumab (UST) is a humanized monoclonal antibody targeting the p40 subunit of the IBD-associated cytokines IL12 and IL23. UST is an effective therapy for Crohn’s disease (CD), according to the registration trials and data in real world cohort studies [Citation1,Citation2]. UST may result in rapid symptom improvement in Crohn’s disease (CD) patients with observed steroid-free clinical remission in up to 31% of patients at week 12, however, a later clinical response at week 24 has been observed in an additional 7–14% [Citation1,Citation3,Citation4]. Data at these time points are unavailable for endoscopic response. A delayed endoscopic response has been reported after the induction phase, with endoscopic response rates of 21–24% at week 24 increasing to 33–55% at week 52 [Citation4–6].
Therefore, the ideal method and timing of UST response evaluation remains unknown. More objective, adequate and timely identification of early or late responders as well as non-responders is highly important to guide clinical decision making and to avoid unnecessary treatment in non-responders, delayed optimization of treatment in partial responders or unnecessary discontinuation of therapy in delayed responders.
Inadequately timing of response evaluation regarding the effect of UST might lead to either under or over treatment in a substantial proportion of patients. Although endoscopic response evaluation plays an essential role in the management and treatment of CD and is recommended by international guidelines after the start of new medical therapies to identify mucosal improvement, non-invasive response evaluation is preferred due to the disadvantages of endoscopic response evaluation including invasiveness and costs [Citation7,Citation8].
Fecal calprotectin (FC) is an well-studied inflammatory biomarker to guide diagnostic and therapeutic decisions, due to its stability, assay reproducibility and low costs [Citation9]. FC levels have proven high specificity and sensitivity for endoscopic disease activity and is an accessible, non-invasive, and accurate biomarker reflecting intestinal mucosal improvement and would be ideal to evaluate response [Citation10–12]. To what extent FC levels can predict endoscopic response or histologic induction of remission in CD patients exposed to UST is as yet unknown. In this prospective cohort study, we aimed to assess the potential of early FC levels after UST induction to predict endoscopic response and histologic remission.
Material and methods
Study design and population
A single-center, prospective cohort study was conducted at the Erasmus University Medical Center (Rotterdam, the Netherlands) between December 2016 and December 2019. Consecutive CD patients aged 18 years and older, with both biochemical (FC >100 µg/g) and endoscopic active disease (SES-CD > 2 or Rutgeerts’ score ≥ i2) were considered eligible for inclusion.
Ustekinumab therapy
UST therapy was started at the discretion of the treating physician. The initial intravenous infusion with UST at baseline was weight-based, according to label (≈6 mg/kg; 260 mg <55kg, 390 mg between 55 kg and 85 kg, 520 mg >85kg). The first subcutaneous dose (90 mg) was administered after 8 weeks. Patients with a confirmed endoscopic response at week 16 continued UST maintenance therapy, receiving a dose of 90 mg subcutaneously every 8 or 12 weeks, at the discretion of the treating physician. Concomitant medication (corticosteroids and immunomodulators) during UST treatment was allowed. After UST induction, systemic corticosteroids were tapered to zero at a rate of 5 mg per 1 to 2 weeks, and budesonide was tapered at a rate of 3 mg every 2 to 6 weeks. If tapering failed, the lowest effective dose of corticosteroid was re-introduced at the discretion of the treating physician.
Data collection
Baseline demographic characteristics were collected, including gender, age, smoking status, disease characteristics according to the Montreal classification [Citation13], history of IBD related surgery and treatment history. The clinical disease activity score (the Harvey Bradshaw Index, HBI [Citation14]) was evaluated at baseline, week 8 and week 16. Serum samples were taken at baseline, week 8 and week 16 and included C-reactive protein (CRP), leukocytes, platelets, hemoglobin and albumin. Serum samples were collected and stored at week 16. UST serum levels were measured at week 16 by ELISA, according to the manufacturer’s protocol (LISA Tracker, Theradiag®).
FC levels were determined at baseline, week 2, week 4, week 8 and week 16 using the QuantOn cal (QoC) FC home test (Preventis, Germany) or a quantitative enzyme-linked immunosorbent assay (ELISA) (Bühlmann Laboratories AG, Schönenbuch, Switzerland). All patients were offered the QoC FC home test. If the patient was unable to use the FC home test (due to various reasons), they were offered the ELISA laboratory tests.
Endoscopy was performed at week 16. Endoscopic inflammation was determined using the simple endoscopic score (SES-CD) and the Rutgeerts’ score for patients after ileocolonic resection (Supplementary Table 1). During endoscopy, ileal and segmental colonic [ascending, transverse, and descending colon as well as from the sigmoid and rectum] biopsies were collected; whenever possible from inflamed and non-inflamed mucosa. Biopsies were formalin fixed and paraffin embedded for assessment of histological inflammation by the GHAS score [Citation15] by two expert gastrointestinal pathologists (MD and LO).
Outcomes and definitions
The primary outcome was endoscopic response at week 16 after start of UST therapy, defined as ≥50% decrease in SES-CD score, a decrease of 1 or more points in the Rutgeerts’ score or a decrease of ≥ 1 point on the four-grade scale mentioned in the Supplementary Table 1 as judged by the endoscopist in patients with an ileostomy, ileoanal pouch anastomosis or ileorectal anastomosis. Secondary outcomes included endoscopic and histologic remission at week 16 and clinical response and remission at week 16. Clinical response was defined as a decrease of ≥3 points in HBI score as compared to baseline. Clinical remission was defined as a HBI score ≤4. Biochemical remission was defined as a FC< 250 µg/g and CRP < 10 mg/L. Endoscopic remission was defined as SES-CD ≤ 2, a Rutgeerts score of i0 or i1, or as ‘no endoscopic disease activity’ on the four-grade scale mentioned in Supplementary Table 1. Histological remission was defined as GHAS ≤ 4 points, and severe disease activity was defined as GHAS ≥ 10 points (Supplementary Table 2).
Statistical analyses
Normally distributed data are presented as mean ± standard deviation (SD) and continuous data with a skewed distribution as median and the first and third quartile (Q1-Q3). Categorical data are presented as numbers and percentages. Chi-square tests and Wilcoxon Rank Sum tests were used to evaluate differences between endoscopic responders and non-responders and for patients being in histologic remission or not, for categorical and continuous non-normally distributed variables, respectively. The optimal (the best discriminatory performance and clinically relevant) cut-off levels of FC and relative change in FC to predict endoscopic response were determined using receiver operating characteristic (ROC) statistics. Area under the curve [AUC], sensitivity, specificity, positive predictive value (PPV) and negative predictive value (NPV) of FC to predict endoscopic response and histologic remission were calculated by cross-tabulation. A two-sided P-value of <0.05 was considered statistically significant. All statistical analyses were performed using IBM SPS Statistics version 25.0 (IBM Corp. Released 2013, IBM Corp, Armon, NY).
Ethical considerations
This study protocol was reviewed and approved by the Medical Ethics Committee (METC) Rotterdam (MEC 2004-168 2012), The Netherlands. Informed consent was obtained from all individual participants included in the study. All procedures performed in studies involving human participants were in accordance with the ethical standards of the institutional and/or national research committee and with the 1964 Helsinki Declaration and its later amendments or comparable ethical standards.
Results
A total of 93 patients started UST during the study period, of whom 59 patients met the inclusion criteria and were enrolled (). The majority of the included patients were female (64%) with a median age of 38 years (interquartile range [IQR] 26–52) (). UST was initiated after a median disease duration of 12.8 years (IQR 8.1–18.1). All patients were exposed to anti-TNF therapy prior the start of UST, of whom a majority (88%) previously failed two or more anti-TNF agents. In total, 52/59 (88%) patients were anti-TNF refractory defined as primary clinical failure of secondary loss of clinical response. In addition, 30 (51%) patients had been exposed to vedolizumab, of whom 27/30 (90%) had refractory disease to vedolizumab. A total of 42/59 (72%) patients, received concomitant immunosuppressive medication. In 34/59 (58%) patients, UST was combined with corticosteroid induction therapy (13 prednisone; 21 budesonide) and 8/59 (14%) patients were on concomitant immunomodulator therapy (thiopurines n = 3, tioguanine n = 4, tacrolimus n = 1) during UST induction. Corticosteroids were tapered in 19/34 (56%) patients at week 16.
Figure 1. Flow chart of patients.
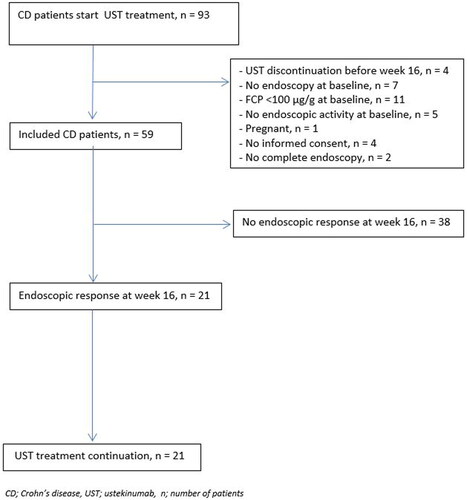
Table 1. Baseline patient characteristics.
Response to UST induction
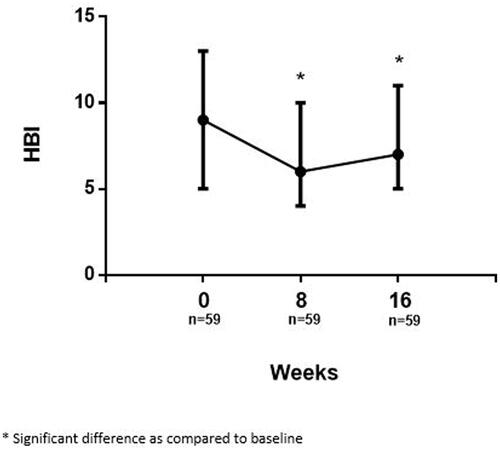
The median HBI score at baseline was 9 (IQR 5–13) which significantly decreased to 6 (IQR 4–10, p < 0.001) at week 8 after intravenous administration of UST therapy. A slight increase of the HBI score to 7 (IQR 5–11) was observed at week 16, however the HBI remained significantly lower compared with baseline (p = 0.016) ().
Figure 2. Serial median HBI during UST induction.
Clinical response 8 weeks after initiation of UST therapy was observed in 28/59 (48%) patients, and in 26/59 (44%) at week 16. Clinical remission was observed in 20/59 (34%) and 12/59 (20%) patients at week 8 and 16, respectively.
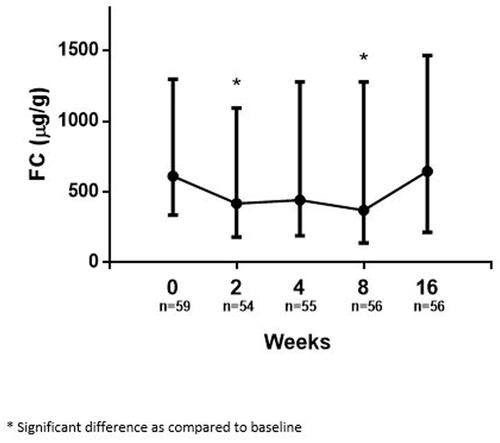
Median FC significantly decreased from 611 µg/g at baseline (IQR 335–1297) to 417 µg/g at week 2 (IQR 181–1092, p = 0.008). Thereafter, no significant further decrease was observed at week 4 (441 µg/g, IQR 189–1279, p = 0.076). At week 8, FC decreased significantly further to 370 µg/g (IQR 137–1278, p = 0.012 versus baseline). However, median FC increased again by week 16, approaching baseline (645 µg/g, IQR 213–1466, p = 0.793 versus baseline) ().
Figure 3. Serial fecal calprotectin during UST induction.
Endoscopic response at week 16 was observed in 21/59 (36%) patients. Endoscopic remission at week 16 was observed in only 7/59 (12%) patients. Patients on concomitant immunomodulators at baseline showed significant higher endoscopic response rates at week 16 as compared with patients without concomitant immunosuppressive therapy at baseline (45% vs 19%; p = 0.048). No significant differences were observed between patients with or without concomitant immunomodulators for clinical response and for clinical, biochemical, endoscopic and histologic remission. No significant differences were observed between patients with UST as second- or third-line therapy with regard to endoscopic response (34% vs 37%, p = 0.861) or patients with a history of surgery (38% vs 32, p = 0.641).
With regard to histology, biopsies were available in 41/59 (69%) patients. In patients with histologic assessment, median GHAS-index at week 16 was 7 [IQR 4–8]. Histologic remission was observed in only 12/41 (29%) patients.
Correlation between early FC levels and response to UST
In endoscopic responders, median FC decreased significantly from 841 µg/g (IQR 364–1220) at baseline to 277 µg/g (IQR 142–1220) at week 2 (p = 0.049), increased to 425 µg/g (143–1224) at week 4 (p = 0.102), and decreased again significantly down to 170 µg/g (IQR 66–717) at week 8 (p = 0.001 as compared to baseline). At week 16, FC increased again to 349 µg (IQR 97–1268, p = 0.279 as compared to baseline) (). In contrast, in endoscopic non-responders, FC levels did not show a significant decrease in subsequent serial FC levels at all predefined time points as compared to baseline ().
Figure 4. Serial fecal calprotectin during UST induction, specified for patients with and without endoscopic response.
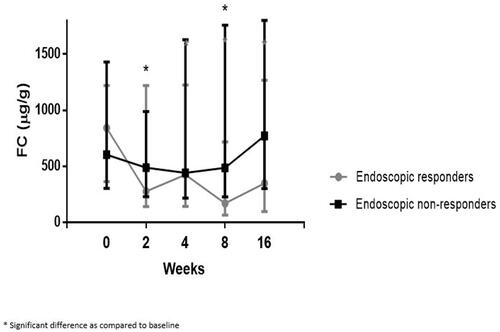
A statistical difference in median FC was observed between endoscopic responders and non-responders at week 8 only (170 µg/g [IQR 66–717] vs 487 µg/g [IQR 227–1759], p = 0.010). The FC in endoscopic responders decreased with Δ671 µg/g (80%) as compared with Δ117 µg/g (19%) in non-responders from baseline to week 8 (p = 0.001).
No statistical difference was observed between endoscopic responders and non-responders at baseline ([841.7 µg/g (IQR 364–1220] vs 604 µg/g [IQR 304–1430], p = 0.818), week 2 ([277 µg/g (IQR 142–1220] vs 488 µg/g [IQR 228–988], p = 0.555), week 4 ([425 µg/g (IQR 143–1224] vs 441 µg/g [IQR 217–1628], p = 0.472) and week 16 (349 µg/g (IQR 96–1269] vs 771 µg/g [IQR 303–1800], p = 0.193).
Due to the low proportion of patients in endoscopic remission, no statistically relevant analyses could be performed to identify a correlation with FC levels. Similarly, no correlation with FC levels could be determined due to the low proportion of patients with histological remission.
Optimal FC levels to predict endoscopic response and endoscopic and histologic remission
After UST induction, FC levels at week 8 has a diagnostic accuracy to predict endoscopic response at week 16 with a corresponding AUC of 0.71 (95% CI 0.57–0.85, p = 0.01). However, no optimal cut-off value could be defined to identify endoscopic responders at week 16. FC ≤250 µg/g at week 8, showed a sensitivity of 55% (95% CI 31.5%–76.9%), specificity of 75% (95% CI 57.8%–87.9%), positive predictive value (PPV) of 55% (95% CI 38.0%–70.9%), and negative predictive value (NPV) of 75% (95% CI 64.1%–83.5%). Similarly, no diagnostic accuracy was demonstrated for FC levels to predict endoscopic remission.
An absolute decrease in FC levels, from baseline to week 8, showed an AUC of 0.72 (95% CI 0.58–0.86, p = 0.006). Within the patient subgroup of 47/59 (80%) patients with minimal FC level of 250 ug/g, an absolute decrease of ≥250 µg/g at week 8 resulted in a sensitivity of 65% (95% CI 40.8–84.6), specificity of 78% (95% CI 60.9–89.9), PPV of 62% (95% CI 44.9–76.4), and a NPV of 80% (95% CI 68.2–88.2). Within the patient subgroup of 38/59 (64%) patients with minimal FC level of 500 ug/g, a FC cut-off of ≥500 µg/g decrease at week 8 was associated with a sensitivity of 73% (95% CI 57.2–85.0), specificity of 67% (95% CI 34.9–90.1), PPV of 89% (95% CI 77.9–94.8), and NPV of 40% (95% CI 26.3–55.5).
Absence of a decrease in in FC levels (defined as a sustained or increased FC level) from baseline to week 8 predicted endoscopic response at week 16 with a sensitivity of 80% (95% CI 56.3–94.3), specificity of 47% (95% CI 30.4–64.5), PPV of 46% (95% CI 36.6–55.2), and a NPV of 81% (95% CI 62.4–91.6).
Due to the low proportion of patients in both endoscopic and histologic remission at week 16, no statistically relevant analyses could be performed to identify an FC cut-off for endoscopic or histologic remission.
Discussion
In this prospective cohort, with a high percentage of CD patients exposed to both anti-TNF and vedolizumab, an absolute decrease of ≥500 µg/g between baseline and week 8 was significantly associated with endoscopic response at week 16, whereas the absence of a decrease of FC level at week 8 was associated with the absence of endoscopic response. Therefore, FC measurement at week 8 may guide therapeutic decisions on UST continuation in CD. In patients with a FC decrease of ≥500 µg/g from baseline to week 8, endoscopic response is likely. In these patients, continuation of UST therapy without endoscopic response evaluation may be considered. In patients without a decrease in FC levels, endoscopic response is unlikely. In these patients, the decision on continuation of UST therapy needs to be reconsidered based on an individual patient’s level including waiting for a delayed response and postpone endoscopy, dose optimization or stop UST therapy and switch to another class of drugs. Endoscopic response evaluation remains essential in patients with a FC decrease less than 500 µg/g for further therapeutic decisions.
Although FC has proven a high sensitivity and specificity for endoscopic disease activity, published literature reports a widely spread of cut-off values of FC predicting endoscopic remission [57–274 µg/g] [Citation10,Citation16–19]. Similarly, we could not identify an optimal FC cut-off value for endoscopic response to UST in this study. An explanation for the absence of a clear cut-off value for FC to predict endoscopic response as observed in this study could be the inclusion of therapy refractory patients, who were exposed to UST as a third line biological reflecting a more difficult to treat cohort following multiple biologic failures. Failure to multiple classes of biologics results in lower effectiveness of UST [Citation2,Citation20]. Possibly, these patients suffer from a very heterogeneous disease reflecting a more severe transmural inflammation of CD. It may be hypothesized that the FC levels in our cohort decrease insufficiently due to this highly selected group of refractory patients. A larger cohort with a less therapy refractory population may be of interest to develop a decision making algorithm for the evaluation of the effect of UST induction therapy.
Our cohort showed low endoscopic response and endoscopic remission rates (i.e., 36% and 10%) at week 16, which is in line with a previous study which reported endoscopic response and remission rates of 21% and 7% at weeks 24 (95% and 67% exposed to anti-TNF and vedolizumab) [Citation4]. In addition to the therapy refractory population in this study that might explain the relatively low endoscopic response rate at week 16, a delayed response to UST induction may be of influence as well [Citation21]. This delay may in part be related to the mechanisms by which UST downregulates CD-related inflammation. IL-12/IL-23 blockade, induced by UST, is followed by modulation of T-cell differentiation leading to a subsequently decreased Th1 and Th17 pro-inflammatory cytokine production. It is conceivable that the anti-inflammatory effects initiation through such immune modulation takes longer to manifest compared for instance to the treatment with anti-TNF therapy which directly targets inflammatory effectors resulting in a rapid improvement [Citation22]. This hypothesis is supported by the fact that the proportion of patients achieving clinical response increases over time. In the ICC registry, 38% of patients receiving UST achieved steroid-free clinical remission at week 24 compared to only 24% at week 12 (1). In addition, another study reported on 33 patients who did not achieve clinical response at week 12, however did achieve clinical response at 24 weeks [Citation6]. In addition, the predictive value of early FC levels on later endoscopic time points may depend on the timing of endoscopic evaluation. The predictive value of FC was evaluated in the post-hoc analysis from the IM-UNITI trial, and showed that a week 6 FC value of <250 ug/g is an adequate predictor of endoscopic remission (defined as a SES-CD score <3) at week 52 [AUC 0.709] [Citation23]. FC performed better as predictor as compared to clinical remission (CDAI <150) or clinical response (CDAI reduction of ≥100 points), CRP <5 mg/L and UST drug levels at week 6.
In this study, an increase in both HBI score and FC level was observed between week 8 and week 16. A prospective open-label cohort study reported similar outcomes regarding early serial FC measurements with a significant decrease in FC levels after intravenous induction and as well an increase of FC levels beyond week 8 and even further up to week 24 (4). Low serum levels of UST, possibly due to a too low intravenous induction or subcutaneous dosage during maintenance therapy or the relative long interval between induction and maintenance therapy could be an explanation for the increased FC levels beyond week 8 and the low endoscopic response rates at week 16 [Citation24,Citation25]. Patients rapidly lose their initial response possibly due to the underlying pharmacokinetics mechanisms, referring to the ‘’intestinal sink’’ phenomenon which previously has been demonstrated for anti-TNF therapy [Citation26], and which may be involved in a declined response to UST. It might therefore be suggested that CD patients may need higher levels of UST to achieve the required exposure of UST to neutralize tissue inflammation and to induce endoscopic response. More studies on pharmacokinetics mechanisms of UST are needed to elucidate this issue.
In this current study, the clinical remission rate [30%] was in line with available data from large Dutch and Belgium real word cohorts reporting clinical remission rates of 23% [week 12] and 31% [week 16] [Citation1,Citation4]. In contrast, a large Italian cohort reported a higher clinical remission rate [64%], possibly due to higher rate of patients on concomitant corticosteroids and higher threshold of HBI score for definition of clinical remission [Citation27]. In this latter cohort an association was observed between FC > 200 µg/g at 2 months and the absence of clinical remission at 3 months. In this study, this observation was not confirmed, since no correlation between FC level at the evaluated time points and clinical remission at week 16 was observed [correlation coefficient −0.011, p = 0.42].
Major strengths of this study are its prospective design with clinical, biochemical, and endoscopic assessments. Furthermore, the serial early FC measurements do depict the course of the disease clearly. However, a few limitations need to be considered. Firstly, several factors can affect FC levels, including infections, bowel movements, storage temperature and blood admixture, and could therefore potentially influence the outcomes. In addition, FC levels could also be elevated due to other gastrointestinal diseases, reactive oxygen species and in drug-induced enteropathy. Due to its real-world design in a tertiary referral center, these results do not reflect daily clinical practice, as our cohort reflects a refractory group of patients with severe disease who failed several biologics prior UST initiation and for whom further treatment strategies are still undiscovered. Lastly, given the fact that previous studies demonstrated additional responders to UST at week 24 (instead of week 16), it would be of interest to consider the association between FC levels and endoscopic evaluation at later time points.
In conclusion, the prediction of endoscopic response to UST induction in CD patients based on early FC measurements remains challenging. FC levels at week 8 may guide therapeutic decisions on UST continuation in CD. Continuation of UST therapy, without endoscopic response evaluation, may be considered in patients with a decrease in FC levels of ≥500 µg/g. The decision on continuation of UST therapy needs reconsideration at this time point in patients without a decrease of FC level. In all other patients, endoscopic response evaluation remains essential for therapeutic decisions.
Author contributions
Janneke van der Woude, Annemarie de Vries and Renske Pauwels contributed to the study conception and design. Material preparation, data collection and analysis were performed by Renske Pauwels and Sebastiaan ten Bokkel Huinink. The first draft of the manuscript was written by Sebastiaan ten Bokkel Huinink and Renske Pauwels and all authors commented on previous versions of the manuscript. All authors read and approved the final manuscript.
| Abbreviations | ||
| IBD | = | inflammatory bowel disease |
| CD | = | Crohn’s disease |
| MH | = | mucosal healing |
| FC | = | fecal calprotectin |
| SES-CD | = | simple endoscopic score |
| ROC | = | receiving operating curve |
| AUC | = | area under the curve |
| PPV | = | positive predictive value |
| NPV | = | negative predictive value |
Supplemental Material
Download MS Word (15 KB)Disclosure statement
Christien J. van der Woude received grant support from Falk Benelux and Pfizer; received speaker fees from AbbVie, Takeda, Ferring, Dr. Falk Pharma, Hospira, Pfizer; and served as a consultant for AbbVie, MSD, Takeda, Celgene, Mundipharma and Janssen. Annemarie C. de Vries has participated in advisory board and/or received financial compensation from the following companies: Janssen, Takeda, Abbvie and Tramedico. The remaining authors have no conflict of interest.
Correction Statement
This article has been corrected with minor changes. These changes do not impact the academic content of the article.
Additional information
Funding
References
- Biemans VBC, van der Meulen-de Jong AE, van der Woude CJ, et al. Ustekinumab for crohn’s disease: results of the ICC registry, a nationwide prospective observational cohort study. J Crohns Colitis. 2020;14(1):33–45.
- Feagan BG, Sandborn WJ, Gasink C, et al. Ustekinumab as induction and maintenance therapy for crohn’s disease. N Engl J Med. 2016;375(20):1946–1960.
- Liefferinckx C, Verstockt B, Gils A, Belgian Inflammatory Bowel Disease Research and Development Group [BIRD group], et al. Long-term clinical effectiveness of ustekinumab in patients with crohn’s disease who failed biologic therapies: a national cohort study. J Crohn’s Colitis. 2019;13(11):1401–1409.
- Verstockt B, Dreesen E, Noman M, et al. Ustekinumab exposure-outcome analysis in crohn’s disease only in part explains limited endoscopic remission rates. J Crohns Colitis. 2019;13(7):864–872.
- Rubín de Célix C, Chaparro M, Gisbert JP. Real-World evidence of the effectiveness and safety of ustekinumab for the treatment of crohn’s disease: systematic review and Meta-Analysis of observational studies. J Clin Med. 2022;11(14):4202.
- Ma C, Fedorak RN, Kaplan GG, et al. Clinical, endoscopic and radiographic outcomes with ustekinumab in medically-refractory crohn’s disease: real world experience from a multicentre cohort. Aliment Pharmacol Ther. 2017;45(9):1232–1243.
- Torres J, Bonovas S, Doherty G, et al. ECCO guidelines on therapeutics in crohn’s disease: medical treatment. J Crohns Colitis. 2020;14(1):4–22.
- Peyrin-Biroulet L, Sandborn W, Sands BE, et al. Selecting therapeutic targets in inflammatory bowel disease (STRIDE): determining therapeutic goals for treat-to-Target. Am J Gastroenterol. 2015;110(9):1324–1338.
- Sands BE. Biomarkers of inflammation in inflammatory bowel disease. Gastroenterology. 2015;149(5):1275–1285 e2.
- D’Haens G, Ferrante M, Vermeire S, et al. Fecal calprotectin is a surrogate marker for endoscopic lesions in inflammatory bowel disease. Inflamm Bowel Dis. 2012;18(12):2218–2224.
- Mosli MH, Zou G, Garg SK, et al. C-Reactive protein, fecal calprotectin, and stool lactoferrin for detection of endoscopic activity in symptomatic inflammatory bowel disease patients: a systematic review and Meta-Analysis. Am J Gastroenterol. 2015;110(6):802–819. quiz 20.
- Jukic A, Bakiri L, Wagner EF, et al. Calprotectin: from biomarker to biological function. Gut. 2021;70(10):1978–1988.
- Silverberg MS, Satsangi J, Ahmad T, et al. Toward an integrated clinical, molecular and serological classification of inflammatory bowel disease: report of a working party of the 2005 montreal world congress of gastroenterology. Can J Gastroenterol. 2005;19(Suppl A):5A–36A.
- Harvey RF, Bradshaw JM. A simple index of crohn’s-disease activity. Lancet. 1980;1(8167):514.
- D'Haens GR, Geboes K, Peeters M, et al. Early lesions of recurrent crohn’s disease caused by infusion of intestinal contents in excluded ileum. Gastroenterology. 1998;114(2):262–267.
- Schoepfer AM, Beglinger C, Straumann A, et al. Fecal calprotectin correlates more closely with the simple endoscopic score for crohn’s disease (SES-CD) than CRP, blood leukocytes, and the CDAI. Am J Gastroenterol. 2010;105(1):162–169.
- Schoepfer AM, Beglinger C, Straumann A, et al. Fecal calprotectin more accurately reflects endoscopic activity of ulcerative colitis than the lichtiger index, C-reactive protein, platelets, hemoglobin, and blood leukocytes. Inflamm Bowel Dis. 2013;19(2):332–341.
- Sipponen T, Savilahti E, Kolho KL, et al. Crohn’s disease activity assessed by fecal calprotectin and lactoferrin: correlation with crohn’s disease activity index and endoscopic findings. Inflamm Bowel Dis. 2008;14(1):40–46.
- Turner D, Ricciuto A, Lewis A, et al. STRIDE-II: an update on the selecting therapeutic targets in inflammatory bowel disease (STRIDE) initiative of the international organization for the study of IBD (IOIBD): determining therapeutic goals for treat-to-Target strategies in IBD. Gastroenterology. 2021;160(5):1570–1583.
- Sandborn WJ, Feagan BG, Rutgeerts P, et al. Vedolizumab as induction and maintenance therapy for crohn’s disease. N Engl J Med. 2013;369(8):711–721.
- Sands BE, Oortwijn A, Rijnders N, et al. P317 characterisation of patients with delayed response to ustekinumab for crohn’s disease. J Crohn Colitis. 2019;13(Supplement_1):S259–S260.
- Simon EG, Ghosh S, Iacucci M, et al. Ustekinumab for the treatment of crohn’s disease: can it find its niche? Therap Adv Gastroenterol. 2016;9(1):26–36.
- Narula N, Wong ECL, Dulai PS, et al. Week 6 calprotectin best predicts likelihood of long-term endoscopic healing in crohn’s disease: a post-hoc analysis of the UNITI/IM-UNITI trials. J Crohns Colitis. 2021;15(3):462–470.
- Fumery M, Peyrin-Biroulet L, Nancey S, et al. Effectiveness and safety of ustekinumab intensification at 90 mg every 4 weeks in crohn’s disease: a multicentre study. J Crohn Colitis. 2021;15(2):222–227.
- Storan D, Doherty GA, Cullen G. Ustekinumab 90 mg every 2 weeks for the treatment of inflammatory bowel disease. Clin Gastroenterol Hepatol. 2021;19(7):1502.
- Yarur AJ, Jain A, Sussman DA, et al. The association of tissue anti-TNF drug levels with serological and endoscopic disease activity in inflammatory bowel disease: the ATLAS study. Gut. 2016;65(2):249–255.
- Tursi A, Mocci G, Cuomo A, et al. Real-life efficacy and safety of ustekinumab as second- or third-line therapy in crohn’s disease: results from a large italian cohort study. Eur Rev Med Pharmacol Sci. 2021;25(4):2099–2108.