
Abstract
Background
Metabolic dysfunction-associated steatotic liver disease (MASLD) is the most prevalent chronic liver condition worldwide. There is an urgent need to develop new biomarkers to assess disease severity and to define patients with a progressive phenotype. Activin A is a new promising biomarker with conflicting results about liver fibrosis. In this study we investigate levels of Activin A in patients with biopsy proven MASLD. We assess levels of Activin A in regard to fibrosis stage and genetic variant I148M in the patatin-like phospholipase domain-containing protein 3 (PNPLA3).
Methods
Activin A levels were assessed in plasma samples from patients with biopsy-proven MASLD in a cross-sectional study. All patients were clinically evaluated and the PNPLA3 I148M genotype of the cohort was assessed.
Findings
41 patients were included and 27% of these had advanced fibrosis. In MASLD patients with advanced fibrosis, Activin A levels was higher (p < 0.001) and could classify advanced fibrosis with an AUROC for activin A of 0.836 (p < 0.001). Patients homozygous for PNPLA3 I148M G/G had higher levels of activin A than non-homozygotes (p = 0.027).
Conclusions
Circulating activin A levels were associated with advanced fibrosis and could be a potential blood biomarker for identifying advanced fibrosis in MASLD. Patients with the risk genotype PNPLA3 I148M G/G had higher levels of activin A proposing activin A as a contributor of the transition from simple steatosis to a fibrotic phenotype.
Keywords:
Introduction
Metabolic dysfunction-associated steatotic liver disease (MASLD) is the most prevalent chronic liver disease, affecting approximately 38% of all adults in the world [Citation1]. MASLD is the overall term for a range of different histopathological findings, from simple steatosis to necroinflammatory changes (i.e. metabolic dysfunction-associated steatohepatitis [MASH]), with varying stages of fibrosis. Patients with MASLD have a potential risk of progressing to liver cirrhosis and hepatocellular carcinoma. Fibrosis stage is the strongest prognostic predictor of developing end-stage liver disease and liver-related mortality [Citation2].
Presently, there is a lack of accurate and cost-effective non-invasive blood-based biomarkers for diagnosis and prognosis of liver fibrosis.
The multifunctional cytokine, Activin A, has among its various biological roles a pro-fibrotic function. Within the liver it has been shown to stimulate the production of fibronectin [Citation3], alpha smooth muscle actin and collagen [Citation4]. If deregulated, activin A could cause excess formation of extracellular matrix leading to fibrosis and cirrhosis, and indeed, increased activin A expression has been shown in such murine models [Citation5]. In humans increased circulating levels of activin A has been reported in patients with MASLD compared to controls, however, there are conflicting results regarding the correlation between serum/plasma activin A levels and the extent of hepatic fibrosis [Citation6–8].
The mechanisms involved in progression to steatosis and more advanced forms of MASLD are not identified but one known genetic risk factor is the patatin-like phospholipase domain-containing 3 (PNPLA3) gene rs738409 (I148M) variant. Carriers have increased levels of PNPLA3 protein on the surface of lipid droplets and higher degree of steatosis. PNPLA3 I148M is also associated with lobular inflammation and fibrosis [Citation2].
The aim of this study is to assess activin A levels in plasma from biopsy-proven MASLD patients with advanced fibrosis compared to nonadvanced fibrosis. Furthermore, we aim to investigate if activin A levels are higher in patients with homozygous PNPLA3 I148M compared to heterozygous and wild type.
Material and methods
Patients
The study population is part of a cohort, previously described [Citation9] and all patients with available plasma samples from the first follow-up were included in this study. In short, the cohort is a follow-up study of patients who secondary to chronically elevated liver enzyme levels (defined as elevated serum alanine aminotransferase [ALT >41 U/L], and/or aspartate aminotransferase [AST >41 U/L], and/or serum alkaline phosphatase [ALP >106 U/L]) underwent liver biopsy as part of the clinical routine between 1988 and 1993. In total 129 patients were diagnosed as having MASLD after excluding other concomitant liver disease or steatogenic causes (e.g. medications, alcohol overconsumption > 140 g/w). Liver histology was scored according to the system developed by Kleiner et al. [Citation10] and MASH was defined according to fatty liver inhibition of progression [Citation11, Citation12]. Advanced fibrosis was defined as fibrosis stages 3 and 4. At the time of follow-up, between 2003 and 2005, 104 patients were alive and 88 agreed to participate in the study, of whom 68 patients agreed to a second liver biopsy. Out of the 68 patients with a present liver biopsy, 41 plasma samples were available for analysis. The PNPLA3 I148M genotype of the cohort has been assessed previously [Citation13]. Clinical, biochemical, histological data and biobanking samples, are from the follow-up period between 2003 and 2005.
Ethical approval
The studies were approved by The Regional Ethical Review Board in Linköping, Sweden (Reference No. 2002-454) Written informed consent was obtained from each subject and the study was conducted in accordance with ethical guidelines of the Declaration of Helsinki.
Enzyme immunoassays
Plasma levels of Activin A were measured with a sandwich enzyme-linked immunosorbent assay (R&D Systems, Minneapolis, MN, USA, #DAC00B, control set #QC33) according to the manufacturer’s instructions.
Statistical analyses
Statistical analyses were performed with IBM SPSS Statistics version 29.0 (IBM Corp, Armonk, NY, USA) and GraphPad Prism version 9.1.2 (GraphPad Software, Boston, MA, USA). Between group comparisons were performed with Mann-Whitney U-test or Kruskal–Wallis H-test, due to nonparametric data, and presented as individual values and as medians. Binary logistic regression models were performed. Activin A, PNPLA3, age, gender, body mass index (BMI) and diagnosis of type 2 diabetes mellitus (T2DM) were first all tested separately in univariable analyses for development of advanced fibrosis (model 1). A final multivariate model (model 2) was performed with the selected important clinical parameters, irrespective of their significance levels.
The diagnostic performance of activin A was assessed by receiver operating characteristic (ROC) curve analysis where the area under the ROC (AUROC) was used as an index of the accuracy of the test. A p-value of < 0.05 was considered significant.
Results
Baseline characteristics
In total, plasma samples for analyses were present in 41 MASLD patients. The mean age and BMI were 69 years and 28.1 kg/m2, respectively, with a male predominance (77%) of whom two-thirds had T2DM. Advanced fibrosis was present in 11 patients (27%). Histologically the distribution of fibrosis stage (F) was as follows: F0, n = 10; F1, n = 13, F2, n = 7; F3, n = 6; and F4, n = 5. MASH was only present in one patient. The distribution of PNPLA3 alleles were w.t, n = 15; C/G, n = 18; and G/G, n = 5.
Circulating plasma levels of activin A are elevated in patients with advanced fibrosis, in patients with PNPLA3 I148M G/G allele and can predict advanced fibrosis
Fasting plasma levels of activin A were higher in patients with advanced fibrosis compared to those without advanced fibrosis (). Activin A levels did not differ between stages in any of the other histopathological lesions of MASLD as compared in grade of steatosis (), ballooning () or lobular inflammation (). We then compared the levels of activin A in patients with the PNPLA3 I148M G/G allele to those with a wild type or heterozygote C/G allele. As shown in , MASLD patients with the G/G allele had increased plasma levels of activin A.
Figure 1. Circulating plasma levels of activin A in patients according to the (a) fibrosis stage (F0-2, n = 30; F3-4, n = 11), (b) steatosis grade (0, n = 1; 1, n = 12; 2, n = 10; 3, n = 16), (c) ballooning grade (0, n = 33; 1, n = 6) and (d) lobular inflammation grade (0, n = 36; 1, n = 3). (e) Circulating plasma levels of activin A in patients with PNPLA3 wild type (w.t) or heterozygote C/G allele (n = 33) compared to patients with the homozygote G/G allele (n = 5). * for p < 0.05, *** for p < 0.001. Data are presented as individual values and medians. (f) Receiver Operating Characteristic (ROC) curve demonstrating the performance of FIB-4 and Activin A in detecting the presence of advanced fibrosis. Activin A AUROC = 0.836 and FIB-4 AUROC = 0.839.
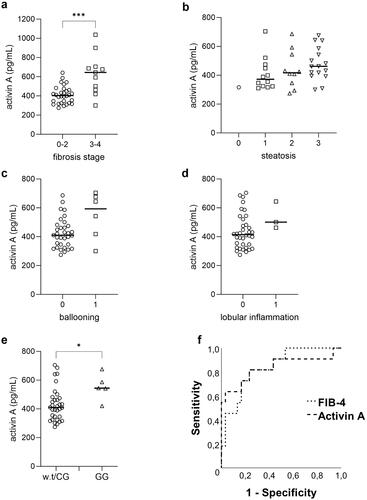
To evaluate if Activin A could predict the presence of advanced fibrosis we performed binary logistic regression analyses. Only activin A, alone or when adjusted for clinical variables or the PNPLA3 G/G allele, were statistically associated with increased odds of advanced fibrosis (). To evaluate how well activin A could classify advanced fibrosis we plotted a ROC curve and compared the area under the ROC curve (AUROC) for activin A with one of the most widely clinically used serum algorithms, FIB-4. In this cohort the diagnostic performance of activin A was comparable with FIB-4, with an AUROC for activin A of 0.836 (p < 0.001) and 0.839 (p < 0.001) for FIB4 ().
Table 1. Univariate and multivariate logistic regression analysis. Evaluation of predictors of advanced fibrosis in MASLD.
Discussion
As an increasing proportion of the world population is diagnosed with MASLD, it is becoming critically important to find better diagnostic and prognostic biomarkers. Non-invasive techniques to assess fibrosis stage exist (e.g. magnetic resonance- and transient elastography) but are either expensive, not readily available or results could be negatively affected by obesity. A low-cost method for advanced fibrosis risk assessment is by serum algorithms. They effectively rule out advanced fibrosis but have a high false positive rate, necessitating confirmation with another method. More knowledge is also needed to understand the triggers underlying the heterogeneity of the disease, in that only some patients with MASLD progress to advanced fibrosis, and ultimately cirrhosis. Activin A has been shown to stimulate production of extracellular matrix proteins and could induce hepatic fibrogenesis. In this study we find that the plasma activin A levels are elevated in MASLD patients with advanced fibrosis compared to patients without advanced fibrosis. We also show that activin A can predict the presence of advanced fibrosis in MASLD and the association is preserved even when adjusted for sex, gender, BMI, PNPLA3 and T2DM. This aligns with Yndestad et al. who also reported elevated activin A levels in patients with advanced fibrosis, and that activin A levels associated with the degree of fibrosis within a MASH group [Citation6]. However, another study, observing higher levels of activin A in patients with MASH compared to controls, did not find an association with fibrosis stage, ballooning, lobular, nor portal inflammation [Citation8]. This discrepancy could be due to their exclusion of patients with fibrosis stage 4 (i.e. cirrhosis).
The deregulation of activin A has also been implicated in hepatocellular carcinoma [Citation14]. Activin A has recently been recognized as one of the cytokines released by activated hepatic stellate cells, which, when administered to human hepatocellular cancer cell line, promote metastatic capacity [Citation15]. Whereas knockdown of activin A repressed the migratory and invasive ability of the cells [Citation15]. Highlighting activin A as a potential therapeutic target to restrain development of advanced fibrosis and HCC progression.
Since patients with advanced fibrosis face a higher risk of liver-related mortality, identifying a marker capable of distinguishing them from low-risk groups without advanced fibrosis is crucial. The potential of activin A to serve as effectively as FIB-4 in diagnosing patients within our cohort makes it a promising candidate biomarker. However, our study’s limited participant size should be noted. Another study found elevated activin A in MASH cirrhosis patients, but no correlation with fibrosis degree was observed in MASLD/MASH patients without cirrhosis [Citation7]. Therefore, larger-scale studies are essential to validate whether activin A levels can differentiate between fibrosis stages 3 and 4 and the absence of advanced fibrosis, or if activin A primarily indicates the presence of cirrhosis.
MASLD patients with PNPLA3 I148M G/G genotype have more steatosis and an increased rate of cirrhosis [Citation2]. Therefore, we hypothesized that there could be a link between PNPLA3 I148M and the levels of the pro-fibrotic activin A. Intriguingly, even though only five individuals in our cohort were of the PNPLA3 I148M G/G genotype there was a significant difference in activin A levels, where the MASLD patients with PNPLA3 I148M G/G had 33% higher levels than non-homozygotes. Suggesting activin A as a contributor of the transition from simple steatosis to a fibrotic phenotype.
This study has some limitations. First, as with all studies using liver biopsy as the gold standard, sampling error as well as inter- and intra-observer variability is a fact. Second, as mentioned above, the sample size of the study is small. Finally, as most patients lacked histopathological signs of MASH, we cannot rule out an association between inflammation and levels of activin A.
In conclusion, we show that activin A levels are elevated in MASLD patients with advanced fibrosis and is a potential biomarker for identifying these patients with higher risk of severe liver disease. Furthermore, we show a connection between high activin A levels and the known genetic risk factor for MASLD, the PNPLA3 I148M. Further studies are needed with larger cohorts to confirm relationships and mechanistic studies to understand the molecular mechanism and causalities.
CRediT authorship contribution statement
Conceptualization: CJ, ME. Data curation: CJ, PN, SK, ME. Formal analysis; CJ, MB, PN. Funding acquisition; PN, ME. Investigation: CJ, ME. Methodology; CJ, PN, ME. Project administration: all authors. Drafting of manuscript: CJ. Critical revision: all authors. All authors read and approved the final manuscript.
| Abbreviations | ||
| MASLD | = | Metabolic dysfunction-associated steatotic liver disease |
| MASH | = | metabolic dysfunction-associated steatohepatitis |
| PNPLA3 | = | the patatin-like phospholipase domain-containing protein 3 |
| BMI | = | body mass index |
| T2DM | = | type 2 diabetes mellitus |
| ROC | = | receiver operating characteristic |
| AUROC | = | area under the ROC |
Disclosure statement
No potential conflict of interest was reported by the authors.
Additional information
Funding
References
- Riazi K, Azhari H, Charette JH, et al. The prevalence and incidence of NAFLD worldwide: a systematic review and meta-analysis. Lancet Gastroenterol Hepatol. 2022;7(9):851–861. doi: 10.1016/S2468-1253(22)00165-0.
- Kechagias S, Nasr P, Blomdahl J, et al. Established and emerging factors affecting the progression of nonalcoholic fatty liver disease. Metabolism. 2020;111S:154183. doi: 10.1016/j.metabol.2020.154183.
- Date M, Matsuzaki K, Matsushita M, et al. Differential regulation of activin A for hepatocyte growth and fibronectin synthesis in rat liver injury. J Hepatol. 2000;32(2):251–260. doi: 10.1016/s0168-8278(00)80070-7.
- Wada W, Kuwano H, Hasegawa Y, et al. The dependence of transforming growth factor-beta-induced collagen production on autocrine factor activin A in hepatic stellate cells. Endocrinology. 2004;145(6):2753–2759. doi: 10.1210/en.2003-1663.
- Sugiyama M, Ichida T, Sato T, et al. Expression of activin A is increased in cirrhotic and fibrotic rat livers. Gastroenterology. 1998;114(3):550–558. doi: 10.1016/s0016-5085(98)70539-6.
- Yndestad A, Haukeland JW, Dahl TB, et al. A complex role of activin A in non-alcoholic fatty liver disease. Am J Gastroenterol. 2009;104(9):2196–2205. doi: 10.1038/ajg.2009.318.
- Kiagiadaki F, Kampa M, Voumvouraki A, et al. Activin-A causes hepatic stellate cell activation via the induction of TNFalpha and TGFbeta in kupffer cells. Biochim Biophys Acta Mol Basis Dis. 2018;1864(3):891–899. doi: 10.1016/j.bbadis.2017.12.031.
- Polyzos SA, Kountouras J, Anastasilakis AD, et al. Activin A and follistatin in patients with nonalcoholic fatty liver disease. Metabolism. 2016;65(10):1550–1558. doi: 10.1016/j.metabol.2016.07.009.
- Nasr P, Ignatova S, Kechagias S, et al. Natural history of nonalcoholic fatty liver disease: a prospective follow-up study with serial biopsies. Hepatol Commun. 2018;2(2):199–210. doi: 10.1002/hep4.1134.
- Kleiner DE, Brunt EM, Van Natta M, et al. Design and validation of a histological scoring system for nonalcoholic fatty liver disease. Hepatology. 2005;41(6):1313–1321. doi: 10.1002/hep.20701.
- Bedossa P, Poitou C, Veyrie N, et al. Histopathological algorithm and scoring system for evaluation of liver lesions in morbidly obese patients. Hepatology. 2012;56(5):1751–1759. doi: 10.1002/hep.25889.
- Bedossa P, Consortium FP. Utility and appropriateness of the fatty liver inhibition of progression (FLIP) algorithm and steatosis, activity, and fibrosis (SAF) score in the evaluation of biopsies of nonalcoholic fatty liver disease. Hepatology. 2014;60(2):565–575. doi: 10.1002/hep.27173.
- Negoita F, Blomdahl J, Wasserstrom S, et al. PNPLA3 variant M148 causes resistance to starvation-mediated lipid droplet autophagy in human hepatocytes. J Cell Biochem. 2019;120(1):343–356. doi: 10.1002/jcb.27378.
- Grusch M, Drucker C, Peter-Vörösmarty B, et al. Deregulation of the activin/follistatin system in hepatocarcinogenesis. J Hepatol. 2006;45(5):673–680. doi: 10.1016/j.jhep.2006.06.014.
- Wang P-W, Lin T-Y, Yang P-M, et al. Hepatic stellate cell modulates the immune microenvironment in the progression of hepatocellular carcinoma. Int J Mol Sci. 2022;23(18):10777. doi: 10.3390/ijms231810777.