
Abstract
This article describes the use of a digital tool to conduct investigations that allow young children to collect data to answer questions that are interesting and developmentally appropriate for preschoolers. The curricular program is designed as a set of hands-on experiences for preschoolers to engage in problem-solving with data. The digital tool supports the teacher to mediate each step in the investigation process, as preschoolers collaborate to pose a question of interest, identify categories or variables that can help answer the question, proceed through the data collection process, and quickly generate a visualization (graph or tally chart) that drives a deeper discussion or “data talk” to make sense of the data. By maximizing the affordances of technology, data can be efficiently collected while children engage in science practices (e.g. asking questions) and mathematics learning (e.g. gather relevant data, sort and classify by attributes, analysis and interpretation of data). The use of this digital resource amplifies the scaffolding of each investigation, assists in the details of planning and conducting investigations, and provides colorful, engaging visuals to spur discussions about the data in relevant, age-appropriate ways. Throughout the process, children can build on and expand their mathematics and scientific knowledge and skills.
There are many ways to engage preschoolers in science and engineering practices by posing meaningful questions, collecting and sorting data, using a digital tool to support the creation of visual representations, and using data displays to answer developmentally appropriate research questions. These experiences can extend what is currently taught in the classroom and build on children’s interests. What might this look like in a preschool classroom?
Example 1: “Lets do a sink and float experiment!” As children test objects, the teacher enters that result in the digital tool. Children view the data in a tally chart, counting how many are in each category (sink or float) and talking about which category has the most objects, and why that might be.
Example 2: After reading a book about animals, the teacher focuses children’s attention on a physical attribute and has the children sort the animals and make a graph to show whether the animals in the book have those features. “How many of these animals have a tail?” she asks after they’ve entered that data in the app on the tablet.
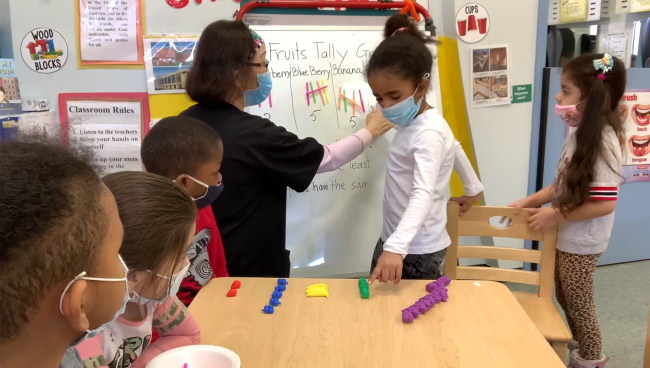
Example 3: In a small group, preschoolers sort a set of disposable objects into the correct bin for paper recycling, plastic recycling, trash, or composting. One child takes on the role of entering the data into the app. The teacher then helps the children count how many objects are in each category, determine which bin had the most or least, and discuss how the number of objects in the trash bin changed when recycling and composting options were added.
The early years provide a unique opportunity to lay the foundation for data science (DS) and technological literacy, and to support building the problem-solving skills children will need in their later education and the future workforce. To prepare our students to succeed in our data-driven world, investigations with data provide an applied context for preschoolers to engage with science practices, such as using mathematics and computational thinking, while also incorporating foundational mathematics skills—namely counting, sorting, classifying, comparing, and ordering. Educators can capitalize on preschoolers natural inclination to ask questions and engage with the world around them through meaningful DS activities (Platas Citation2017). Yet, teachers often feel unprepared to implement DS investigations or meet their data collection and analysis learning goals.
Many in the education space suggest the importance of focusing on DS early (English and Watson Citation2015), with some standards beginning to include it more formally (e.g., New York State Prekindergarten standards). We used a computational thinking (CT) lens to address the “data and analysis” CT strand (K–12 Computer Science Framework Citation2016), which in this context refers to a problem-solving process that includes the analysis and interpretation of data (Lewis Presser et al. Citation2023). We can engage preschoolers in CT by asking questions and investigating the answers, and by using data and technology to address meaningful problems (ISTE and CSTA Citation2011; Lewis Presser et al. Citation2023).
Recent standards for preschool mathematics, such as those in New York State, have expanded to include data, but to help preschoolers meet these standards, teachers need resources designed for young learners. Below, we describe a set of freely available developmentally appropriate DS investigations that utilize hands-on materials and digital tools with an intuitive design. Through these early learning DS experiences, we aim to support children by helping them to meet the Common Core Measurement and Data standards by the end of kindergarten.
Child-Centered Investigations
Preschoolers can engage in age-appropriate investigations using data to answer research questions, an endeavor that can help build their understanding of the scientific process. The Preschool Data Toolbox is a free digital tool () with an embedded Teachers’ Guide that includes a set of six investigations () to encourage teachers to bring DS investigations to life by quickly creating age-appropriate, appealing visual data displays. The Teachers’ Guide has lesson plans that use hands-on materials, picture books, and physical movement to enhance preschoolers’ participation in a series of problem-solving activities using data that takes young children’s developmental learning needs into account. With the goal of incorporating and extending children’s interest, the program also offers a “Create Your Own” investigation—an open-ended instructional experience that supplements the structured investigations—that teachers and children can collaborate on as often as they want and in as many different ways as they want.
Table 1 Digital journal features.
Table 2 Description of activities.
Throughout these data-focused activities, we encourage teachers to have children role-play as a “data scientist,” which our research suggests instills the investigation practices as a routine. As preschoolers often take on the role of various careers, this is a common way to engage preschoolers in the process. It also signals to children that they are about to engage in a problem-solving process that uses data to answer questions.
Support Mathematics and Science Practices through Investigations
While teachers employed these activities with the goal of fostering mathematics learning, the frequent engagement in step-by-step investigations also fosters knowledge of practices that connects mathematics and science (e.g., asking questions, defining problems, planning/carrying out investigations, analyzing/interpreting data, arguing with evidence). Thus, the investigations promote the integration of meaningful mathematics and CT in the service of addressing research questions.
Our approach encourages the use of hands-on materials, engaging children physically in data collection, and talking about the meaning of data visualizations through “data talks.” Using a teacher-facing digital app, there are six structured investigations, each of which has three to five instructional activities that build on each other over the course of the investigation. For example, in the first activity of the Animal Data Shuffle investigation, children sort animals based on how many legs each animal has, then create a graph using the digital tool. This is followed by sorting the same animals based on how they move and creating a digital graph (activity 2), and then having a data talk about the resulting two graphs in activity 3. After teachers and children have gained experience with the investigations and digital tool, they can create their own graphs and design a narrative data story presentation with a series of graphs.
Scaffolding of the Investigation Process
Each investigation scaffolds the process of (1) asking a research question, (2) collecting and organizing data, (3) analyzing that data, and (4) interpreting the data through a data talk. Graphical representations are created with physical objects (e.g., object graphs), pictures (e.g., pictographs), children’s own bodies (e.g., body graphs), and graphs and tally charts using the digital tool and corresponding app. Once the graphical representation is created, teachers can use tools to support children’s interpretation of the data by drawing on the screen; sorting the data ascending, descending, and by hand; and changing the data visualization from a more concrete representation of the data as a picture of stacked boxes, to a more abstract representation of the data as a large bar for each variable (see ). Finally, teachers can click through discussion question prompts to facilitate the implementation of data talks.
Create Your Own Investigation
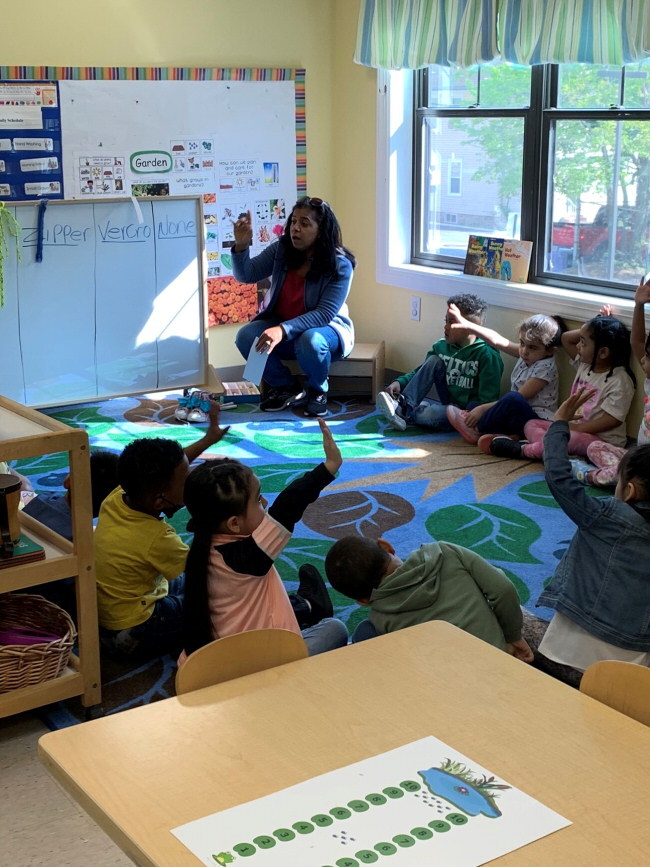
In the Create Your Own investigations, teachers and children are able to ask new questions that build on existing classroom activities (e.g., a unit or book) or investigate questions related to children’s interests. For example, teachers can pose a “question of the day” (e.g “How many toy cars long are you?” or “Which fruit should we have for snack today?”) a common practice in preschool, or they might graph data from a book (e.g., “Which character helped solve the most problems?”) or event (e.g., “How many children used the swings today?”), or take inventory of a set of objects (e.g., “How many green vs yellow blocks are in this bin?”).
Fostering Learning with Digital Tools
Using digital tools to collect and represent data shows that technology can be useful in a problem-solving and sense-making endeavor (NRC Citation2012; Papert Citation1980). However, there are few digital tools that are developmentally appropriate for preschool classrooms. Moreover, research on how to engage young, preliterate children in DS with digital tools is limited. Therefore, the Preschool Data Toolbox was designed to build knowledge about how to support teachers to foster early DS skills as young children use mathematics and a digital tool to answer real-world questions.
Leveraging digital tools to support learning, particularly with data, provides an opportunity to support both teachers and students. Instead of a game that a child can play independently, this digital tool is meant for teachers to use as a way to support preschoolers’ explorations throughout the investigation process. For example, you might see teachers and preschool children collaborate to pose a question that the children are interested in, decide which data to collect, sort the data, then use the app to take pictures and label the categories, and generate a graph or tally chart quickly and easily, followed by a deep and meaningful data talk.
The use of a digital tool and corresponding app supports teachers throughout the problem-solving process, which can be a challenging instructional practice with young children. The affordances of technology also include the ease of creating data displays and visualizations that do not take away from instructional time, and the digital tools within the analysis page allow teachers to draw on the screen, sort categories, alter how data are displayed, and use prompts to drive the discussion.
Technology and Classroom Management
It is important to note that teachers are the intended app users, not children themselves. In most cases, teachers select the options in the app. As a way to engage children in the activity, many teachers hold the tablet and ask children to help by selecting the categories to include in their graph. These categories are pre-reader friendly icons or photos (such as an apple icon and a photo of a toy eggplant). Children can easily enter the counts for each category (e.g., tap plus or minus sign to add or remove a data point). During the data talk, teachers can literally draw children’s attention to specific aspects of the graph by using the drawing tool or sorting feature ().
As children gain familiarity with the app, they may use it more independently. The balance between the teacher controlling the tablet and childrens’ use of the tablet can be shifted as children learn about the goals of the investigations (create categories, collect data, sort data) and their comfort selecting options on the screen alone grows. For example, after using the app for over a month, a child carried the tablet around like a clipboard as she approached each classmate, gathered their vote, and entered the data into a visual representation. This was followed up by a circle time discussion to find out which activity was most and least selected. Teachers reported that using the tablets with children was easier than they initially expected, and as time went on, they felt more comfortable implementing the investigations.
Leveraging Mathematics to Build Data Knowledge
With dual engagement in fostering mathematics content and scientific practices, this program provides a platform to cross-pollinate STEM instruction at the preschool level and prime children for learning throughout the elementary school years. The program’s development process leveraged co-design with teachers and research to ensure that revisions were made to both the investigations and the app in response to teacher feedback and children’s responses to engaging with the tool and related learning activities (Lewis Presser, Young, et al. Citation2022). Our findings suggest that teachers desired these resources, appreciated the teacher guide, lessons, and supports, and gained confidence in their ability to use data in their teaching. Children were observed engaging playfully during investigations and improved in their mathematics knowledge and data science skills (Lewis Presser, Young, Clements, et al. Citation2022; Lewis Presser et al. Citation2023).
Below we describe a few lessons learned about how the program fosters learning.
Extending and Expanding Mathematics Skills
Through a series of studies, we found that this program provided a platform to practice mathematics skills (e.g., counting) and introduce new ways to use mathematics in an applied manner (e.g., comparing quantities in two categories; using data to answer questions). The extension of mathematics into the applied space and use of visuals were particularly helpful. As one teacher explained:
“The students are going around and asking questions and getting answers, and they have the ability to look at the data that they collected. And if you were to say, well, what are you learning today or what did you ask, they’re able to use the visuals and explain it themselves rather than looking at a board and seeing words that they might not be able to read. They understand colors. They understand shapes. They understand pictures. Those are symbols that have meaning to them. So, they’re able to do it [read the graphs] on their own. They loved being data scientists and taking on that role.”
Leveraging Mathematics to Foster Growing Science Practices
This naturally stimulates connections by partnering mathematics, science, and technology. One teacher explained the ubiquitous way the app could be used for cross-content learning:
“That’s where it was fun. You could implement other things into the app. So it was everything. It was social studies. It was self-awareness. It was science and literature and the math, which is the most important part. So I thought it was great to have everything in one app, and it was just so versatile that it’s user friendly, and I really had a blast.”
Supporting Teachers Professionally
The program and related app were educative not only for children but also for teachers who felt more confident delivering mathematics instruction and doing so regularly. For example, a teacher said:
“Math has never really been my strong suit, so it’s definitely not something I would always gravitate towards. So I feel like the app was a great tool to include math in our lesson plans every week.”
“It was really one of the first times I’ve done in-depth graphs with the children. So I think it was a great experience. Not only for the kids, [but] for me too.”
Venue for Data Discussions
The investigations offered a way to talk with preschoolers about the data they saw in the graph and help them interpret it to answer the research question while engaging their critical thinking skills. Children’s use of language was illustrated by their engagement in the scientific process:
“Using their language to express what they want to do and how we [were] going [to] find out…they fill the cup with water and fill a bottle and said, ‘let’s measure how many cups in this whole [bottle]…how many cups will [you] put in here? [pointing to top of bottle]’ That’s amazing. Amazing. For four-year-olds to think about it and be like a scientist.”
Investigations Extend Learning and Foster Children’s Interest
The “Create Your Own (CYO)” investigations allowed teachers to build on other activities they were already doing in the classroom. One teacher described how she built an CYO Investigation into their butterflies unit, which maintained children’s interest in the unit while they waited for the butterflies to emerge from their chrysalises.
“I liked how it was a topic that we had and talked about in our previous [lesson] studies. I liked that it [Create Your Own] was a high interest investigation, because we had butterflies, and were hoping they were going to emerge soon, so there was a lot of excitement around the insect unit to start with and they always love to share their opinions.”
Conclusion
This program seeks to foster children’s problem solving skills in mathematics and science, while leveraging the affordances of technology so that data can be collected easily and efficiently to answer research questions. These investigations help preschool children employ science practices (e.g., asking questions, using models; NGSS Lead States Citation2013) and build their mathematics knowledge (e.g., counting, sorting, classifying data), as well as their CT and problem-solving skills such as reasoning and interpreting data. The digital app provides scaffolding for each step of the investigation and serves to visually organize the data as a way to engage children in developmentally appropriate discussions.
The curricular investigations and app provided children with learning opportunities that would not otherwise be easy to implement in a preschool classroom. It builds on the meaningful mathematics that children are already doing and extends that learning to science practices. Results from our studies suggest that the app provided a systematic process for data collection, entry, and interpretation; one teacher summarized how the app supported her students’ learning:
“Once they got toward the end [of the investigation], children anticipated the questions and took time to think about what the graph represented. Seeing the graph was really helpful. They loved [using] the iPad.”
This program supported teachers and children through the science practice of using mathematics and data-focused computational thinking. Teachers like that the activities integrate hands-on materials with movement, include data talks and discussion, and engage children in play-based lessons with authentic research questions that are relevant to children’s lives.
Funding
This material is based upon work supported by the National Science Foundation Award # DRL 1933698. Any opinions, findings, and conclusions or recommendations are those of the author(s) and do not necessarily reflect the views of the NSF.
Supplemental Resource
All teacher materials and links to the digital tools can be found for free at: https://first8studios.org/gracieandfriends/guide/dca.
Additional information
Notes on contributors
Ashley Lewis Presser
Ashley Lewis Presser ([email protected]) is a Senior Research Scientist at Education Development Center, Center for Children and Technology in New York City.
Jessica Mercer Young
Jessica Mercer Young is a Principal Research Scientist at Education Development Center in Waltham, Massachusetts.
References
- Carle, E. 1994. The Very Hungry Caterpillar. Puffin.
- English, L. D., and J. Watson. 2015. “Statistical Literacy in the Elementary School: Opportunities for Problem Posing.” In Mathematical Problem Posing: From Research to Effective Practice, edited by F. M. Singer, N. F. Ellerton, and J. Cai, 241–256. New York: Springer.
- International Society for Technology in Education (ISTE) and the Computer Science Teachers Association (CSTA). 2011. Operational definition of computational thinking for K-12 education.
- K–12 Computer Science Framework. 2016. Retrieved from www.k12cs.org
- Lewis Presser, A. E., J. Young, M. Cerrone, L. Clements, and H. Sherwood. 2022. “The Potential and Developmental Appropriateness of Data Collection and Analysis Activities for Preschoolers: A Formative Study with Teachers.” International Journal on Integrating Technology in Education 11 (1): 1–15.
- Lewis Presser, A., E. J. Young, L. Clements, D. Rosenfeld, J. F. Kook, H. Sherwood, and M. Cerrone. 2022. “Exploring Preschool Data Collection and Analysis: A Pilot Study.” Education Sciences 12 (2): 118.
- Lewis Presser, A., E. J. M. Young, D. Rosenfeld, L. J. Clements, J. F. Kook, H. Sherwood, and M. Cerrone. 2023. “Data Collection and Analysis for Preschoolers: An Engaging Context for Integrating Mathematics and Computational Thinking with Digital Tools.” Early Childhood Research Quarterly 65 (4): 42–56.
- National Research Council (NRC). 2012. A Framework for K–12 Science Education: Practices, Crosscutting Concepts, and Core Ideas. Washington, DC: National Academies Press.
- NGSS Lead States. 2013. Next Generation Science Standards: For states, by states. Washington, DC: National Academies Press. www.nextgenscience.org/next-generation-sciencestandards
- Papert, S. 1980. Mindstorms: Children, Computers, and Powerful Ideas. New York: Basic Books.
- Platas, L. M. 2017. “Three for One: Supporting Social, Emotional, and Mathematical Development.” Young Children 72 (1): 33–37.