Abstract
We estimated the application of cattle, swine, and poultry manure and of rice straw and rice straw compost for seven crop groups (paddy rice, upland crops, vegetables, orchards, tea, forage, and fodder) from a bottom-up analysis of government questionnaire data. Vegetable crops consumed the most manure and received the largest amount of swine and poultry manure and of rice straw compost, and the second-highest amount of cattle manure. Paddy rice received the least manure, and depended mainly on organic matter from non-composted rice straw. Fodder (timothy (Phleum pratense. L.), etc.) and forage (dent corn (Zea mays L.), etc.) crops used for cattle husbandry consumed the most cattle manure; however, fodder crops received only one-quarter of the cattle manure received by forage crops. We hypothesized phosphorus (P) is not lost during composting, then estimated the amount of raw materials for livestock manure inversely from applied livestock manure P and carbon (C):nitrogen (N):potassium (K):P ratio of kinds of livestock excreta. More than half of livestock excreta (6224 Gg C, 589 Gg N, 90 Gg P, and 278 Gg K) was utilized for manure. However, manure applied (2300 Gg C, 158 Gg N, 90 Gg P, 154 Gg K) was lower than in a previous study based on a top-down analysis (161 Gg N, 92 Gg P), possibly because mainly poultry excreta (520 Gg C, 75 Gg N, 11 Gg P, 13 Gg K) and a considerable amount of livestock excreta (3654 Gg C, 353 Gg N, 53 Gg P, 174 Gg K, not including loss during storage) were not utilized. A newer survey to grasp the present state of fertilization done by the government could update our assessment of the use of livestock excreta for crop production based purely on top-down approaches.
Introduction
The application of livestock manure to cropland is essential for maintaining and increasing soil fertility in terms of the carbon (C), nitrogen (N), phosphorus (P), and potassium (K) content, and for sustainable crop nutrition. However, excessive application of manure causes various forms of environmental damage, such as water pollution by N (Nishio Citation2003; Mishima et al. Citation2009) and P (Mishima and Kohyama Citation2010b), global warming caused by nitrous oxide emission (Freney Citation1997), and soil cation imbalance caused by excessive input of K (Inoue Citation2005). Therefore, local Japanese governments have established limits for manure application as a function of climatic and soil conditions (e.g., Hokkaido Agricultural Policy Division (Citation2002) and Tochigi Prefecture Agricultural Division (Citation2002)). Despite the existence of these guidelines, the real application rates by farmers have not been verified. This is problematic because it is necessary to understand local and regional application rates so that farmers can achieve optimal soil fertility, organic matter application, and management of organic resources (i.e., livestock excreta) without endangering the environment.
Mishima et al. (Citation2009, Citation2010a) estimated the fate of N and P in livestock excreta in Japan by estimating the amounts that were utilized as manure or treated as waste; the analysis was conducted at national and prefectural scales from 1985 to 2005. The non-utilized proportion of the excreta increased continuously during this period. In this study, we estimated the proportion of livestock excreta utilized as manure by multiplying the total excreta production by a utilization rate estimated by dividing data on actual excreta utilization by total excreta production recorded by the Japanese Ministry of Agriculture, Forestry, and Fisheries (MAFF Citation1986, Citation1991, Citation1996a, Citation2001, Citation2006).
Kohyama et al. (Citation2006) estimated the fate of nutrients in livestock excreta in terms of volatilization, application to agricultural land, sale or shipment, and other categories combined, at both national and district scales in Japan. They stated that a large proportion of cattle excreta was applied to agricultural land, whereas swine excreta were treated as sewage and poultry excreta were sold for use as manure in 2002. Nishio (Citation2003) also studied the production of livestock excreta and their fate at a national scale for Japan, and stated that 240 Gg of manure N was applied to non-forage crops and 340 Gg of manure N was applied to forage crops in 1998. This application rate was much larger than the values that we estimated (Mishima et al. Citation2009, 2010a). These past studies represent top-down approaches (), because they distributed the livestock excreta among different uses based on ratios or amounts determined using various kinds of high-level statistics, rather than collecting data at the level of individual farms. By using this top-down approach, Mishima et al. (Citation2010a) estimated manure N and P application for six crop groups. However, these estimates were not verified.
Figure 1. Conceptual workflow used in the (a) top-down and (b) bottom-up approaches. Full-time farm is defined as no household member engaged in jobs other than farming. Part-time farm is defined as one or more household members engaged in jobs other than farming.
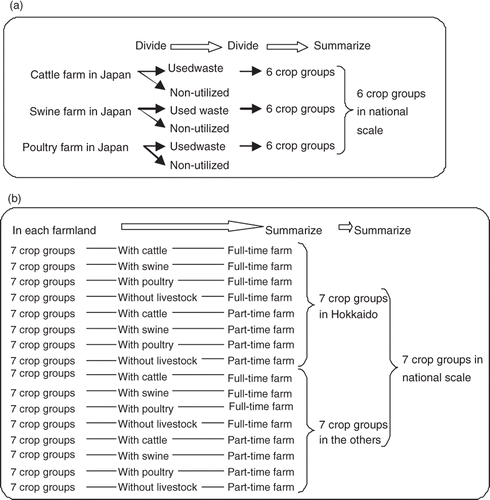
In the present study, we investigated the amount of livestock manure C, N, P, and K for seven crop groups (paddy rice, upland crops, vegetables, orchards, tea, forage crops, and fodder) directly based on national-scale raw data from government questionnaires to farmers about their management of agricultural land from 1994 to 1997. Thus, this approach involved bottom-up estimation based on information provided by farmers (). In addition, we estimated the application of C, N, P, and K in rice straw and rice straw compost, because rice straw and its compost are useful materials for many kinds of crops, including as mulch for upland crops and vegetables. A second goal was to validate our results by comparing the manure application rates with our previous estimates (Mishima et al. Citation2010a) that were made available in database format on MS Excel by Mishima and Kohyama (Citation2010a). We also estimated the fate of C, N, P, and K in livestock excreta based on the number of livestock and their basic excretion data, estimated by Kohyama et al. (Citation2006) using government feed consumption data (MAFF Citation2003). We performed our comparison using data from 1995 because this was the only year included in both the questionnaire period and in Mishima and Koyama's database.
Materials and Methods
Data sources
The questionnaire distributed by MAFF in 1994 to 1997, the “4th Investigation for Actual Agricultural Soil Management,” collected a range of information across types of agricultural soil management, including the crops that were planted, the kind of fertilizer used and its nutrient content, the application dates, and the frequency and type of manure application, as well as data on the farm's management, such as administrative condition, whether the farmer also owned livestock, and the type of machinery used. Data was obtained from more than 17,000 farms, and the total number of crop records was more than 21,000. We extracted data at the prefecture level for the kind of crop, area planted with that crop, manure application level, farm administrative condition, and livestock ownership to provide insights into Japanese manure application to farmland at a national level.
Application of manure and rice straw
The method to estimate application of manure and rice straw was according to Leon et al. (under review) with modifications. Farms were classified into eight categories, the same as Leon et al. (under review): two levels of administrative division (full-time farm or not), two levels of livestock ownership (owned or not), and two levels of region (Hokkaido versus all others). Agricultural land was categorized into seven crop categories depending on the type of planted crops: paddy rice, upland crops (e.g., wheat, barley), vegetables, orchards, tea, forage (e.g., dent corn, sorghum, green rye), and fodder (e.g., orchard grass, timothy, Italian ryegrass). We then used a bottom-up approach to estimate the application of manure and rice straw (raw or composted) to the resulting 56 categories (eight levels by seven crops) of agricultural land and the total manure application to agricultural land in Japan, as illustrated in . In each crop category, application of 6 kinds of livestock manure (cattle waste, swine waste, other (poultry) waste, cattle manure composted with wood chips, swine manure composted with wood chips, and other (poultry) waste manure composted with wood chips), rice straw manure and raw rice straw was estimated the same as Leon et al. (under review). We noted cattle manure was set as slurry when cattle manure application was 40 Mg ha−1 yr−1, because the National Grassland Research Institute (NGRI Citation1986) reported that about 40 Mg ha−1 yr−1 of composted cattle manure application was the upper limit of suitable for forage production. We converted the amounts of manure, rice straw, and rice straw compost into the corresponding amounts of elements, i.e., C, N, P, and K (E; Mg yr−1) using the following formula:
Amount and fate of livestock waste
We based the daily amount of fresh livestock waste produced and its N, P, and K contents per animal on the data of Kohyama et al. (Citation2006). We calculated livestock waste C excretion based on its water content (Kohyama et al. Citation2006) and C content (Kimura et al. Citation2011). Livestock numbers in 1995 were obtained from MAFF (Citation1996b).
To estimate the C, N, P, and K amount in livestock waste (LW; Mg yr−1) for waste type i, we used the following formula:
We calculated the C excretion in livestock waste (LW c; kg yr−1) using the following formula:
We assumed that P was not lost during composting (Mishima et al. Citation2008). Based on this assumption, we determined the fate of the P in excreted waste as either not-utilized (NU), total livestock waste (LW), or utilized as manure or slurry (E), using the following equation:
To calculate the amount of P from cattle manure that is not used (NUPcattle ) based on the cattle waste (LWPcattle ), the use of rice straw as bedding material (BMP ), and the national total for cattle manure or slurry P (EPcattle ), we used the following equation:
We estimated C, N, and K (k = 1, 2, 4) in livestock waste that was used as raw material for manure or slurry (RM, Mg yr−1) for livestock i (i = 2, 3; swine and poultry) using the following equation:
We calculated the annual loss of C, N, and K during composting (Loss; Mg yr−1, on here, i = 1 to 3 and k = 1, 2, 4) and the amount that was not utilized for crops (NU; Mg yr−1, on here, i = 1 to 3 and k = 1 to 4) as follows:
Using these 9 equations, we calculated the fate of the nutrients in all livestock excreta, rice straw, and rice straw compost.
Results and Discussion
Application of manure and rice straw to crops
shows the estimated application of C, N, P, and K by manure, rice straw, and rice straw compost for the seven crop groups. Vegetables received the highest total amounts of C, N, P, and K. Vegetables received the second-largest amount of cattle manure (forage crops received the most), but received the largest amounts of C, N, P, and K from swine and poultry manure and rice straw compost. Farmers who raised upland crops and vegetables favored cattle manure rather than swine manure (Yamaguchi Citation1997) because of problems caused by the high copper and zinc content in swine manure (Yamaguchi Citation2008b). However, vegetables received more N, P, and K from swine manure than did any other crop. Vegetables are a cash crop, therefore farmers provide high inputs of inorganic N and P fertilizer in addition to manure to ensure adequate yields (Mishima et al. Citation2010b). Vegetable fields, especially for crops grown under plastic film, can greatly reduce soil fertility (Shiga Citation1994), and this explains why vegetables were the crop that received the greatest amount of manure. Based on the N content, the manure application level appears to be appropriate (Shiga Citation1994). However, we could not find enough information to evaluate whether the farmers maintained appropriate levels of C, P, and K application.
Figure 2. Amount of applied carbon (C), nitrogen (N), phosphorus (P), and potassium (K) through the application of livestock manure, rice straw compost and rice straw for the seven crop groups from the calculation in this study. Paddy rice (Oryza sativa L.), Upland crop (Poaceae triticum L., etc.), Vegetables (Raphanus sativus L., etc), Orchard (Malus pumila Mill. etc), Tea (Camellia sinensis L.), Forage (Zae mays L. etc.), Fodder (Phleum pratense L.).
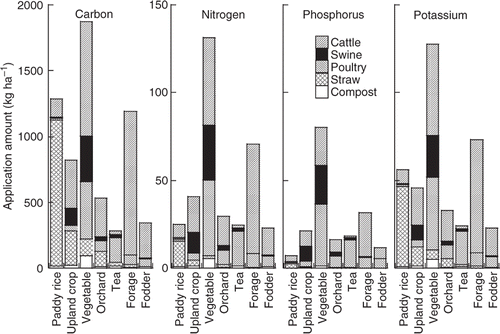
Paddy rice received the second-highest amount of total C among the crops (after vegetables), but received the lowest amount of P, probably because rice straw (which has a low nutrient content but high C content) was the main source of organic matter input. Paddy rice received a lower amount of livestock manure than the other crops. Decreased manure input or a low level of manure input is sometimes a warning that soil fertility may soon decrease (MAFF Citation1996c), although soil fertility could be maintained by applying all the rice straw produced by a rice crop (Shiga Citation1994; Shibahara et al. Citation1999; Takeda et al. Citation2000).
Forage received the third-highest total C input. This crop was the largest receiver of cattle manure because forage (dent corn, sorghum, etc.) needs large nutrient inputs and is an important land use in Japan to support cattle husbandry. However, fodder (orchard grass, timothy, etc.) received the second-lowest amount of C and the lowest amount of N, even though these crops are also used to support cattle husbandry. This difference between forage and fodder might relate to differences in the intensity of land use, and the difficulty of spreading cattle manure (including slurry) in fodder crop fields, which are larger than forage crop fields.
Tea received the highest inputs of N and P as inorganic fertilizer (Mishima et al. Citation2010b). Tea also received the second-highest amount of poultry manure, although tea also received small amounts of other manure. On a tea plantation, poultry manure is applied as a rapid-release fertilizer that is not expected to increase and maintain soil organic matter levels or soil fertility, because poultry manure degrades more easily and releases inorganic N more rapidly than the other manures (Uenosono et al. Citation2004).
Cattle manure application levels were higher for upland crops and orchards than for fodder crops. Upland crops received the second-highest amount of swine manure, although the application level was only about one-third of the level for vegetables. Upland crops received about one-quarter the amount of manure that vegetables received and orchards received about one-tenth the amount of rice straw received by paddy rice. Upland crops include wheat and barley, which are planted as a winter crop in paddy rice fields, and this may explain why upland crops received relatively large amounts of rice straw. Rice straw is sometimes utilized as bedding material or mulching material for some kinds of upland crops, vegetables, and orchards. Therefore, these crops would also receive rice straw. In terms of the total N application, upland crops and orchards might receive small amounts of N to maintain soil fertility (Shiga Citation1994). However, available P in the soil of these crops has been increasing from 1984 to 1993 (Obara and Nakai Citation2004).
Fate of livestock excreta and rice straw
summarizes the fates of C, N, P, and K from livestock excreta, rice straw, and rice straw manure in 1995. Because our estimates of the nutrient contents of these materials were based on fresh weights, we have also presented the fresh weights used to calculate the nutrient contents. More than half of the excreta from each kind of livestock (5500 Gg C, 580 Gg N, 88 Gg P, and 249 Gg K) were utilized as manure. Total C loss during composting was 38% for cattle manure, 82% for swine manure, and 73% for poultry manure. Cattle manure includes slurry that would be low C loss during making. N loss during composting was 65% for cattle manure, 81% for swine manure, and 82% for poultry manure. This rate for swine was larger than the rate of 63.3 to 71.7% reported in our previous work (Mishima et al. Citation2008). This difference resulted from differences in the basic unit of excretion used in the two studies. Mishima et al. (Citation2008) used values from Tsuiki and Harada (Citation1997), who calculated the amount of N and P in excreta when livestock were supplied with feed at 120% of the recommended feeding level. The basic unit of excretion of Tsuiki and Harada (Citation1997) was smaller than that of Kohyama et al. (2008).
Table 1 Fate of livestock excreta and rice straw in Japan
K loss in this study in cattle, swine, and poultry manure during composting was 49, 48, and 0%, respectively. During composting, C and N would be lost as gas (CO2, NOx, NH3) and C, N, and K would be lost through leaching as soluble organic material and in ionic form. However, the reason for no loss of K during the creation of poultry manure is not clear, though it is possible that this nutrient is preserved under the dry conditions used for composting this manure. During rice straw composting, the loss of C, N, and K in this study was 84, 22, and 79%, respectively. The relatively low loss of N is likely to have been caused by the high C/N ratio (Matsuzaki 1990) in the raw material.
We ignored the contributions of co-material used during composting, such as rice husks, wood chips, and sawdust. Although more than half of excreta is typically composted without such co-materials (Murakami Citation2008; Yamaguchi Citation2008a, Citation2008b), except for composts used as bedding material on cattle husbandry, Kohyama et al. (Citation2006) stated that the input of nutrient ingredients in co-material would be significant when these materials are used. The MAFF questionnaire contains the item “cattle, swine and the other (poultry) manure with sawdust” separate from “cattle, swine and the other (poultry) manure”, and calcium cyanamide is sometimes used as a soil amendment in the creation of rice straw compost. These factors might have caused estimation errors in calculations of the loss during composting.
Our results were comparable (−3% on P) to those in the database developed by Mishima and Kohyama (2010a) for cattle manure, but were 50% higher for swine manure and 20% lower for poultry manure (). Despite the different estimation methodologies, which used a top-down approach in the previous study by Mishima and Kohyama (2010a) and a bottom-up approach in the present study, the values were generally comparable for cattle manure, roughly comparable for poultry manure, and very different for swine manure. One problem is that the basic unit of livestock excretion for N and P differed between the two studies, so this comparison does not provide a robust validation of the present results. The merit of the top-down approach is that it is easy to calculate results using publicly available data at a wide scale (e.g., country, district, prefecture), and the process can be repeated as often as annually. The biggest problem is that the lack of real application data at the farm level makes it difficult to validate the results. On the other hand, the bottom-up method we developed in this study permits corroboration of the results using real application data. Therefore, it might provide more confidence in the results than with the top-down method if the data is sufficiently representative of the survey population. However, bottom-up data is not always available over a longer time sequence and calculation of the results is expensive and time-consuming.
Conclusions
Using data from 1995, we compared estimates of N and P application in manure using top-down and bottom-up approaches, and obtained similar results. The N and P application levels were similar for all crops that we studied. This result indicates the reliability of the results. Because of the importance of these data, both approaches should be implemented to obtain more reliable and realistic values for manure use in agriculture and the resulting input of nutrient ingredients. It would be useful to have access to more recent questionnaire data so we could investigate compliance with Japan's laws governing the processing of livestock waste and sustainable crop production, since the database suggested that large amounts of livestock excreta were not utilized in 2000 and 2005.
We estimated the amount of manure applied, validated the amount, and thereby clarified the fate of the livestock excreta. However, our study cannot determine the appropriateness of the manure application levels for each group of crops because empirical data on the optimal levels are not available. To assess the appropriateness of current manure application levels, it will be necessary to obtain data on the combined soil nutrient levels provided from the use of manure and inorganic fertilizers, the associated crop yields, and changes in soil C, N, P, and K levels. These results can then be compared with reference values such as those described in the Soil Fertility Enhancement Act of Japan.
Acknowledgments
The questionnaire data were provided by the Natural Resources Inventory Center, National Institute for Agro-Environmental Sciences. This work was funded by MAFF under the project “Development of mitigation and adaptation techniques to global warming in the sectors of agriculture, forestry, and fisheries”.
Related Research Data
References
- Freney , JR . 1997 . Emission of nitrous oxide from soils used for agriculture . Nutr. Cycl. Agroecosyst. , 49 : 1 – 6 .
- Hokkaido Agricultural Policy Division . 2002 . Crop Production Standard , Sapporo : Hokkaido . (in Japanese)
- Inoue , K . 2005 . Soil behavior, the adequate amount of fertilizer and the simple analyzing method of nitrate nitrogen for green asparagus production by whole season cropping system . Bull. Nagasaki Agric. For. Exp. Stn. , 31 : 1 – 14 . (in Japanese with English summary)
- Kimura , SD , Mishima , SI and Yagi , K . 2011 . Carbon resources of residue and manure in Japanese farmland soils . Soil Sci. Plant Nutr. , 89 : 291 – 302 .
- Kohyama , K , Hojito , M , Sasaki , H and Matsuura , S . 2006 . Estimation of the amount of nutrients in livestock manure . Jpn. J. Soil Sci. Plant Nutr. , 77 : 283 – 291 .
- MAFF 1986: Production Cost of Livestock Products. Norin Tokei Kyokai, 36–160, Ministry of Agriculture, Forestry, and Fisheries, Tokyo (in Japanese)
- MAFF 1991: Production Cost of Livestock Products. Norin Tokei Kyokai, 36–174, Ministry of Agriculture, Forestry, and Fisheries, Tokyo (in Japanese)
- MAFF 1996a: The 71st Statistical Yearbook of Ministry of Agriculture Forestry and Fisheries. Norin Tokei Kyokai, 145–182, Ministry of Agriculture, Forestry, and Fisheries, Tokyo
- MAFF 1996b: Production Cost of Livestock Products. Norin Tokei Kyokai, 30–171, Ministry of Agriculture, Forestry, and Fisheries, Tokyo (in Japanese)
- MAFF 1996c: Rice Related Report. 205, Ministry of Agriculture, Forestry, and Fisheries, Tokyo (in Japanese)
- MAFF 2001: Production Cost of Livestock Products. Norin Tokei Kyokai, 38–215, Ministry of Agriculture, Forestry, and Fisheries, Tokyo (in Japanese)
- MAFF 2003: Production Cost of Livestock Products. Norin Tokei Kyokai, 31–215, Ministry of Agriculture, Forestry, and Fisheries, Tokyo (in Japanese)
- MAFF 2006: Production Cost of Livestock Products. Norin Tokei Kyokai, 32–187, Ministry of Agriculture, Forestry, and Fisheries, Tokyo (in Japanese)
- Matsuzaki , T . 1990: Soil, Manure and Organic Matter. Ieno Hikari Kyokai, Tokyo (in Japanese)
- Mishima , S , Akiyama , H , Yagi , K and Kohyama , K . 2008 . The trend of livestock manure qualities and estimation of nitrogen loss rate by composting . Jpn. J. Soil Sci. Plant Nutr. , 79 : 370 – 375 .
- Mishima , S , Endo , A and Kohyama , K . 2009 . Recent trend in residual nitrogen on national and regional scales in Japan and its relation with groundwater quality . Nutr. Cycl. Agroecosyt. , 83 : 1 – 11 .
- Mishima , S , Endo , A and Kohyama , K . 2010a . Recent trends in phosphate balance nationally and by region in Japan . Nutr. Cycl. Agroecosyt. , 83 : 41 – 61 .
- Mishima , S , Endo , A and Kohyama , K . 2010b . Recent trends in phosphate balance nationally and by region in Japan . Nutr. Cycl. Agroecosyt. , 87 : 159 – 173 .
- Mishima , S and Kohyama , K . 2010a . The database and the methodologies to estimate recent trend of nitrogen (N) and phosphate (P) flows and residual N and P in Japanese national prefectural scales and examples their application . Bull. Natl. Inst. Agro-Environ. Sci. , 27 : 117 – 139 .
- Mishima , S and Kohyama , K . 2010b: Phosphorus Load Potential and Estimates From Phosphorus Surplus in Japanese Agriculture. 14th International Conference on Diffuse Pollution and Eutrophication Program and Book of Abstracts. International Water Association, Washington, DC
- Murakami , K . 2008: Self-sufficient organic fertilizer poultry dung. In Encyclopedia of Agricultural Technologies. Soil Fertilization part 7-1, Ed. Nosangyosonbunkakyokai pp, 294-1-6–294-1-12. Nosangyosonbunkakyokai, Tokyo
- NGRI 1986: Present State of Fertilization Standard on Grassland and Forage Crops. National Grassland Research Institute, Nishinasuno. NGRI Report 60-9
- Nishio , M . 2003 . Estimation of flow sheet and load unit to farm soils of nitrogen excreted by animals on the basis of the national statistical data . Jpn. J. Soil Sci. Plant Nutr. , 74 : 721 – 730 .
- Obara , H and Nakai , M . 2004 . Available phosphate of arable lands in Japan. Changes of soil characteristics in Japanese arable lands (II) . Jpn. J. Soil Sci. Plant Nutr. , 75 : 59 – 67 . (in Japanese with English summary)
- Shibahara , F , Takehisa , K , Komatsu , S and Habe , T . 1999 . Effects of long-term application of organic matter and soil improvement fertilizer on paddy rice. I. Changes of growth and yield of rice nutrients uptake by rice, chemical properties of soils . Bull. Shiga Agric. Exp. Stn. , 40 : 54 – 77 . (in Japanese with English summary)
- Shiga , H . 1994: Capacity of Organic Resources Application to Farmland and Livestock Wastes, Ed. MAFF, pp. 25–44, Research and Development Center for Dairy Farming, Research Center for Dairy Farming, Sapporo (in Japanese)
- Takeda , Y , Shibata , K and Hashimoto , S . 2000 . Effect of long-term application of organic matter to Andosol paddy fields on the yield . Bull. Tochigi Agric. Exp. Stn. , 49 : 15 – 23 . (in Japanese with English summary)
- Tochigi Prefecture Agriculture Division 2002: Fertilization Standard. Tochigi Prefecture, Utsunomiya (in Japanese)
- Tsuiki , M and Harada , Y . 1997: Livestock excretion and future theme in Japan. In Environmental Conservation and New Animal Industry, Ed. Nishio M, pp. 15–29. Nourinsuisangijutsukyoukai, Japan (in Japanese)
- Uenosono , S , Nagatomo , M , Takahashi , S , Kunieda , E and Yamamuro , S . 2004 . Evaluation of nitrogen availability of composted poultry and sawdust cattle manures labeled with 15N on paddy field rice . Jpn. J. Soil Sci. Plant Nutr. , 75 : 313 – 319 . (in Japanese with English summary)
- Yamaguchi , T . 1997 . Treatment and utilization of animal wastes (1) . J. Agric. Sci. , 52 : 299 – 303 . (in Japanese)
- Yamaguchi , T . 2008a: Self-sufficient organic fertilizer cattle dung and urine. In Encyclopedia of Agricultural Technologies Soil Fertilization part 7-1, Ed. Nosangyosonbunkakyokai, pp. 289–292. Nosangyosonbunkakyokai, Tokyo (in Japanese)
- Yamaguchi , T . 2008b: Self-sufficient organic fertilizer swine dung and urine. In Encyclopedia of Agricultural Technologies. Soil Fertilization part 7-1, Ed. Nosangyosonbunkakyokai, pp. 293–294. Nosangyosonbunkakyokai, Tokyo (in Japanese)