Abstract
In many countries, high nitrous oxide (N2O) emissions have been observed during soil freezing and thawing periods. Quantification of those emissions is crucial to evaluate annual N2O emissions. For this study, we measured N2O and nitric oxide (NO) fluxes along with soil N2O concentrations at a corn (Zea mays L.) field and five grasslands (Phalaris arundinacea L. and Phleum pratense L.) during a winter-spring period in southern Hokkaido, Japan. We also measured denitrification activities of the soils from those sites. During the observation period, the soils froze to a maximum depth of 370 mm under saturated conditions and the lowest soil temperature at a 50 mm depth was −4.5°C. After 6 March 2005, daily air temperature rose above 0°C, but the soil temperature remained approximately 0°C for about two weeks. These two weeks were defined as the “transition period,” while the periods before and after the transition period were defined as the “freezing” and the “thawing” periods, respectively. During the freezing and transition periods, N2O concentration increased in the frozen soils relative to the unfrozen soils, and the highest values were observed in the frozen soils during the transition period. During the thawing period, the N2O concentration in the soils decreased. N2O emissions were much higher during the thawing period than during the freezing and transition periods, and remarkably higher N2O emissions were observed at the corn site compared to those at the grassland sites. NO emissions were also observed during the thawing period but at much lower levels than N2O emissions at all the sites. N2O-N/NO-N ratio exceeded one at all the sites during the entire period, indicating N2O production through denitrification. At the corn site, denitrification activity was much lower and N2O/(N2O+N2) was much higher than at the grasslands. The result indicated that high N2O emissions at the corn site were caused by complementary processes: (1) high accumulated N2O through denitrification in the frozen soil during the freezing and transition periods, and (2) low N2O reduction rate during the thawing period.
INTRODUCTION
Nitrous oxide (N2O) is a major greenhouse gas that is also responsible for destruction of stratospheric ozone (Crutzen Citation1970). Global N2O emissions are estimated at 17.7 Tg N y−1 and of those, an estimated 6.7 Tg N y−1 are from anthropogenic sources (Denman et al. Citation2007). Agricultural soils are the main source of N2O emissions, at an estimated 42% of total anthropogenic N2O emissions (Denman et al. Citation2007).
In soils, N2O is produced mainly by nitrification and denitrification. These biological processes are influenced by soil environmental factors, such as moisture condition, oxygen (O2) level, soil temperature, nitrogen (N) availability, organic matter content, and pH (Mosier Citation1998; Sahrawat and Keeney Citation1986). The soil freeze-thaw cycle has also been recognized as having an influence on soil N2O emissions, since Bremner et al. (Citation1980) observed N2O emissions during a winter period. Kaiser and Ruser (Citation2000) summarized annual N2O emission data and winter N2O losses observed on arable soils in Germany from 1995 to 1999. The annual N2O losses ranged from 0.53 to 16.8 kg N ha−1 and N2O losses during the winter ranged from 7% to 89%. We also summarized the reported data and the N2O losses during the winter ranged from 0% to 93% (). These results indicate a high concentration of N2O emissions during the winter period and uncertainty of N2O emissions.
Table 1. Nitrous oxide (N2O) emissions during the winter and cropping periods and N2O losses during the winter period for the investigated experiments
It has been assumed that N2O would be produced in an unfrozen soil layer beneath a frozen layer and released from the soil surface during a thawing period once the frozen soil cover has disappeared in situ (Bremner et al. Citation1980; Burton and Beauchamp Citation1994; Kaiser et al. Citation1998). But based on a soil column experiment, Teepe et al. (Citation2001) and Wagner-Riddle et al. (Citation2007) hypothesized that N2O was produced and trapped in the frozen soil during a freezing period and then released during a thawing period. Recently, Yanai et al. (Citation2011) found an increase in N2O concentration with a decrease in O2 concentration in frozen soil during the freezing and thawing periods.
To investigate the N2O production process during the freezing and thawing conditions, soil incubation experiments have been conducted by many researchers. Yanai et al. (Citation2004b) evaluated the nitrification potential of frozen soils and reported that soil freeze-thaw cycles did not inhibit the nitrification potential of soils that experienced a smaller decrease in microbial biomass following the freeze-thaw cycles. The source of ammonium (), which is the base of nitrification, may be soil organic matter (McGarity Citation1962; Groffman and Tiedje Citation1989; Neilson et al.
Citation2001) or destructed microbes or substrates from the destructed microbes (McGarity Citation1962; Groffman and Tiedje Citation1989; Schimel and Clein Citation1996; Yanai et al. 2004a). Christensen and Christensen (Citation1991) evaluated soil carbon availability by denitrifiers, using an acetylene block method under freeze-thaw conditions. Müller et al. (Citation2002) and Ludwig et al. (Citation2004) reported that high N2O emissions were caused by the enrichment of nitrate (
) through 15
addition experiments. Based upon an experiment with a 15N tracer, Wagner-Riddle et al. (Citation2008) concluded that denitrification activity during a thawing period was the main process of N2O production. Mørkved et al. (Citation2006) also conducted a 15
addition experiment and reported that denitrification was the main N2O source in freeze-thaw-affected soil and that soluble carbon could play a significant role in the freeze-thaw cycle. Öquist et al. (Citation2004) observed higher N2O emissions after freezing at −4°C in soils with a high moisture content compared to soils with a low moisture content.
Despite significant research on N2O emissions from soil, there are only a few studies that have measured both N2O concentration in soil and N2O flux at a field and evaluated denitrification potentials as well. The objective of this study was to determine the cause of high N2O emissions from soils during a thawing period. We measured N2O fluxes and N2O concentrations in soils at a livestock farm in southern Hokkaido, Japan. The study was conducted after a cropping period in 2004, because high N2O emissions were observed from 2000 to 2003 (). Furthermore, an incubation experiment was conducted just after soil thawing to measure denitrification activities in soils.
Table 2. Soil properties at 0–100 mm depth at the study site in Shizunai Experimental Livestock Farm
Table 3. Slurry and manure application after the cropping season and nitrogen (N) surplus in 2004 at the study site in Shizunai Experimental Livestock Farm. Slurry was applied on 19 October 2004 and manure was applied on 1 November 2004
MATERIALS AND METHODS
Study area
The study was conducted at the 458-ha Shizunai Experimental Livestock Farm of the Field Science Center for the Northern Biosphere, Hokkaido University, Japan (42°25′54N, 142°28′54E). The site is an experimental station, but also a working production facility where young animals are reared to maturity (e.g., for beef production and preserving native species of Hokkaido horses) and crops (primarily corn (Zea mays L.) and grass (Phalaris arundinacea L. and/or Phleum pratense L.)) are grown to support the animals. The farm is located in the watershed of the Kepau River, which flows through the farm from an upstream forested area. The average annual mean temperature at the study site is 7.9°C, the minimum monthly temperature is −8.1°C in February, and the maximum monthly temperature is 23.6°C in August. The average annual precipitation is 1365 mm.
Measurements were taken at a corn field (C2), a grassland that was recently converted from a corn field in 2003 (CG), and four grasslands (G2s, G2c, G2n and G3) which have been used as a meadow for more than three years. Three grasslands G2s, G2c, and G2n were divided from G2 and named G2s for the southern site, G2c for the center site, and G2n for the northern site (see Supporting Information, Fig. S1). These three grasslands were adjacent to one another and were all managed in the same way. The soil types of the research sites (Katayanagi et al. Citation2008) are Vitric Andosols at CG, G2s, G2c, and G2n and Histosols at C2 and G3 (FAO 1988) (). The dominant vegetation type is corn (Zea mays L.) at C2, reed canary grass (Phalaris arundinacea L.) at G2s, G2c, G2n and G3, and timothy-grass (Phleum pratense L.) at CG. Grass was harvested twice annually and corn was harvested once a year.
After the cropping season in 2004, manure was applied to CG, G3, and C2 on 27 October 2004 and slurry was applied to C2 on 18 October 2004 (). N surpluses at G2, G3, CG, and C2 calculated by Katayanagi et al. (Citation2008) are also provided in .
Temperature, precipitation, and snow depth
Daily precipitation measurements from the farm's Sasayama Weather Station (42°25′54N, 142°28′54E) () were used for the analysis of gas data. Daily air temperature was also observed at the station but there were many missing data due to equipment problems. Snow depth was not observed at the station. Therefore, the data measured at the Shizunai Weather Station (42°20′36N, 142°21′42 E) were used instead. For calculation of gas fluxes, air temperature inside a static chamber was measured with a digital thermometer during the gas measurement. Soil temperature at a depth of 50 mm was measured continuously during the study period at hourly intervals using a small waterproof temperature logger (TR-52, T&D, Nagano, Japan) for one replicate per field. Depth of soil freezing was measured using an acrylic tube that was filled with a 0.03% methylene blue solution. A polyvinyl chloride (PVC) pipe was used to protect the acrylic tube. Petroleum jelly was spread thinly on the acrylic tube to prevent it from sticking to the PVC pipe.
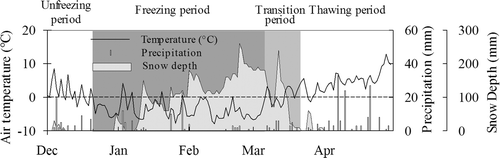
Figure 1. Temporal variability of precipitation observed at the Sasayama Weather Station in the Shizunai Experimental Livestock Farm, and air temperature and snow depth observed at the Shizunai Experimental Station, from December 2004 to April 2005.
Soil sampling
Disturbed soil samples for measurements of soil chemical properties were collected from a depth of 0−50 mm. The sampling was conducted with three to six replicates per site before and after freezing (08 or 18 December 2004 and 19 April 2005, respectively). Only a single sample was collected on 31 March 2005 when the soil started to thaw because only surface soil from approximately 0 to 10 mm depth had thawed, and it was difficult to collect a large volume of soil samples at that time. The collected soil samples were preserved at 4°C and analyzed within a week of sampling.
Analysis of soil chemical properties
The disturbed soil samples from each site were extracted in deionized water (at a 1:5 ratio of soil to water) in bottles and filtered through a 0.2-μm membrane filter using suction. Nitrate-N (-N),
-N and dissolved organic carbon (DOC) concentrations in the extracted solution were determined using ion-exchange chromatography (QIC analyzer, Dionex, Sunnyvale, CA, USA), colorimetry with indophenol-blue, and total organic carbon analysis (TOC-5000 A, SHIMADZU, Kyoto, Japan), respectively. Soil pH was measured with a glass electrode (F-22, Horiba, Kyoto, Japan) using infiltrated samples remaining in the bottle after the filtration.
Measurement of denitrification enzyme activity
Using the disturbed soil samples collected on 31 March 2005, denitrification activity was measured by the acetylene block technique proposed by Tiedje (Citation1994). A total of 15 g of fresh soil sample was thoroughly mixed with a 15-mL chloramphenicol solution (1 g L−1) in a 200-mL serum bottle to prevent enzyme production (Tiedje Citation1994; Lowrance Citation1992; Murray and Knowles Citation1999). To determine the denitrification activity under field conditions, available carbon and nitrogen were not added to the soil samples. The serum bottle was evacuated and flushed four times with N2 to ensure anaerobic conditions. For this study, the incubations were conducted using non-acetylene and acetylene treatments to determine the denitrification activities of N2O production and N2+N2O production, respectively. N2O production was estimated using N2O emissions from the non-acetylene-treated samples and N2+N2O production was estimated using N2O emissions from the acetylene-treated samples, because acetylene inhibits N2O reduction to N2. Acetylene gas was added to a final concentration of 10% (10 kPa) in the headspace for the acetylene treatment. Incubations were conducted in triplicate at 5°C, which was the soil temperature at the time of collection from the field. At 1 and 2 h after the incubation start time, 15 mL of headspace gas was sampled from each bottle into an evacuated glass vial using a 25-mL syringe. N2O concentration of the gas samples, which were kept in evacuated glass vials, was analyzed by gas chromatography with an electron capture detector (GC 14B, Shimadzu, Kyoto, Japan) at 375°C. PorapackQ filled in a stainless steel column (2 m length and 3 mm inner diameter) was used as stationary compound and 5% methane in argon was used as the carrier gas. The minimum detectable concentration of N2O was 0.007 ppmv, as determined from the deviation obtained by repeatedly analyzing the concentration of N2O standard gas (atmospheric level).
Measurement of N2O and NO fluxes
Measurements of N2O and nitric oxide (NO) were conducted once a month in December 2004 and February 2005 and once a week in March and April 2005. Each flux measurement was replicated at four locations per site for G3, CG, and C2 and at six locations per site for G2s, G2c, and G2n.
The measurements were conducted using a closed-chamber technique (Rolston Citation1986). A cylindrical stainless steel chamber (diameter 300 mm, height 350 mm) was used for measurements. Detailed information about this chamber design is reported in a previous study (Katayanagi et al. Citation2008). The deepest snow depth on the monitoring days was only 150 mm, and the chambers were placed on the snow during the freezing period. During the soil freezing conditions, gas samples were collected at 0 and either 40 or 60 min after closing the lid; during the other periods, samples were collected at 0 and 20 min after closing the lid. The chamber height from the snow surface to the top of the chamber was measured for four replicates to calculate gas flux. A 500-mL gas sample was taken using a 50-mL syringe and injected into a 500-mL Tedlar® bag. The bags were then brought to the laboratory and 20 mL of each gas sample was immediately transferred into a 10-mL evacuated glass vial, using a 25-mL syringe, for N2O analysis.
N2O concentrations of the samples kept in evacuated glass vials were analyzed using the gas chromatograph as described earlier. The gas samples kept in Tedlar® bags were analyzed by a chemoluminescence nitrogen oxide analyzer (MODEL-265 P, Kimoto Electric, Osaka, Japan) within 24 h of sampling to measure NO concentrations in the samples.
Measurement of soil N2O concentration
The soil N2O concentration was measured concurrently with the gas flux measurement. Stainless steel tubes (inner diameter 10 mm and outer diameter 12 mm; the lengths of the tubes were the target depth plus 100 mm; there was no side hole on the pipe) were installed in the soil at 100, 200, 300, 400, 500, and 600 mm depths with three replications each. A stainless steel stick (20 mm longer than the pipe) was inserted in the pipe during installation, in order to avoid clogging the pipe with soil and to provide air space (ca. 2 mL) at the bottom of the pipe. The stick was removed after installation. A three-way cock was connected to the aboveground part of an installed pipe using a vinyl tube (100 mm), a straight connector and a silicone tube (50 mm); 50 mL of air was drained from inside the pipe through the cock just after the installation. The pipe was left in place throughout the freezing and thawing periods, and the cock was closed and covered using a cap made of polyethylene terephthalate to avoid freezing the cock from snow and ice exposure. A 50-mL soil gas sample was collected from each pipe. The gas samples were collected slowly to prevent contamination by gas from non-target depths. However, the volumes of the pipes were small and the gas under the target depth would be collected together with the gas at the target depth. The samples that were collected from the same depth were placed into a Tedlar® bag together. A 300-mL air sample from the soil surface was collected near the pipes at the same time. N2O was analyzed using gas chromatography, as described earlier. Because of those operations, we had only one replicate sample per depth at each site; therefore, standard variations could not be reported in this paper.
Calculation of N2O and NO fluxes
N2O and NO fluxes were calculated by a linear regression using the following equation:
Statistical analysis
Statistical analyses were performed with Kyplot 5.0 (KyensLab Inc. Tama, Tokyo, Japan). The -N,
-N, and DOC concentrations, measured before freezing and at the end of thawing, were compared using paired t-tests. Differences between N2O and N2+N2O fluxes, which were the results of denitrification enzyme activity measurement, were also compared using paired t-tests and differences of N2O and N2+N2O fluxes among each site were compared by Tukey-Kramer test. Correlation analyses between the
-N,
-N, and DOC concentrations and the manure plus slurry N application and surplus N were performed using the same software.
RESULTS
Temporal variability of air temperature, soil temperature, precipitation, snow depth and frozen soil layers
The daily air temperature decreased from December to February and increased from March to April (). Daily mean soil temperature at 50 mm depth dropped below 0°C from 20 December 2004 and remained below zero until around 06 March 2005 (). The lowest recorded daily soil temperatures were −4.5, −1.8, −2.3, −4.7, −3.2, and −3.3°C at C2, CG, G2s, G2c, G2n, and G3, respectively. After 06 March 2005, the soil temperature did not increase and remained approximately 0°C for about two weeks, even though air temperature rose above 0°C (). We defined these two weeks as the “transition” period while the periods before and after were defined as the “freezing” and “thawing” periods, respectively. On this definition, the freezing period started from 20 December, and the period prior to 20 December 2004 was defined as the “unfreezing” period.
Figure 2. Temporal variability of (a) soil temperature at 50 mm depth, (b) nitrous oxide (N2O) flux, (c) nitric oxide (NO) flux, (d) N2O-N/NO-N ratio, and (e) N2O concentration in soil with soil freezing depths at one cornfield (C2) and three grasslands (CG [converted from a cornfield in 2003], G2 [including G2s, G2c and G2n], and G3) from December 2004 to April 2005. The lines in e) indicate the edge of the frozen soil layers and the soil between the lines froze.
![Figure 2. Temporal variability of (a) soil temperature at 50 mm depth, (b) nitrous oxide (N2O) flux, (c) nitric oxide (NO) flux, (d) N2O-N/NO-N ratio, and (e) N2O concentration in soil with soil freezing depths at one cornfield (C2) and three grasslands (CG [converted from a cornfield in 2003], G2 [including G2s, G2c and G2n], and G3) from December 2004 to April 2005. The lines in e) indicate the edge of the frozen soil layers and the soil between the lines froze.](/cms/asset/ff5a533a-5b8e-414d-b412-7a97bc83710d/tssp_a_670810_o_f0002g.gif)
The maximum snow depth during the whole period was 250 mm () and soil freezing was observed from 24 January 2005. The depth of the frozen soil layer got deeper after soil freezing started (); the maximum depths of the frozen layers were observed in March and were 370, 230, 220, 220, 340, and 350 mm at C2, CG, G2s, G2c, G2n, and G3, respectively. The frozen soils were very hard during the freezing period due to the saturated soil conditions caused by high soil water content before freezing (water-filled pore space was 72, 92, 79, 81, 82 and 79% at C2, CG, G2s, G2c, G2n, and G3, respectively) and also by water supply from rainfall and melted snow when air temperature increased above 0°C. Soil thawing was observed from 24 March 2005 at both the soil surface and the bottom of the frozen layers (). Frozen soil layers were not observed after 19 April 2005 at all sites.
N2O and NO fluxes
N2O emissions during the thawing period were much higher than the emissions during other periods (). During the thawing period, fluxes at all sites showed three patterns: (i) remarkably high N2O emissions were observed at C2 and CG; (ii) N2O emissions increased through the transition and thawing periods at G2s, G2c, and G3, and the fluxes at those sites were much lower than fluxes at C2 and CG; and (iii) N2O peaks were observed during the transition and thawing periods and high N2O uptake (negative N2O flux) was also observed at G2n. N2O emissions were also observed during the unfreezing and freezing periods at all sites and were higher at C2 than at the other sites (), but the emissions were lower during the freezing period than during the thawing period.
During the study period, NO emissions at all sites showed a similar temporal variation: low NO emissions were observed at the beginning of the transition period and higher NO emissions were observed during the latter part of the transition and thawing periods (). NO emissions were also observed at all sites during the unfreezing and freezing periods as well as during the thawing period (). However, while NO emissions were observed during the whole observation period, the emission level was much lower than N2O ().
N2O-N/NO-N values during the unfreezing and freezing periods were lower than during the thawing period (). The values were distributed from 2.0 to 13.6 except at C2 during the unfreezing period. The highest value at C2 during the unfreezing was 69.8. During the thawing period, higher N2O-N/NO-N was observed at C2 than at the other sites and the highest value at C2 was 151. The values at the other sites were distributed from 8.5 to 63.3 during the thawing period. The temporal variation of N2O-N/NO-N was similar to that of N2O at C2, CG, G2s, and G2c (, d). At G2n and G3, there was no apparent pattern due to few samples and negative N2O emissions.
Soil N2O concentrations
During the freezing and transition periods, N2O concentrations increased in the frozen soils and were higher during those periods than during the unfreezing and thawing periods at all sites except G2c, where gas samples in the frozen soil could not be collected (). The highest N2O concentrations were observed in the frozen soils during the transition period at all the sites except G2c. N2O concentrations also increased in the unfrozen soil layers below the frozen layers at C2, CG, G2s and G2n, but, the concentrations in the unfrozen soils were lower than those in the frozen soils (). At G2c and G3, the N2O concentration in the unfrozen soil layers just below the frozen soil layers and at the edge of the frozen soil layers was lower than that of the atmosphere (i.e., approximately 0.3 ppmv).
After the start of soil thawing, N2O concentrations in the thawed and unfrozen layers decreased at C2, CG, G2s and G2n. At G2c and G3, the N2O concentrations increased to and above the level in the atmosphere ().
Soil  -N, -N and DOC concentrations during soil freezing
shows the soil -N,
-N and DOC concentrations during the unfrozen period measured on 08 or 18 December 2004, at the beginning of the thawing period measured on 31 March 2005, and at the end of thawing period measured on 19 April 2005.
Figure 3. Ammonium-nitrogen (-N), nitrate-nitrogen (
-N), and dissolved organic carbon (DOC) concentrations in soil at a 0−50 mm depth at the research sites in the Shizunai Experimental Livestock Farm. Measurements were carried out on 8th (C2, CG and G3) or 18th (G2s, G2c, and G2n) December 2004 before soil freezing, on 31st March 2005 just after the start of soil thawing, and on 19th April 2005 at the end of the thawing period. Paired t-test was used to test for statistically significant differences between the data observed on 8th Dec 2004 and 19th April 2005 for each site. Levels of significance were as follows: *<0.05, **<0.01, ***<0.001.
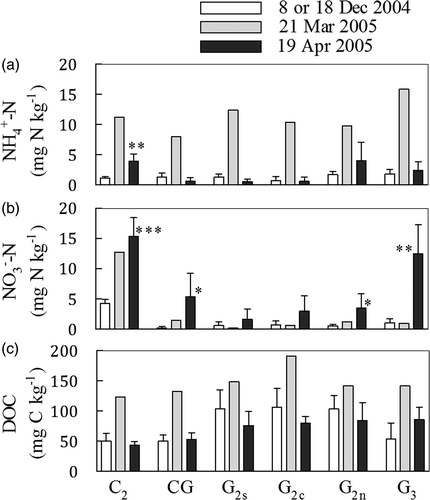
Soil -N values were remarkably high at the beginning of the thawing period compared with the values during the unfreezing period and at the end of the thawing period for all sites (); however, these data couldn’t be statistically compared with the other data. The value at the end of the thawing period (p = 0.004) was significantly higher than before freezing at C2, while there was not a significant difference in the values at the other sites (). The
-N concentration did not show any correlation with slurry + manure N and N surplus, as shown in .
Soil -N values at the beginning of the thawing period were higher than those before the freezing period at C2, CG, and G2n; the values at G2s, G2c and G3 did not show appreciable differences () but these data couldn’t be statistically compared with the other data. The highest
-N concentrations were observed at the end of the thawing period for all sites, and the values at C2, CG, G2n and G3 were significantly higher than those before the freezing period (; the p values were 0.0005, 0.0384, 0.0499, and 0.0034, respectively). The
-N concentration showed a positive correlation with the application rates of slurry + manure N () for all sampling dates (r = 0.9031 and p = 0.0136 on 08 and 18 December 2004, r = 0.9272 and p = 0.0078 on 31 March 2005, and r = 0.9035 and p = 0.0135 on 19 April 2005, respectively).
The soil DOC concentrations measured at the beginning of the thawing period were higher than those measured during the unfreezing period and at the end of the thawing period for all sites (). There was no significant difference between the values for the freezing period and those for the end of the thawing period. The DOC concentrations did not show any correlation with slurry + manure N and N surplus.
Denitrification activities
N2O production was significantly lower at C2 and CG, and higher at G3 (p < 0.05); N2O+N2 production was significantly lower at C2 and CG, and higher at G2c and G3 compared with the other sites (). N2O+N2 production was significantly higher than N2O production at G2c and G3 and lower than N2O production at CG (p < 0.05) (). N2O + N2 production was also higher than N2O production at G2s and G2n, but it was not significant because of the high standard deviation (). The ratio of N2O/(N2O+N2) was lower at G2s, G2c, G2n and G3 than at C2 and CG (). A regression analysis of N2O and N2O + N2 productions and the amount of manure + slurry N and surplus N was also conducted, but the results did not show any relationship.
Table 4. Nitrous oxide (N2O) and N2O + dinitrogen (N2) fluxes and N2O/(N2O+N2) ratio measured by denitrification enzyme activity in soils collected from the study site at Shizunai Experimental Livestock Farm just after the soil thawing on 31 March 2005
DISCUSSION
N2O production and accumulation in frozen soil during the freezing and transition periods
During the freezing period, production and accumulation of N2O in the frozen soils resulted from inhibition of gas diffusion by the frozen soil lids and from N2O reduction to N2. Higher N2O concentrations in the soils, relative to the atmosphere (), indicated N2O accumulation in the soils and disturbance of gas exchange by the frozen saturated soil, which functioned as a “lid” for all the sites. In the soil layers, the highest N2O concentration was observed in frozen rather than unfrozen soils (); this indicated that higher N2O production and/or lower N2O reduction occurred in the frozen soils compared to unfrozen soils and that the produced or remaining N2O in the frozen soils accumulated there. The results show that N2O production occurs in the frozen soil in situ as well as in a laboratory (Christensen and Christensen Citation1991; Müller et al. Citation2002; Yanai et al. 2004 a and b; Öquist et al. 2004; Öquist et al. 2007), and support the hypothesis of Teepe et al. (Citation2001) and Wagner-Riddle et al. (Citation2007) that N2O is produced and trapped in frozen soils during a freezing period.
Denitrification was identified as an important N2O production process in the frozen soils, as demonstrated by the higher-than-one ratio of N2O-N/NO-N during the freezing period (). Lipschultz et al. (Citation1981) reported that the N2O-N/NO-N ratio is considered an indicator of the contribution of nitrification and denitrification; when N2O-N/NO-N is less than one, the main process of N2O production is considered to be nitrification. Alternatively, when N2O-N/NO-N is larger than 100, the main process of N2O production is considered to be denitrification. The lid mentioned before must disturb O2 diffusion from the atmosphere into the soils, and O2 concentration in the soils must be low during the freezing period. Under such conditions, nitrification must be restrained by deficiency of O2 as an electron acceptor, and N2O production by denitrification would be accelerated. Yanai et al. (Citation2011) observed an increase in N2O concentration corresponding with a decrease in O2 concentration in frozen soil during freezing and thawing periods, and Wrage et al. (Citation2001) reported that low O2 concentration inhibited N2O reduction to N2.
Nitrate, which is a substrate of denitrification, was supplied from slurry and manure, because application rates of slurry + manure N () showed a positive correlation with -N on all the sampling dates.
-N concentrations were higher in the surface soils just after thawing than before freezing (); this indicates that
, which is a substrate of nitrification, was supplied through mineralization during the freezing period and high
-N was caused by the nitrification activity. The source of the
was not determined in this study. However, it would likely be the applied slurry and manure, soil organic matter (McGarity Citation1962; Groffman and Tiedje Citation1989; Neilson et al.
Citation2001), destructed microbes or substrates from destructed microbes (McGarity Citation1962; Groffman and Tiedje Citation1989; Schimel and Clein Citation1996; Yanai et al. 2004 a). Yanai et al. (2004 b) evaluated the nitrification potential of frozen soils and reported that a decrease in microbial biomass after freeze-thaw cycles was less substantial and that the nitrification potential was not inhibited by the soil freeze-thaw cycles. Neilson et al. (Citation2001) reported that soil freezing did not disturb nitrification. The nitrification process would also produce N2O, but Mørkved et al. (Citation2006) observed a low contribution of nitrification: N2O produced through nitrification was −0.7% to 4.35% of N2O emissions during the thawing period.
N2O production and emission during the thawing period
High N2O emissions during the thawing period were caused by diffusion of accumulated N2O after disappearance of the frozen soil lids, and a low N2O reduction rate during the thawing period. At C2 and CG, higher N2O concentrations in the surface soils were observed during the freezing and transition periods, and high N2O emissions were observed during the thawing period after disappearance of the frozen soil lid (). However, the denitrification activity was much lower and N2O/(N2O+N2) was much higher at those sites compared with other sites (). From these results, it is evident that the accumulated N2O was not reduced to N2 by denitrification activity, and high N2O emissions were caused by the high N2O concentration in soils and the high gas diffusion coefficients () at the sites. Compared with the N2O emissions at C2 and CG, N2O emissions at G2s and G3 were much lower, even though N2O concentrations in the surface soils were high (). The low emissions must be attributed to high denitrification activities, which reduced N2O to N2 and resulted in low N2O/(N2O+N2) (). The low gas diffusion coefficient at the sites () would also accelerate N2O reduction to N2 before the emission. The N2O concentration in the frozen soil at G2c was not clear, but the low N2O emissions during the thawing period would be attributed to the same reason as G2s and G3; the N2O profile (), the low gas diffusion coefficient (), the high denitrification activity and the low N2O/(N2O+N2) () at G2 were similar to the values at G3. At G2n, low N2O emissions as well as N2O uptake were observed during the thawing period (). This would be caused by a relatively low N2O concentration in the frozen soil () and high denitrification activity (). In a soil column experiment, Teepe et al. (Citation2001) and Wagner-Riddle et al. (Citation2007) showed that N2O trapped in frozen soil was released during a thawing period, which is consistent with our findings.
N2O produced through nitrification and denitrification during the thawing period would also contribute to the N2O emissions during the period, but the contribution must be low at the sites. The N2O-N/NO-N values above one resulted from an increase in N2O emissions during the thawing period () and indicated a low contribution of nitrification. The contribution of denitrification to N2O emissions was considered from the results, but high denitrification activity decreased N2O to N2 in the sites. Therefore, the contribution of N2O production through denitrification during the thawing period would be low. Nitrification and the diffusion of accumulated N2O was the main source of N2O emissions during the period.
CONCLUSION
N2O produced through denitrification activity during the freezing and transition periods accumulated in the frozen soils; this resulted from inhibition of N2O diffusion by frozen soil lids and from N2O reduction to N2. N2O emissions during the thawing period were caused by diffusion of the accumulated N2O in the surface soil. During the thawing period, the contribution of N2O produced by nitrification and denitrification to the emissions was low at the study sites.
tssp_a_670810_sup_25267154.pdf
Download PDF (569.8 KB)ACKNOWLEDGMENTS
We thank Dr. H. Hata and the staff of the Shizunai Experimental Livestock Farm, Field Science Center, Hokkaido University, for their assistance. We thank Dr. M. Shimizu of the Soil Science Laboratory and Miss Y. Usui of the New Energy and Industrial Technology Development Organization for their assistance with our sampling. We also thank Dr. Y. Yanai of the National Agriculture and Food Research Organization (NARO), National Institute of Vegetable and Tea Science (NIVTS), for his helpful comments.
This study was partially supported by a special research grant provided by the project entitled “Establishment of good practices to mitigate greenhouse gas emissions from Japanese grasslands” funded by the Japan Racing Horse Association.
Related Research Data
REFERENCES
- Bremner , JM , Robbins , SG and Blackmer , AM . 1980 . Seasonal variability in emission of nitrous oxide from soil . Geophys. Res. Lett. , 7 : 641 – 644 .
- Burton , DL and Beauchamp , EG . 1994 . Profile nitrous oxide and carbon dioxide concentrations in a soil subject to freezing . Soil Sci. Soc. Amer. J. , 58 : 115 – 122 .
- Christensen , S and Christensen , BT . 1991 . Organic matter available for denitrification in different soil fractions: effect of freeze/thaw cycles and straw disposal . J. Soil Sci. , 42 : 637 – 647 .
- Crutzen , PJ . 1970 . The influence of nitrogen oxides on the atmospheric ozone content . Quart. J. Roy. Meteorol. Soc. , 96 : 320 – 325 .
- Denman , KL , Brasseur , G and Chidthaisong , A . et al. 2007: Couplings between changes in the climate system and biogeochemistry. In Climate Change 2007: The Physical Science Basis. Contribution of Working Group I to the Fourth Assessment Report of the Intergovernmental Panel on Climate Change. Eds. Solomon SD, Qin M, Manning Z, Chen M, Marquis KB, Averyt MT, Miller HL, pp. 544–546. Cambridge University Press, Cambridge, UK and New York
- Flessa , H , Dörsch , P and Beese , F . 1995 . Seasonal variation of N2O and CH4 fluxes in differently managed arable soils in southern Germany . J. Geophys. Res. , 100 : 23115 – 23124 .
- Food and Agriculture Organization of the United Nations (FAO) 1988: Revised Legend of the FAO-UNESCO Soil Map of the World. FAO, Rome, pp. 119
- Goossens , A , Visscher , AD , Boeckx , P and Cleemput , OV . 2001 . Two-year field study on the emission of N2O from coarse and middle-textured Belgian soils with different land use . Nutr. Cycl. Agroecosyst. , 60 : 23 – 34 .
- Groffman , PM and Tiedje , JM . 1989 . Denitrification in north temperate forest soils: Spatial and temporal patterns at the landscape and seasonal scales . Soil Biol. Biochem. , 21 : 613 – 620 .
- Kaiser , E-A , Kohrs , K , Kucke , M , Schnug , Munch , JC and Heinemeyer , O . 1998 . Nitrous oxide release from arable soil: importance of perennial forage crops . Biol. Fert. Soils , 28 : 36 – 43 .
- Kaiser , E-A and Ruser , R . 2000 . Nitrous oxide emissions from arable soils in Germany: An evaluation of six long-term field experiments . J. Plant Nutr. Soil Sci. , 163 : 249 – 260 .
- Katayanagi , N , Sawamoto , T , Hayakawa , A and Hatano , R . 2008 . Nitrous oxide and nitric oxide fluxes from cornfield, grassland, pasture and forest in a watershed in Southern Hokkaido, Japan . Soil Sci. Plant Nutr. , 54 : 662 – 680 .
- Koga , N , Tsuruta , H , Sawamoto , T , Nishimura , S and Yagi , K . 2004 . N2O emission and CH4 uptake in arable fields managed under conventional and reduced tillage cropping systems in northern Japan . Global Biogeochem. Cycles , 18 : GB4025
- Lipschultz , F , Zafirou , OC , Wofsy , SC , McElroy , MB , Valois , FW and Watson , SW . 1981 . Production of NO and N2O by soil nitrifying bacteria . Nature , 294 : 641 – 643 .
- Lowrance , R . 1992 . Groundwater nitrate and denitrification in a coastal plain riparian forest . J. Environ. Qual. , 21 : 401 – 405 .
- Ludwig , B , Wolf , I and Teepe , R . 2004 . Contribution of nitrification and denitrification to the emission of N2O in a freeze-thaw event in an agricultural soil . J. Plant Nutr. Soil Sci. , 167 : 678 – 684 .
- McGarity , JW . 1962 . Effect of freezing of soil on denitrification . Nature , 196 : 1342 – 1343 .
- Mørkved , PT , Dörsch , P , Henriksen , TM and Bakken , LR . 2006 . N2O emissions and product ratios of nitrification and denitrification as affected by freezing and thawing . Soil Biol. Biochem. , 38 : 3411 – 3420 .
- Mosier , AR . 1998 . Soil processes and global change . Biol. Fertil. Soils , 27 : 221 – 229 .
- Müller , C , Martin , M , Stevens , RJ , Laughlin , RJ , Kammann , C , Ottow , JCG and Jäger , H-J . 2002 . Processes leading to N2O emissions in grassland soil during freezing and thawing . Soil Biol. Biochem. , 34 : 1325 – 1331 .
- Murray , RE and Knowles , R . 1999 . Chloramphenicol inhibition of denitrifying enzyme activity in two agricultural soils . Appl. Environ. Microbiol. , 65 : 3487 – 3492 .
- Neilson , CB , Groffman , PM , Hamburg , SP , Driscoll , CT , Fahey , TJ and Hardy , JP . 2001 . Freezing effects on carbon and nitrogen cycling in northern hardwood forest soils . Soil Sci. Soc. Amer. J. , 65 : 1723 – 1730 .
- Öquist , MG , Nilsson , M , Sörensson , F , Kasimir-Klemedtsson , A , Persson , T , Weslien , P and Klemedtsson , L . 2004 . Nitrous oxide production in a forest soil at low temperatures - processes and environmental controls . FEMS Microbiol. Ecol. , 49 : 371 – 378 .
- Öquist , MG , Petrone , K , Nilsson , M and Klemedtsson , L . 2007 . Nitrification controls N2O production rates in a frozen boreal forest soil . Soil Biol. Biochem. , 39 : 1809 – 1811 .
- Osozawa , S . 1998 . A simple method for determining the gas diffusion coefficient in soils and its application to soil diagnosis and analysis of gas movement in soil . Bulletin NIAES , 15 : 1 – 66 . (in Japanese with English summary)
- Regina , K , Syvasalo , E , Hannukkala , A and Esala , M . 2004 . Fluxes of N2O from farmed peat soils in Finland . Eur. J. Soil Sci. , 55 : 591 – 599 .
- Rolston , DE . 1986: Gas flux. In Methods of Soil Analysis Part 1: Physical and Mineralogical Methods, 2nd ed. Ed. Klute A, pp. 1103–1119. American Society of Agronomy, Madison
- Röver , M , Heinemeyer , O and Kaiser , E-A . 1998 . Microbial induced nitrous oxide emissions from an arable soil during winter . Soil Biol. Biochem. , 30 : 1859 – 1865 .
- Ruser , R , Flessa , H , Schilling , R , Beese , F and Munch , JC . 2001 . Effect of crop-specific field management and N fertilization on N2O emissions from a fine-loamy soil . Nutr. Cycl. Agroecosyst. , 59 : 177 – 191 .
- Sahrawat , KL and Keeney , DR . 1986 . Nitrous oxide emission from soils . Adv. Soil Sci. , 4 : 103 – 148 .
- Schimel , JP and Clein , JS . 1996 . Microbial response to freeze-thaw cycles in tundra and taiga soils . Soil Biol. Biochem. , 28 : 1061 – 1066 .
- Sehy , U , Ruser , R and Munch , JC . 2003 . Nitrous oxide fluxes from maize fields: relationship to yield, site-specific fertilization, and soil conditions . Agr Ecosyst. Environ. , 99 : 97 – 111 .
- Syvasalo , E , Regina , K , Pihlatie , M and Esala , M . 2004 . Emissions of nitrous oxide from boreal agricultural clay and loamy sand soils . Nutr. Cycl. Agroecosyst. , 69 : 155 – 165 .
- Teepe , R , Brumme , R and Beese , F . 2000 . Nitrous oxide emissions from frozen soils under agricultural, fallow and forest land . Soil Biol. Biochem. , 32 : 1807 – 1810 .
- Teepe , R , Brumme , R and Beese , F . 2001 . Nitrous oxide emissions from soil during freezing and thawing periods . Soil Biol. Biochem. , 33 : 1269 – 1275 .
- Tiedje , JM . 1994: Denitrifiers. In SSSA Book Series 5, Methods of Soil Analysis. Part 2: Microbiological and Biochemical Properties. Appl. Environ. Microbiol., Eds. Weaver RW, Angle S, Bottomley P,. pp. 245–257. SSSA, Madison, WI
- Wagner-Riddle , C , Furon , A , Mclaughlin , NL , Lee , I , Barbeau , J , Jayasundara , S , Parkin , G , Von Bertoldi , P and Warl , J . 2007 . Intensive measurement of nitrous oxide emissions from a corn-soybean-wheat rotation under two contrasting management systems over 5 years . Glob. Change Biol. , 13 : 1722 – 1736 .
- Wagner-Riddle , C , Hu , QC , van Bochove , E and Jayasundara , S . 2008 . Linking nitrous oxide flux during spring thaw to nitrate denitrification in the soil profile . Soil Sci. Soc. Amer. J. , 72 : 908 – 916 .
- Wagner-Riddle , C , Thurtell , GW , Kidd , GK , Beauchamp , EG and Sweetman , R . 1997 . Estimates of nitrous oxide emissions from agricultural fields over 28 months . Can. J. Soil Sci. , 77 : 135 – 144 .
- Wrage , N , Velthof , GL , van Beusichem , ML and Oenema , O . 2001 . Role of nitrifier denitrification in the production of nitrous oxide . Soil Biol. Biochem. , 33 : 1723 – 1732 .
- Yanai , Y , Hirota , T , Iwata , Y , Nemoto , M , Nagata , O and Koga , N . 2011 . Accumulation of nitrous oxide and depletion of oxygen in seasonally frozen soils in northern Japan: Snow cover manipulation experiments . Soil Biol. Biochem. , 43 : 1779 – 1786 .
- Yanai , Y , Toyota , K and Okazaki , M . 2004a . Effects of successive soil freeze-thaw cycles on soil microbial biomass and organic matter decomposition potential of soils . Soil Sci. Plant Nutr. , 50 : 821 – 829 .
- Yanai , Y , Toyota , K and Okazaki , M . 2004b . Effects of successive soil freeze-thaw cycles on nitrification potential of soils . Soil Sci. Plant Nutr. , 50 : 831 – 837 .
SUPPLEMENTARY MATERIAL
The supplementary material for this article is available online from: http://dx.doi.org/10.1080/00380768.2012.670810.