Abstract
Estimating carbon (C) and nitrogen (N) stocks in deadwood in forests nationwide is required for understanding large-scale C and N cycling. To do so requires estimated values of wood density and C and N concentrations. Additionally, parameters that show variation should be examined. In this study, we clarified the estimated values and the variation in three parameters in each decay class of each of two tree species and examined whether dead log diameter and region contribute to variation in the parameters. Data were collected from 73 Chamaecyparis obtusa (Sieb. et Zucc.) Endl. plantations and 66 Cryptomeria japonica D. Don plantations throughout Japan. Wood densities decreased from 386 to 188 kg m−3 for C. obtusa and from 334 to 188 kg m−3 for C. japonica in decay classes 1–4. The variation in wood density increased with decay class, and the coefficient of variance increased from 13.9% to 46.4% for C. obtusa and from 15.2% to 48.1% for C. japonica. The N concentrations increased from 1.04 to 4.40 g kg−1 for C. obtusa and from 1.11 to 2.97 g kg−1 for C. japonica in decay classes 1–4. The variation in N concentration increased with decay class, and the coefficient of variance increased from 51.9% to 76.7% for C. obtusa and from 50.3% to 70.4% for C. japonica. Log diameter and region contributed to variations in wood density and N concentration in decay classes 1 and 2 for C. obtusa and C. japonica. However, no relationship was observed between regional climates and the two parameters. In contrast, C concentrations ranged from 507 to 535 g kg−1 and were stable with much lower coefficients of variance throughout the decay classes for both tree species. Thus, we recommend that the same C concentration can be adapted for all decay classes of both tree species.
Introduction
Deadwood plays several important roles, such as storing nutrients and water, contributing to soil development, and providing habitats for living things, in forest ecosystems. The carbon (C) stock in deadwood is one of the large C pools that contribute to C cycling in forest ecosystems (IPCC Citation2006). Moreover, the nitrogen (N) in deadwood is released at slower rates than fine litter and retained within the ecosystem for a long time, suggesting that deadwood is a pool for slow N circulation (Harmon and Hua Citation1991; Krankina et al. Citation1999; Guo et al. Citation2006; Inagaki et al. Citation2009). Therefore, estimating C and N stocks in deadwood is key to understanding C and N cycling, as well as maintenance mechanisms, within forest ecosystems.
The United Nations Framework Convention on Climate Change requires the ratifying countries of the Kyoto Protocol to report C stocks in deadwood, as it is one of the most important C pools in forested land. Thus, deadwood measurements are included in the national forest inventories of many countries (Köhl et al. Citation2000; Ferretti et al. Citation2009; McRoberts et al. Citation2009; Fahey et al. Citation2010). These data are also valid for the forest sector in Japan (Takahashi et al. Citation2010).
Parameters such as wood density, volume, and C and N concentrations are required to measure C and N stocks in deadwood. In practice, deadwood volume is measured using field surveys. However, wood density and C and N concentrations are estimated values that are determined from other data sets. Thus, the estimated values of wood density and C and N concentrations should be calculated on a national scale to determine nationwide inventories of deadwood C and N stocks. In particular, Chamaecyparis obtusa (Sieb. et Zucc.) Endl. and Cryptomeria japonica D. Don are planted throughout forests in Japan, and these two species cover almost 40% of all private planted land (Forestry Agency Citation2009). Therefore, the estimated values of wood density and C and N concentrations of these two species were examined.
An estimated value of each parameter is prepared for each decay class (typically five classes are used to categorize deadwood properties) for each tree species (Graham and Cromack Citation1982; Sollins et al. Citation1987; Harmon et al. Citation1995; Skovsgaard et al. Citation2006). The decay class is a classification system for identifying and categorizing decay states and is correlated with the decrease in wood density as the decomposition process progresses (Harmon et al. Citation1986; Harmon et al. Citation2008; Larjavaara and Muller-Landau Citation2010). The tree species determines the differences in initial wood density, wood tissue structure, and chemical composition (Zabel and Morrell Citation1992). Indeed, Yatskov et al. (Citation2003) reported that decay class, tree species, and their interaction explain 81.2% (68.0%, 6.1%, and 7.1%, respectively) of the variation in changes in deadwood density in Russian boreal forests. Thus, the value of each parameter should be estimated by decay class for C. obtusa and C. japonica. Additionally, these variations result in estimated C and N stock errors. Thus, variations in these parameters should be clarified for each decay class of the two species.
The estimated errors of C and N stocks can be predicted if the structure of variation in the three parameters in each decay class of the two species is known. Wood density and C and N concentrations vary within the same class due to the heterogeneous progression of deadwood decomposition (Pyle and Brown Citation1999). As factors contributing to heterogeneous deadwood density, Yatskov et al. (Citation2003) indicated that deadwood size and region explain 1.1% and 0.9%, respectively, of the total variation in deadwood density in boreal forests. Log diameter is related to initial wood conditions, such as fresh wood density (Fearnside Citation1997; Fujiwara et al. Citation2004) and N concentration (Meerts Citation2002). Thus, wood density and N concentrations will likely vary with deadwood size. Regional climate influences the deadwood decay process, and the wood density in a given decay class may differ among regions even for the same plantation species (Yatskov et al. Citation2003; Harmon et al. Citation2008). Therefore, we examined the effects of both region and log diameter on variations in wood density and the C and N concentrations within each decay class of each of our study tree species.
The objectives of our study were to clarify estimated values of wood density and C and N concentrations, as well as variations in each decay class, for C. obtusa and C. japonica and to examine the contribution of region and dead log diameter to variation in the parameters of each decay class of the two species. To achieve these objectives, we sampled fallen logs produced by noncommercial thinning in C. obtusa and C. japonica plantations throughout Japan, measured the wood density and C and N concentrations, and analyzed their estimated values and variation, as well as the relationship with region and dead log diameter.
Materials and Methods
Study sites
We randomly selected planted forests that had been thinned and that contained fallen logs for which the thinning year had been recorded, resulting in the inclusion of 66 C. obtusa plantations in six prefectures and 73 C. japonica plantations in another six prefectures (hereafter called “regions”). The fallen logs produced by thinning had been left whole on the forest floor in some cases or had been cross cut into short lengths in other cases. The regions were distributed from northern to southern areas of Japan and covered most climate conditions (). The respective annual temperatures in the studied forests of C. obtusa and C. japonica were 8.5–16.0°C and 7.4–15.5°C, annual precipitation amounts were 1150–2682 mm and 1284–2837 mm, and maximum snow depths were 1–186 cm and 2–205 cm (). We established a 10 × 10-m quadrat as a representative forest floor in each plantation for fallen log sampling. Detailed information about the study sites was presented in Sakai et al. (Citation2008).
Figure 1. Locations of the sampling prefectures for Chamaecyparis obtusa (Sieb. et Zucc.) Endl. (squares) and Cryptomeria japonica D. Don (circles).
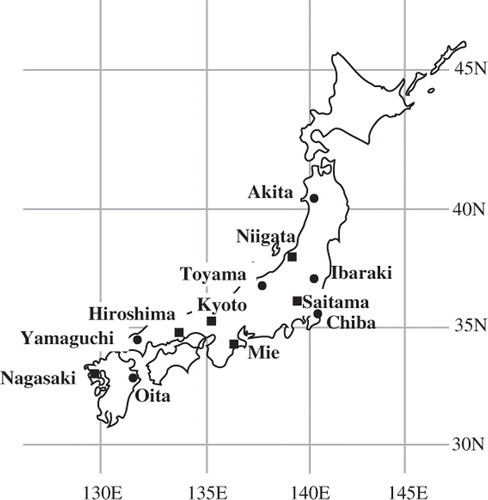
Table 1. Location, management history, and climate conditions of the study stands in 12 prefectures
Methods
All fallen logs with diameters >5 cm were classified into four diameter classes (5–10, 10–15, 15–20, 20–40 cm) in each quadrat. In each diameter class, three to five fallen logs were collected randomly when three or more logs were present, and all logs were collected when fewer than three logs were present. A disk was cut from a random location on each fallen log within the range of the diameter class using a chain saw or a hand saw. Disks of 10–15 cm in thickness were cut from logs 5–10 cm in diameter, and disks of 3–8 cm in thickness were cut from logs >10 cm in diameter. For C. obtusa, we sampled 60–218 disks of fallen logs in each region and collected 635 disks in total. For C. japonica, we sampled 76–297 fallen logs in each region and collected 893 disks (Appendix 1). All samples were collected between July 2005 and February 2006.
We categorized all fallen logs into five decay classes based on their appearance using the criteria outlined in (Graham and Cromack Citation1982). Samples were cut transversely into disks and diameter and thickness were measured to calculate wood density. Each sample disk was oven-dried at 70°C to a constant weight and then weighed. The sample volume (m3) was calculated using Equation Equation1 (Smalian's formula; Oh-uchi Citation1989):
Table 2. Criteria determining the decay classes of fallen logs
For measurements of C and N concentrations, we selected 437 samples that were representative of the average wood density of each diameter class of a stand: 5–10, 10–15, 15–20, and 20–40 cm (Appendix 1). Each disk was ground into fine particles (<0.25 mm in diameter) using a cutting mill (Pulverisette 14; Fritsch GmbH, Idar-Oberstein, Germany). In cases of larger diameter disks, before the grinding, a wedge considering proportion of sapwood to heartwood were taken from each disk. Concentrations of C and N were measured using the dry combustion method with an NC analyzer (Vario MAX CN; Elementar Analysensysteme GmbH, Hanau, Germany).
Statistical analysis
Differences in parameters (wood density and C and N concentrations) among decay classes and between tree species were analyzed using a generalized linear model (GLM) with Gaussian errors (i.e., two-way analysis of variance; Equation Equation2). Decay class and tree species were used as categorical variables. The parameters were also compared between pairs of decay classes and tree species using Tukey's honestly significant difference test. However, decay class 5 and decay classes 4 and 5 were excluded from the analyses of wood density and C and N concentrations, respectively, due to insufficient sample sizes (Appendix 1).
To evaluate the contribution of region and deadwood size to variations in the parameters of each decay class and tree species, we analyzed the differences in parameters among regions and log diameters using a generalized linear model (GLM) with Gaussian errors (i.e., analysis of covariance; Equation Equation3). The regions were considered categorical variables. A few regions with no or one measurement in each decay class were excluded from the GLM analysis; these included wood density for one region in decay class 3 and three regions in decay class 4, and C and N concentrations for three regions in decay class 3 (see Table S1). We did not use log diameter classes as variables in the analysis, but included the measured values of all samples in a continuous log diameter variable.
We determined the significance of explanatory variables using randomization tests in all GLMs, as some samples were collected from the same stand and were not statistically independent of each other. The F-value distribution was determined by calculating the F-values for fixed effects 10,000 times using randomizations of the response variable (i.e., each parameter). The significance level was determined by comparing the actual F-value to the prepared distribution of F-values. All statistical analyses were conducted using R 2.13.2 (R Development Core Team 2011). A P-value <0.05 was considered significant.
Results
Wood density
The wood density values (mean ± standard deviation) of C. obtusa were 386 ± 54, 302 ± 58, 212 ± 87, and 188 ± 88 kg m−3 in decay classes 1–4, respectively (). For C. japonica, the respective wood density values were 334 ± 51, 270 ± 61, 198 ± 62, and 188 ± 91 kg m–3. The coefficient of variance increased from decay class 1 to 4: 13.9%, 19.4%, 40.9%, and 46.4% for C. obtusa and 15.2%, 22.4%, 31.4%, and 48.1% for C. japonica, respectively. Wood density varied significantly among decay classes (P < 0.001) and between tree species (P < 0.001; ). A significant interaction between decay class and tree species was also detected (P = 0.001; ). Wood density decreased significantly from decay class 1 to 3 for C. obtusa (P < 0.001) and C. japonica (P < 0.001; ). However, the standard deviation became larger from decay class 3 to 4 for both tree species, resulting in no significant difference between decay classes 3 and 4 (C. obtusa, P = 0.520; C. japonica, P = 0.906). C. obtusa wood density was significantly higher than that of C. japonica in decay classes 1 (P < 0.001) and 2 (P < 0.001).
Figure 2. Wood density of fallen logs of Chamaecyparis obtusa (Sieb. et Zucc.) Endl. (squares) and Cryptomeria japonica D. Don (circles) in decay classes 1–4. Bars are standard deviations. Different letters indicate significant differences (P < 0.05).
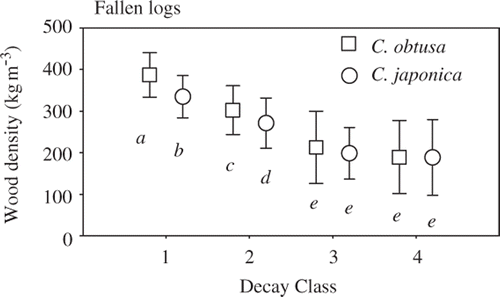
Table 3. Results of a two-way analysis of variance for the wood density of fallen logs by decay class and tree species, and their interaction
Region significantly affected wood density in all C. obtusa decay classes (P ≤ 0.018; ). A significant effect for C. japonica was detected in decay classes 1–3 (P ≤ 0.032). Log diameter significantly affected wood density in C. obtusa decay classes 1 and 2 (P ≤ 0.001) and C. japonica decay classes 1 and 2 (P ≤ 0.046; ). Additionally, a significant interaction between region and log diameter was detected in decay class 4 (P = 0.011) for C. obtusa. In decay classes 1–3 for C. obtusa and C. japonica, the mean wood density showed little tendency to correlate with annual temperature and annual precipitation of the regions (see Fig. S1). Wood density decreased with log diameter, especially in decay class 1 ().
Figure 3. Wood density of fallen logs changed with log diameter in decay class 1 (filled circles), decay class 2 (open circles) and decay class 3 (triangles) of Chamaecyparis obtusa (Sieb. et Zucc.) Endl. and Cryptomeria japonica D. Don.
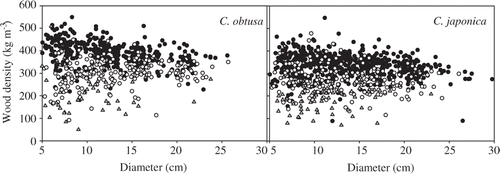
Table 4. Results of an analysis of covariance for the wood density of fallen logs by region and log diameter, and their interaction, in each decay class and tree species
Carbon concentration
The C. obtusa C concentrations (mean ± sample standard deviation) were 518 ± 11, 527 ± 7, 535 ± 17, and 527 ± 9 g kg−1 in decay classes 1–4, respectively (). The respective values of C concentration for C. japonica were 513 ± 16, 507 ± 14, 511 ± 14, and 527 ± 13 g kg−1. The coefficients of variance in C concentration were small compared to those of wood density: 2.1%, 1.4%, 3.2%, and 1.6% for C. obtusa, and 3.1%, 2.8%, 2.8%, and 2.5% for C. japonica in order of decay classes. Carbon concentration varied significantly among decay classes (P = 0.005; ) and between tree species (P < 0.001). A significant interaction between decay class and tree species was also observed (P < 0.001). Carbon concentrations in C. obtusa increased significantly with progression from decay class 1 to 3 (decay classes 1 and 2, P < 0.001; decay classes 2 and 3, P = 0.043; ). Carbon concentrations differed significantly for C. japonica between decay classes 1 and 2 (P = 0.004) and between decay classes 3 and 4 (P = 0.040). C. obtusa exhibited significantly higher C concentrations than C. japonica for decay classes 1–3 (decay class 1, P = 0.003; decay class 2, P < 0.001; decay class 3, P < 0.001).
Figure 4. Fallen log carbon concentrations of Chamaecyparis obtusa (Sieb. et Zucc.) Endl. (squares) and Cryptomeria japonica D. Don (circles) in decay classes 1–4. Bars are sample standard deviations. Different letters indicate significant differences (P < 0.05).
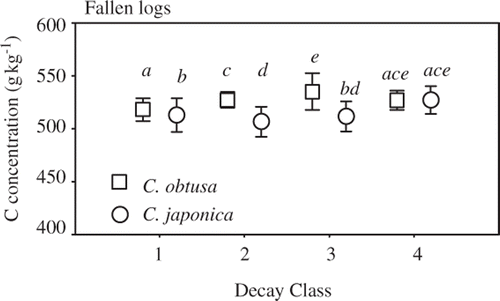
Table 5. Results of a two-way analysis of variance for the carbon concentrations of fallen logs by decay class and tree species, and their interaction
Region significantly affected C concentration in C. obtusa decay class 1 (P < 0.001) and in all decay classes of C. japonica (P < 0.001; ). Log diameter significantly affected C concentration in C. obtusa decay class 1 (P < 0.001) and in C. japonica decay classes 1 (P < 0.001) and 2 (P < 0.001; ). Mean C concentrations in all decay classes of both tree species showed little tendency to correlate with annual regional temperature and precipitation (see Fig. S2). Carbon concentrations increased with log diameter in all decay classes of both species, but this tendency was not clear ().
Figure 5. Concentrations of (a) carbon and (b) nitrogen changed with diameter in decay class 1 (filled circles), decay class 2 (open circles) and decay class 3 (triangles) of Chamaecyparis obtusa (Sieb. et Zucc.) Endl. and Cryptomeria japonica D. Don.
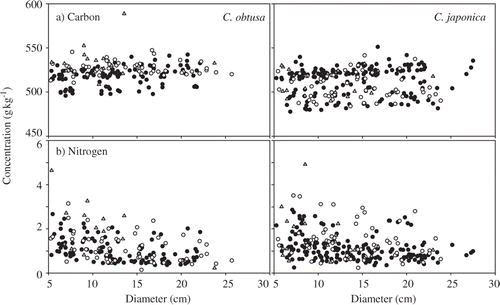
Table 6. Results of an analysis of covariance for the carbon concentrations of fallen logs by region and log diameter, and their interaction, in each decay class and tree species
Nitrogen concentration
The N concentrations (mean ± standard deviation) of C. obtusa were 1.04 ± 0.54, 1.17 ± 0.64, 1.84 ± 1.16, and 4.40 ± 2.32 g kg−1 in decay classes 1–4, respectively (). The respective N concentration values for C. japonica were 1.11 ± 0.56, 1.43 ± 0.80, 1.52 ± 1.04, and 2.97 ± 2.10 g kg−1 (). The N concentration coefficients of variance were high compared to those of wood density and were highest in decay class 4: 51.9%, 54.3%, 62.9%, and 76.7% for C. obtusa and 50.3%, 56.1%, 68.2%, and 70.4% for C. japonica in order of decay classes. Nitrogen concentrations differed significantly among decay classes (P < 0.001; ), and the interaction between decay class and tree species was also significant (P = 0.007). In both species, N concentrations increased dramatically from decay class 3 to 4 (C. obtusa, P < 0.001; C. japonica, P = 0.003), although N concentrations in decay class 4 had a large standard deviation. In contrast, the increase in N concentration from decay class 1 to 3 was smaller than that from decay class 3 to 4.
Figure 6. Fallen log nitrogen concentrations of Chamaecyparis obtusa (Sieb. et Zucc.) Endl. (squares) and Cryptomeria japonica D. Don (circles) in decay classes 1–4. Bars are sample standard deviations. Different letters indicate significant differences (P < 0.05).
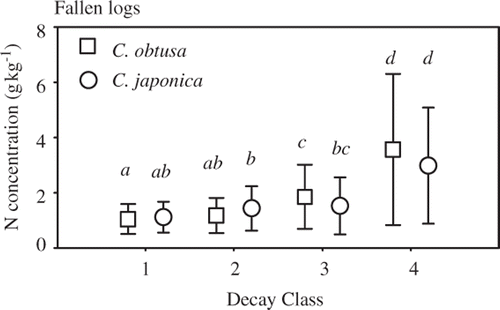
Table 7. Results of a two-way analysis of variance for the nitrogen concentrations of fallen logs by decay class and tree species, and their interaction
Region significantly affected N concentration in decay classes 1 and 2 for both C. obtusa and C. japonica (decay class 1, P < 0.001; decay class 2, P < 0.001; ). Log diameter also significantly affected N concentration in decay classes 1 (P < 0.001) and 2 (P < 0.001; ). Additionally, a significant interaction between region and log diameter was observed in C. obtusa decay class 2 (P = 0.033). Nitrogen concentrations were not related to annual regional temperature and precipitation (see Fig. S2). The N concentrations showed large variations but decreased with log diameter ().
Table 8. Results of an analysis of covariance for the nitrogen concentrations of fallen logs by region and log diameter, and their interaction, in each decay class and tree species
Discussion
Wood density
As decay progressed, the mean wood densities of fallen logs decreased while the variation in wood density increased (), indicating that heterogeneity in the decay process leads to larger variation in wood density later in decomposition.
The large variation in wood density late in the decay process resulted in no difference between the two study species in the late decay classes (). In contrast, wood density differed between C. obtusa and C. japonica in the early decay classes (). These findings indicate that tree species identity is essential in the early but not in the late decay classes. The difference in wood density between the two species is consistent with that observed for fresh logs (Fujiwara et al. Citation2007). Thus, we suggest that initial wood density affects interspecific differences in wood density in the early decay classes.
In decay classes 1 and 2, variation in wood density was influenced by log diameter (, ). The fresh wood densities of C. obtusa and C. japonica increased with immature wood ratios, which are related to fresh log diameter (Kano Citation1962; Watanabe Citation1978; Minato et al. Citation1989; Fujiwara et al. Citation2004). Therefore, differences in wood maturity may be related to the relationship between wood density and dead log diameter in the early decay classes.
Fujiwara et al. (Citation2007) observed no significant regional effect on C. obtusa and C. japonica fresh wood density. However, wood densities were affected by region in decay classes 1–4 of both species, with the exception of decay class 4 of C. japonica (). Regional variation in environmental conditions such as temperature and moisture may influence the wood structure, species composition, and microbe activity of decomposing deadwood. However, the mean values by region were not clearly related to regional climate parameters, such as annual temperature and precipitation. Thus, the effects of regional climate on initial wood density and the decomposition process may not be important. Further research is needed to clarify the cause(s) of regional differences in wood density, which may include differences in site environments (Yatskov et al. Citation2003; Harmon et al. Citation2008) and local cultivars (Yahata et al. Citation1987; Miyajima Citation1989).
Carbon concentration
Carbon concentrations varied among decay classes, but no consistent pattern was observed (, ). Moreover, the variation in C concentrations among decay classes appeared to be less than that between the two species (see F-values in ).
Carbon concentrations in deadwood were higher for C. obtusa than for C japonica. Strictly speaking, this result suggests that different C concentration parameters should be used for C. obtusa and C. japonica. However, the coefficient of variance was smaller for C concentration than for wood density, and C stock was estimated using not only C concentration, but also wood density. Therefore, the same C concentration can be used to estimate the C stock of both C. obtusa and C. japonica. Given the smaller variation among decay classes than between tree species, we recommend the use of a C concentration of 519 g kg−1, which is the mean value across all decay classes for both tree species.
Variations in C concentration were affected by dead log diameter in decay classes 1 and 2 and by region in decay classes 1–3 (). The mean C concentrations were not related to regional climate, indicating that climate conditions had no effect. Moreover, C concentrations increased with log diameter in all decay classes. However, the variation in C concentrations was small, even within each decay class of each species (). Thus, accounting for dead log diameter and region may not be particularly effective for explaining variation in C concentrations.
Nitrogen concentration
A significant increase in N concentration was observed as logs decayed (), highlighting a general trend in decaying logs (Lambert et al. Citation1980; Palviainen et al. Citation2010). Nitrogen concentrations increased dramatically from decay class 3 to 4, although wood density did not change between these two decay classes (). Thus, we hypothesize that the increase in N concentration was partially caused by fungal N translocation (Hart Citation1999) and bacterial N fixation (Hicks et al. Citation2003), particularly late in the decay process. On the other hand, amounts of N per initial volume (N density) were almost constant from decay class 1 to 4, except decay class 4 of C. obtusa (see Fig. S3). Therefore, the increase in N concentration caused by fungal N translocation (Hart Citation1999) and bacterial N fixation (Hicks et al. Citation2003) may be restricted in the deadwood decay process (Inagaki et al. Citation2009). The high N density of decay class 4 of C. obtusa had a large variation, and further study is needed to confirm the increase.
N concentrations did not differ between the two study species in any decay class (). Therefore, the same N concentration parameter can be used to estimate N stocks in both C. obtusa and C. japonica plantations.
Although we could not analyze factors contributing to N concentration in decay class 4 due to insufficient sample sizes, the variation in N concentration was influenced by dead log diameter and region in decay classes 1 and 2, but not in decay class 3 (). In fresh logs, N concentration varies with the relative proportions of bark and sapwood with higher N concentrations, and heartwood with lower N concentrations (Harada and Sato Citation1966; Meerts Citation2002), which may have led to the association of higher N concentration with smaller dead log diameter in the early decay classes. We also observed a significant effect of region on the variation in N concentrations. However, we found no trend associated with climate conditions such as annual temperature and precipitation. Additionally, the variation in N concentration increased dramatically in the late decay classes (). Thus, we suggest that the variation in N dynamics may be larger among logs than among regions in the late decay process.
Conclusions
Our results show the estimated values and the variation of wood density and C and N concentrations by decay class and tree species. The estimated parameter values can be applied to estimate C and N stocks of deadwood by decay class in C. obtusa and C. japonica plantation forests in Japan. We recommend the consideration of interspecific differences in wood density, but not N concentration, in early decay classes. However, we should recognize that variations in wood density and N concentration increased with decay class and were influenced by region and log diameter. In contrast, we recommend the use of a C concentration of 519 g kg−1 for C. obtusa and C. japonica in Japan, which is the mean value across all decay classes of both tree species, because the variation in C concentrations was small.
In this study, we were not able to collect a sufficient number of fallen logs in decay class 5. In Japan, few deadwood logs decompose into decay class 5 after thinning. Further research should seek to determine the estimated parameters for decay class 5. On the other hand, similar wood density values have been found for decay classes 4 and 5 of softwoods (131–201 and 108–220 kg m−3, respectively) (Laiho and Prescott Citation1999; Yatskov et al. Citation2003; Tobin et al. Citation2007; Harmon et al. Citation2008). Thus, we may be able to apply the wood density value for decay class 4 (188 kg m−3) to deadwood in decay class 5. Moreover, the C concentration of 519 g kg−1 may be used for deadwood in decay class 5 because C concentrations were almost constant during decomposition. Few studies have reported N concentrations in decay classes 4 and 5, prohibiting the use of the N concentration for decay class 4 as that for decay class 5.
The parameter values obtained in the present study enable the estimation of current C and N stocks in deadwood by decay class in C. obtusa and C. japonica plantation forests in Japan. Further studies that estimate decay rates and deadwood inputs are needed to estimate changes in C and N stocks.
tssp_a_710526_sup_28433754.pdf
Download PDF (354 KB)tssp_a_710526_sup_28433752.pdf
Download PDF (49.5 KB)tssp_a_710526_sup_28433758.pdf
Download PDF (453.1 KB)tssp_a_710526_sup_28433759.pdf
Download PDF (319.4 KB)Acknowledgments
This research was funded by the Forestry Agency, Ministry of Agriculture, Forestry and Fisheries, Japan (the Organization Development Project for Measurement and Use of Forest Sinks and the National Forest Soil Carbon Inventory Project). We thank Satoshi Sawata, Yoshitaka Houjyou, Yasuhiko Tamaki, Tamami Shirai, Hiroshi Takeda, Hideharu Aiura, Hiromasa Shimada, Teppei Iwatsuki, Atsushi Yamaba, Takanobu Yamada, Hajime Maeda, and Masamichi Muro for their support during field research. We also thank Dr. Shinji Kaneko and Dr. Mitsuo Matsumoto for their support.
References
- Fahey , TJ , Woodbury , PB , Battles , JJ , Goodale , CL , Hamburg , SP , Ollinger , SV and Woodall , CW . 2010 . Forest carbon storage: ecology, management, and policy . Front. Ecol. Environ. , 8 : 245 – 252 . doi: 10.1890/080169
- Fearnside , PM . 1997 . Wood density for estimating forest biomass in Brazilian Amazonia . For. Ecol. Manage. , 90 : 59 – 87 . doi: 10.1016/S0378-1127(96)03840-6
- Ferretti , M , König , N , Rautio , P and Sase , H . 2009 . Quality assurance (QA) in international forest monitoring programmes: activity, problems and perspectives from East Asia and Europe . Ann. For. Sci. , 66 : 403 doi: 10.1051/forest/2009025
- Forestry Agency 2009: Annual report on trends in forest and forestry in Japan fiscal year 2009. http://www.rinya.maff.go.jp/j/kikaku/hakusyo/21hakusho/pdf/21_e.pdf (January, 2012)
- Fujiwara , T , Yamashita , K and Hirakawa , Y . 2004 . Mean basic density and density variation within individual trees in major plantation species . Bull. FFPRI , 3 : 341 – 348 .
- Fujiwara , T , Yamashita , K and Kuroda , K . 2007 . Basic densities as a parameter for estimating the amount of carbon removal by forests and their variation . Bull. FFPRI , 6 : 215 – 226 .
- Graham , RL and Cromack , JK . 1982 . Mass, nutrient content, and decay rate of dead boles in rain forest of Olympic National Park . Can. J. For. Res. , 12 : 511 – 521 . doi: 10.1139/x82-080
- Guo , LB , Bek , E and Gifford , RM . 2006 . Woody debris in a 16-year old Pinus radiata plantation in Australia: mass, carbon and nitrogen stocks, and turnover . For. Ecol. Manage. , 228 : 145 – 151 . doi: 10.1016/j.foreco.2006.02.043
- Harada , H and Sato , H . 1966 . On the dry matter and nutrient contents of the stem of mature Cryptomeria trees, and their distribution to the bark, sapwood and heartwood . J. Jpn. For. Soc. , 48 : 315 – 324 . (in Japanese with English summary)
- Harmon , ME , Franklin , JF Swanson , FJ . 1986 . Ecology of coarse woody debris in temperate ecosystems . Adv. Ecol. Res. , 15 : 133 – 302 . doi: 10.1016/S0065-2504(08)60121-X
- Harmon , ME and Hua , C . 1991 . Coarse woody debris dynamics in two old-growth ecosystems . BioScience , 41 : 604 – 610 .
- Harmon , ME , Whigham , DF , Sexton , J and Olmsted , I . 1995 . Decomposition and mass of woody detritus in the dry tropical forests of the northeastern Yucatan peninsula, Mexico . Biotropica , 27 : 305 – 316 .
- Harmon , ME , Woodall , CW , Fasth , B and Sexton , J . 2008 . Woody detritus density and density reduction factors for tree species in the United States: a synthesis . Gen. Tech. Rep. USDA For. Serv. Pac. Southwest Res. Stn. , NRS-29 : 1 – 90 .
- Hart , SC . 1999 . Nitrogen transformations in fallen tree boles and mineral soil of an old-growth forest . Ecology , 80 : 1385 – 1394 . doi: 10.1890/0012-9658(1999)080[1385:NTIFTB]2.0.CO;2
- Hicks , WT , Harmon , ME and Myrold , DD . 2003 . Substrate controls on nitrogen fixation and respiration in woody debris from the Pacific Northwest, USA . For. Ecol. Manage. , 176 : 25 – 35 . doi: 10.1016/S0378-1127(02)00229-3
- Inagaki , Y , Yoshinaga , S , Yamada , T , Shinomiya , Y and Torii , A . 2009 . Mass loss and nitrogen release of wood debris remaining after thinning in Japanese cedar and hinoki cypress plantations . Jpn. J. For. Environ. , 51 : 63 – 67 . (in Japanese with English summary)
- IPCC 2006: 2006 IPCC Guidelines for National Greenhouse Gas Inventories. Prepared by the National Greenhouse Gas Inventories Programme. IGES, Japan
- Kano , T . 1962 . The position in stems indicating the average values of bulk density . Bull. FFPRI , 134 : 141 – 148 . (in Japanese with English summary)
- Köhl , M , Traub , B and Päivinen , R . 2000 . Harmonisation and standardisation in multi-national environmental statistics – mission impossible? . Environ. Monit. Assess. , 63 : 361 – 380 . doi: 10.1023/A:1006257630216
- Krankina , ON , Harmon , ME and Griazkin , AV . 1999 . Nutrient stores and dynamics of woody detritus in a boreal forest: modeling potential implications at the stand level . Can. J. For. Res. , 29 : 20 – 32 .
- Laiho , R and Prescott , CE . 1999 . The contribution of coarse woody debris to carbon, nitrogen, and phosphorus cycles in three Rocky Mountain coniferous forest . Can. J. For. Res. , 29 : 1592 – 1603 .
- Lambert , RL , Lang , GE and Reiners , WA . 1980 . Loss of mass and chemical change in decaying boles of a subalpine balsam fir forest . Ecology , 61 : 1460 – 1473 . doi: 10.2307/1939054
- Larjavaara , M and Muller-Landau , HC . 2010 . Comparison of decay classification, knife test, and two penetrometers for estimating wood density of coarse woody debris . Can. J. For. Res. , 40 : 2313 – 2321 . doi: 10.1139/X10-170
- McRoberts , RE , Tomppo , E , Schadauer , K , Vidal , C , Ståhl , G , Chirici , G , Lanz , A , Cienciala , E , Winter , S and Smith , WB . 2009 . Harmonizing national forest inventories . J. For. , 107 : 179 – 187 .
- Meerts , P . 2002 . Mineral nutrient concentrations in sapwood and heartwood: a literature review . Ann. For. Sci. , 59 : 713 – 722 . doi: 10.1051/forest:2002059
- Minato , K , Ujiie , M and Hishinuma , Y . 1989 . Growth and wood quality of sugi and hinoki trees in the plantations of the Wakayama Experiment Forest . Res. Bull. Hokkaido Univ. For. , 46 : 223 – 247 .
- Miyajima , H . 1989 . Kyushu no sugi to hinoki , Tokyo , , Japan : Kyushu Daigaku Shuppankai . (in Japanese)
- Oh-uchi , Y . 1989 . “ Tree measurement ” . In Methodology of Forest Measurement , Edited by: Osumi , S . 28 – 47 . Tokyo , , Japan : Yokendo . (in Japanese)
- Palviainen , M , Finér , L , Laiho , R , Shorohova , E , Kapitsa , E and Vanha-Majamaa , I . 2010 . Carbon and nitrogen release from decomposing Scots pine, Norway spruce and silver birch stumps . For. Ecol. Manage. , 259 : 390 – 398 . doi: 10.1016/j.foreco.2009.10.034
- Pyle , C and Brown , MM . 1999 . Heterogeneity of wood decay classes within hardwood logs . For. Ecol. Manage. , 114 : 253 – 259 . doi: 10.1016/S0378-1127(98)00356-9
- Sakai , Y , Takahashi , M Ishizuka , S . 2008 . Estimating decay rates of dead wood by changes in wood density in coniferous plantations in Japan . Jpn. J. For. Environ. , 50 : 153 – 165 . (in Japanese with English summary)
- Skovsgaard , JP , Nordfjell , T and Sørensen , IH . 2006 . Precommercial thinning of beech (Fagus sylvatica L.): Early effects of stump height on growth and natural pruning of potential crop trees . Scand. J. For. Res. , 21 : 380 – 387 . doi: 10.1080/02827580600979817
- Sollins , P , Sachs , D , Cline , SP , Verhoeven , T and Spycher , G . 1987 . Patterns of log decay in old-growth Douglas-fir forests . Can. J. For. Res. , 17 : 1585 – 1595 . doi: 10.1139/x87-243
- Takahashi , M , Ishizuka , S , Ugawa , S , Sakai , Y , Sakai , H , Ono , K , Hashimoto , S , Matsuura , Y and Morisada , K . 2010 . Carbon stock in litter, deadwood and soil in Japan's forest sector and its comparison with carbon stock in agricultural soils . Soil Sci. Plant Nutr. , 56 : 19 – 30 . doi: 10.1111/j.1747-0765.2009.00425.x
- Tobin , B , Black , K , McGurdy , L and Nieuwenhuis , M . 2007 . Estimates of decay rates of components of coarse woody debris in thinned Sitka spruce forests . Forestry , 80 : 455 – 469 .
- Watanabe , H . 1978 . Mokuzai rigaku souron , Tokyo , , Japan : Norin-shuppan . (in Japanese)
- Yahata , H , Miyajima , H Sairinji , T . 1987 . Wood quality variations of native cultivars and the clones of plus trees in the experimental areas of cultivars of Cryptomeria japonica in Kyushu . Bull. Kyushu Univ. For. , 57 : 149 – 173 . (in Japanese with English summary)
- Yatskov , M , Harmon , ME and Krankina , ON . 2003 . A chronosequence of wood decomposition in the boreal forests of Russia . Can. J. For. Res. , 33 : 1211 – 1226 . doi: 10.1139/x03-033
- Zabel , RA and Morrell , JJ . 1992 . Wood Microbiology: Decay and its Prevention , San Diego , CA : Academic Press .
Supplementary Material
Table S1 and Figs. S1-S3 are available online at http://dx.doi.org/10.1080/00380768.2012.710526