Abstract
Two pot experiments were conducted to evaluate biochar derived from dead dairy cattle as a mineral fertilizer, especially phosphorus (P) fertilizer, and to clarify the effect of particle size of biochar on plant growth (Zea mays L.) and P uptake. To produce the biochar, body parts of dead cattle were placed in a charring chamber and allowed to char at 450°C for 4 h. The biochar was of high pH and rich in major plant nutrients, especially P. Application of fine biochar (< 1 mm) increased P uptake by the corn plants grown in soil of low available P status. As a result, plant growth was improved following biochar application and dry matter production was also increased. The effect of the biochar application on the P uptake and plant growth was promoted by the application of mineral nitrogen (N) fertilizer. Soil analysis after harvest indicated that the biochar application increased soil pH, available P and exchangeable calcium (Ca) and magnesium (Mg) compared with the soil before seeding, while soil available N and exchangeable potassium (K) were considerably decreased. The decrease in the soil available N was incomprehensible, because the result of the mass balance given by the difference between input as the applied N from the biochar and fertilizer N and output as the N uptake by the plants was positive. We observed a similar result in the mass balance of K to the case of N. The medium (2–4 mm) and coarse (> 4 mm) grade biochar did not significantly affect plant growth, because P uptake was not, or was only slightly, increased by the application of these biochars. Dissolution of P from the coarser biochars was probably slower than that of the fine biochar. The lower dissolution of P from the medium and coarse biochars was supported by the lower P absorption efficiency of these biochars compared with that of the fine biochar and superphosphate. The effect of fine biochar on plant growth and P uptake was similar to that of superphosphate. We can therefore conclude that fine biochar derived from cattle carcasses is an effective source of P fertilizer and amendment for soil acidity. The N and K contents in the biochar, although relatively high, cannot be relied upon as a mineral fertilizer. Further studies are needed to assess whether the N and K contents of the biochar indicate it can be regarded as a useful fertilizer.
INTRODUCTION
Phosphorus (P) is one of the major essential nutrients for plant growth, since it is involved in cellular energy transfer, respiration, and photosynthesis. P is also a structural component of the nucleic acids of genes and chromosomes, and of many coenzymes, phosphoproteins and phospholipids (Ozanne Citation1980). Nevertheless, P can be a limiting factor for plant growth, because there are sometimes problems with P supply in the soil. Total P in most native soils is usually low and is often present in forms unavailable to plants (Brady and Weil Citation2008a). P application to agricultural soils is often required to improve available soil P status. However, world reserves of high-quality rock phosphates, which can be mined at moderate cost, are likely to last only for approximately the next 90 years (Römer Citation2006); also, nearly 80% of the rock phosphates are concentrated in only the following countries: China, the United States, Morocco and Western Sahara, Russia, Tunisia and Jordan (United States Geological Survey Citation2011). It is therefore necessary to find alternative and renewable resources of P, because the future depletion of economically recoverable phosphate rock reserves is a major concern.
Animal bones, which are now usually regarded as just waste, should be considered a good alternative P source, because they were originally used as a P source at the end of the 18th century and, subsequently, bones were treated with sulfuric acid to produce superphosphate as the first commercial mineral fertilizer, in England in 1843 (Takahashi Citation2007). More recently, the use of animal bones as an alternative P source for agricultural land, however, has raised concern about the transmission of disease like bovine spongiform encephalopathy (BSE) through animal byproducts (Jeng et al. Citation2006), and regulations control their disposal in the European Union (European Union Citation2002). The potential for disease transmission can be avoided by autoclaving or charring the animal bones.
Autoclaved bone meal (ABM) is allowed for use as a fertilizer for various crops and it is in market in Japan. ABM contains substantial amounts of nitrogen (N) and P (Yamane Citation2007). The P in ABM is sparingly soluble in water, although 60 to 70% of the total P is soluble in 20 g L−1 citric acid (Yamane Citation2007). Klock and Taber (Citation1996) reported that steamed bone meal, like ABM, showed similar availability in P uptake by tomato (Lycopersicon esculentum Mill.; variety, Pilgrim) compared with meat bone meal, bone chips and mono-calcium phosphate. As for the charring of the bones, controlled thermal treatment exceeding about 400°C can be used to make a form of biochar that is free of infective agents (Warren et al. Citation2009). The animal bone char was also regarded as a P fertilizer with a solubility intermediate between Gafsa phosphate rock, which is a carbonate fluorapatite containing some accessory calcitic materials, and triple superphosphate fertilizer in 12 soils (Warren et al. Citation2009). However, reliable data on the plant availability of P from recycled products of P containing wastes including the animal bone char are sparse (Römer Citation2006).
Biochar is generally used as a term for products by pyrolysis of biomass including plant material, forest residues, yard clippings, wood chips and some animal wastes. Biochar application to soil is usually carried out to improve soil fertility and contribute to carbon sequestration (Sohi et al. Citation2010; Jeffery et al. Citation2011). Many papers show that biochar application has resulted in increase in crop yield, plant growth, fine root development and overall increases in soil fertility (Marris Citation2006; Chan et al. Citation2007; Renner Citation2007). In addition, biochar application to soil can result in a reduction of nitrous oxide emission (Yanai et al. Citation2007: B.P. Singh et al. Citation2010). Experimental results, however, are variable and dependent on the experimental set-up, soil properties and condition, while causative mechanisms have yet to be fully elucidated (Jeffery et al. Citation2011). The term “biochar” as used in this study, however, refers to the charred materials derived from dairy cattle carcasses, including skin, meat and bone, and it is a little bit different from the general use of the word as described above.
Our objectives in this study were as follows: (1) to evaluate a biochar derived from dead dairy cattle as a mineral fertilizer, especially P fertilizer, for plant growth and (2) to clarify the effect of biochar particle size on plant growth and P uptake by crop plants.
MATERIALS AND METHODS
Experiment 1
Biochar
Before preparing charred material, specified risk materials involved in BSE were removed from dead cattle in the veterinary teaching hospital of Rakuno Gakuen University. We collected parts from the whole body of the cattle, based approximately on their weight ratio to the body total, and they were put into a charring chamber made by SS Laboratory in Hyogo, Japan. This means that the charred materials were derived from fresh skin, meat and bone from the dead cattle.
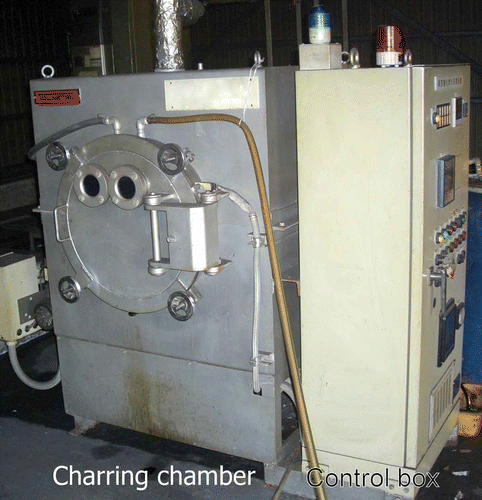
We used one-box equipment to char the materials in the experiment (). The equipment has a cylindrical airtight charring chamber made with a high silicon stainless steel, “Silicolloy D”, that is rich in silicon compared with normal stainless steel. The “Silicolloy” is internationally trademarked and it has four types, Silicolloy A2, XVI, B2 and D (SI Techno Co. Ltd. Citation2012). The chamber is covered with heat-resistant material and has three pipes. The pipes are used to create vacuum conditions in the chamber, to supply N gas into the chamber and to drain waste oils produced during the charring, respectively. The equipment also has a gas burner to heat up the chamber through the use of liquid petroleum gas. The chamber can resist temperatures up to 1200°C. A control box can regulate the following conditions in the chamber: vacuum pressure, N gas supply, the room temperature in the chamber and the charring process. The air in the chamber was removed by vacuum pump and replaced by N gas. Then the materials were charred at 450°C for 4 h. After cooling the chamber with water, all charred materials were taken out of the chamber. They were roughly ground by hand and mixed well. “Biochar” as used in this paper refers to the well-mixed charred materials as described above. Recovery rate as biochar, from the fresh remains, was about 15% of the fresh material weight. The biochar was ground again in a mortar to pass a sieve of 1-mm mesh in the experiment.
Figure 1 One-box equipment used for charring the cattle carcasses in the experiments.
Pot experiment
The experiment was a pot trial using Wagner pots with surface area of 0.02 m2 (16 cm diameter and 20 cm height). Each pot was filled with 2.4 kg of air-dried soil of the cumuric Andosol (Food and Agriculture Organization of the United Nations (FAO) and United Nations Educational, Scientific and Cultural Organization (UNESCO)) with high P absorption coefficient, low level of available P and low pH (). The soil acidity was not corrected, because corn (Zea Mays L.; variety, New Dent 100 days), which was used in our experiment, showed relatively good growth in the acidic soil, compared with where the soil had been amended by calcium carbonate (Matsunaka and Hashizume Citation2008). The test plants used were forage corn and four seeds were sown per pot and, after emergence, two plants were removed.
Table 1 Some chemical properties of soil used in experiments
Experimental design comprised six treatments, with three biochar application rates and two levels of mineral N fertilizer (), with three replicates. The application rates of biochar were 0, 61 and 122 g pot−1 (0, 3.05 and 6.10 kg m−2); respectively, control, standard and heavy application supplying total P (T-P) of 0, 6.6 and 13.2 g pot−1 (0, 330 and 660 g m−2). Chosen N application rates were 0 and 0.5 g pot−1 (25 g m−2) as ammonium sulfate ((NH4)2SO4). Potassium (K), calcium (Ca) and magnesium (Mg) contents in the biochar were relatively high (); therefore, no additional K, Ca or Mg was applied to the pots. The soil matric water potential in the pots was maintained in a range from –9.8 kPa (pF 2.0) to –31 kPa (pF 2.5) by irrigation with deionized water two or three times a day, depending on the weather conditions. The corn plants were grown for 45 d in the pot from seeding on June 10 to harvest on July 24, 2009. The experiment was carried out in a glasshouse at the university.
Table 2 The details about the treatments in Experiment 1
Table 3 Some chemical properties of the cattle biochar used in Experiment 1
Experiment 2
Pot size, soil and watering regime were the same as Experiment 1. Experimental design comprised size of biochar and application rate as the main factors. The three biochar size fractions were coarse: < 4mm–> 2 mm; medium: < 2 mm–> 1 mm; fine: < 1 mm, prepared by grinding following charring. The five biochar application rates, expressed as T-P, were 0, 0.8, 1.6, 3.2 and 6.5 g pot−1 (0, 40, 80, 160 and 325 g m−2). An additional treatment of chemical fertilizer, superphosphate, was included, to compare its effect on plant growth and P uptake across different biochar sizes at the same application rate of 1.6 g P pot−1 (80 g m−2). There were three replicates of all treatments. All pots received N as ammonium sulfate ((NH4)2SO4) and K as potassium sulfate (K2SO4) at a rate of 0.5 and 1.0 g pot−1(25 and 50 g m−2), respectively.
The plants were grown for 40 d from seeding on August 12 to harvest on September 20, 2009.
Biochar, plant and soil analysis
Biochar samples were digested with sulfuric acid-hydrogen peroxide (H2SO4-H2O2) to measure N, P and K content and with nitric acid-perchloric acid (HNO3-HClO4) for Ca and Mg determination. Total N in the digested solution samples was measured by the steam distillation method. P was determined using the vanado-molybdate yellow method (Watanabe et al. Citation1998) and K, Ca and Mg were analyzed by atomic absorption spectrophotometer (AAnalyst 100, Perkin Elmer Co. Ltd., Tokyo). To evaluate the biochar as a P fertilizer we determined water soluble P and citric acid soluble P in the biochar by the routine methods used in Japan (Anonymous Citation2012). An outline of the routine methods is as follows: (1) For the water soluble P, 5.00 g of the biochar was extracted with 400 mL of deionized water by shaking 30 to 40 times per minute for 30 min. (2) For the citric acid soluble P, 1.00 g of the biochar was extracted with 150 mL of 20 g L−1 citric acid at 30 °C, by shaking 30 to 40 times per minute for 1 h. These solutions were filtered after shaking and P in the filtrates was determined using the vanado-molybdate yellow method.
After harvest, the plants were divided into shoots and roots, and soil samples were also collected. In particular, the rhizosphere soil surrounding the roots was taken by vigorously shaking roots with soil, and the soil was added to the bulk soil and mixed well. The roots were washed first in running tap water and then in deionized water. Dry weights of the shoots and roots were obtained after drying for more than 72 h at 70°C. The dried plant samples were ground and analyzed. The ground samples were digested using H2SO4-H2O2 to measure nutrient contents in the sample. N, P and K in the digested solution samples were measured by the same procedure described above.
The original moist soil samples were used to measure the available N, i.e., both nitrate nitrogen (NO3-N) and ammonium nitrogen (NH4-N) were extracted by 100g L−1 potassium chloride (KCl) solution after soil incubation under conditions of 60% of maximum water holding capacity of the soil and at 30°C for 4 weeks. The NO3-N and NH4-N in the KCl solution were measured with an FIA system (Flow Injection Analysis, FOSS Japan Co. Ltd., Tokyo). After setting the incubation of the soil, the soil samples were air-dried to determine the following: soil pH (H2O) was measured by glass electrode, and exchangeable K, Ca and Mg, extracted by ammonium acetate solution (1 mol L−1, pH7.0), were also analyzed using the atomic absorption. Available P in the soil was determined using the Truog method (Truog Citation1930), extracted by H2SO4 [0.001 mol L−1, pH 3.0, containing 3 g L−1 of (NH4)2SO4]; the results are expressed hereafter as Truog-P.
Statistical analysis
A two-way analysis of variance (ANOVA) was used to examine the significance of the main effects of the factors and their interaction in each experiment. The factors in each experiment were as follows: Experiment 1, the application rate of the biochar and N application; Experiment 2, the size of the biochar and the P application rate derived from each size grade of the biochar. All pairwise multiple comparison procedures were conducted by Tukey test. PC software SigmaPlot (version 11.0, 2008) was used for the ANOVA and the multiple comparisons.
RESULTS
Experiment 1
Chemical properties of the biochar
The biochar used in the experiment showed high pH and high P content (). Available P, as citric acid soluble P, was high and represented 95% of the T-P in the biochar. The biochar contained little water soluble P. Total N in the biochar was 39.5 g kg−1 and NH4-N, which was soluble for 100 g L−1 KCl solution, was 24% of the total N while NO3-N was not detected. K, Ca and Mg contents in the biochar were also relatively high. Major essential nutrients for plant growth in the biochar were therefore relatively rich, especially in P and Ca, reflecting the main components of bone as a form of calcium phosphate.
Plant growth and dry matter production
The corn plants in all pots emerged well within a few days from seeding, although the soil pH and available P of the soil was considerably low (). After about 10 d past the emergence, however, their growth in the control pots differed from those receiving the biochar, in spite of N application. They showed clearly severe P deficiency symptoms and their growth rate was restricted by the deficiency. Plant growth was better in the biochar-amended group than that in non-amended group, with or without N application. After about 30 d from seeding, however, the plants in the pots receiving the biochar without N (–N) showed slight N deficiency symptoms and growth was restricted, compared with those with N (+N).
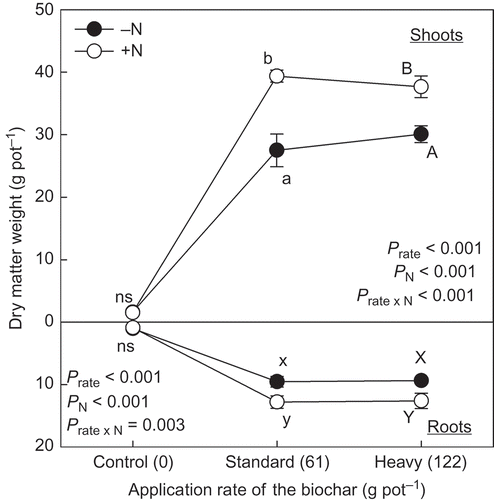
The biochar application significantly increased dry matter (DM) weight of shoots and roots with and without N application (). There was, however, a significant interaction between the application of biochar and N in the DM weight of the shoots (P < 0.001) and the roots (P = 0.003). The increasing effect of the biochar application with N (+N) on their DM weight was significantly clearer than without N (–N) within the same application rate of the biochar (). There was no statistically significant difference in DM weight of the shoots and roots between the treatment of standard and heavy application of the biochar, in both –N and +N conditions (P > 0.050).
Figure 2 Dry matter weight of shoots and roots of the plants grown at different application rates of biochar derived from dead cattle. Application rate as phosphorus (P) from the biochar to control, standard and heavy treatments was 0.0, 6.6 and 13.2 g pot−1, respectively. Nitrogen (N) application rate was 0.5 g pot−1. Different letters within the same application rate of the biochar show significant difference between the N application treatments (without N, –N and with N, +N) by Tukey test (P < 0.05). ns, no significant difference. Error bars represent standard deviation (n = 3).
Nutrients uptake and their mass balance in the pot
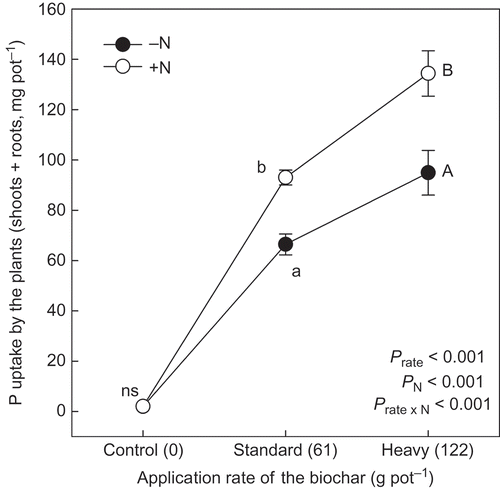
The P content in shoots and roots was significantly increased with an increasing rate of biochar (P < 0.001) (), although N application had no significant effect on plant P content (P > 0.050). Since there was no significant interaction between biochar application rate and N (P > 0.100), it appeared that P content in the shoots and the roots was affected only by the biochar application. P uptake by the plants (shoots and roots) increased significantly with the biochar application rate (). This trend was more readily apparent with added N, the interaction in P uptake between biochar application rate and N being significant (P < 0.001).
Table 4 Phosphorus (P) content in the shoots and the roots of the plants grown at the different application rate of the biochar without nitrogen (–N) or with nitrogen (+N)
Figure 3 Phosphorus (P) uptake by the plants (shoots + roots) grown at different application rates of the biochar derived from dead cattle. Application rate as P from the biochar to control, standard and heavy treatments was 0.0, 6.6 and 13.2 g pot−1, respectively. Nitrogen (N) application rate was 0.5 g pot−1. Different letters within the same application rate of the biochar show significant difference between the N application treatments (without N, –N and with N, +N) by Tukey test (P < 0.05). ns, no significant difference. Error bars represent standard deviation (n = 3).
There was also a significant interaction in N uptake between biochar application rate and N (P < 0.001) (). The results show that the biochar increased N uptake by the plant and the effect of the biochar application can be increased by N application, even though the biochar contained NH4-N (). This was also supported by the slight N deficiency symptom of the plants grown without applied N.
Table 5 Nitrogen (N) and potassium (K) uptake by the plants (shoots + roots) grown at the different application rates of the biochar without N (–N) or with N (+N)
K uptake by the plants increased with biochar application rate (). In the case of K, however, there was no significant interaction between the application rate of biochar and N (P > 0.700).
Mass balance in each pot was given by the difference between input as the nutrient derived from the applied biochar with or without N and output as uptake by the plants. Input of P, N and K in the pots receiving the biochar was more than the output, respectively (). Even in the control pot where fertilizer N was applied (+N condition), the mass balance of N was positive.
Table 6 Mass balance between input and output in each pot (g pot−1)
Soil analysis after harvest
Application of the biochar increased soil pH and caused higher pH than the original pH (). There was a significant interaction in soil pH between biochar application rate and N (P < 0.001). The effect of biochar on soil pH was greater in the absence of applied N.
Figure 4 Soil pH, Truog-phosphorus (P) available nitrogen (N) and exchangeable cations of the soil after harvesting the plants in the pot experiment. The value in the parentheses under the measurement item in each figure was original value of the soil used in the experiment. Different letters within the same application rate of the biochar show significant difference between the N application treatments (without N, –N and with N, +N) by Tukey test (P < 0.05). H2O, water; K, potassium; Ca, calcium; Mg, magnesium; ns, no significant difference. Error bars represent standard deviation (n = 3).
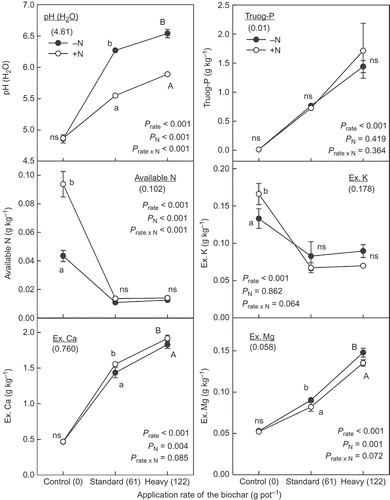
The available P as a form of Truog-P also increased with the application of biochar, and there was no interaction between the application of biochar and N (P > 0.300) (). Similar results were also found in exchangeable Ca (Ex. Ca) and Mg. They increased clearly with the application rate of the biochar and there was no interaction between them (P > 0.050). Truog-P, Ex. Ca and Mg in the soil after harvest in both treatments of the standard and heavy application of the biochar were higher than those of the original soil.
Regardless of the rate of biochar, its application decreased the available N and Ex. K in the soil (), while there was no significant difference between those in the treatments of the standard and the heavy application rate. The interaction between the application of biochar and N was apparent in available N (P < 0.001), but not in Ex. K (P = 0.064). The available N content in the soil where only N was applied with no biochar was remarkably high. It was likely that this high N residue in the soil was a consequence of the poor plant growth as a result of P deficiency and the low N uptake by the plants. The Ex. K content in the soil without biochar treatment was also greater than after biochar application, whether or not N was applied. In all pots, therefore, available N and Ex. K decreased from those of the original soil. These results were not apparently consistent with the findings that the mass balance of N and K were positive in the pots receiving the biochar with and without N ().
Experiment 2
This experiment was carried out to focus on the availability of P derived from the biochar for plant growth. It is assumed that the availability is dependent on dissolution of P from the biochar and that the rate of dissolution is, in turn, probably dependent upon the size of the biochar. The results of Experiment 1 suggested that the standard rate of application of the biochar was sufficient for plant growth. In this experiment, therefore, the maximum application rate of the biochar was set as 61 g pot−1 (6.5 g P pot−1 = 325 g P m−2), the standard rate in Experiment 1.
Chemical properties of the biochar
We used three different size grades of biochar in the experiment: coarse, medium and fine biochar. The pH(H2O), total N and water soluble P in the biochar increased with the reduction in the size grade of biochar (). Total P and citric acid soluble P in the fine biochar were higher than those in the medium and coarse biochar. There was no great difference in the ratio of citric acid soluble P to total P among the biochars. The ratio of water soluble P to total P in the fine biochar, however, was the highest, followed by the medium and the coarse biochar. NH4-N and total K contents in the biochar were not affected by size grade.
Table 7 Some chemical properties of the cattle biochar used in Experiment 2
Plant growth and dry matter production
Emergence of the corn plants in this experiment was, again, good. After about 10 d following emergence, however, plant growth rate changed with biochar size grade and application rate. As in Experiment 1, severe P deficiency symptoms were apparent in pots without biochar. Where biochar was applied, the P status of the plants was dependent on both P application rate and the size grade of biochar. With the coarse biochar, the plants showed clear P deficiency symptoms up to the application rate of 1.6 g P pot−1 (80 g P m−2). In the treatments with the medium biochar, the deficiency was found at the low application rate of 0.8 g P pot−1 (40 g P m−2). The plants did not show any deficiency with the fine biochar, even at the low rate of 0.8 g P pot−1 (40 g P m−2).
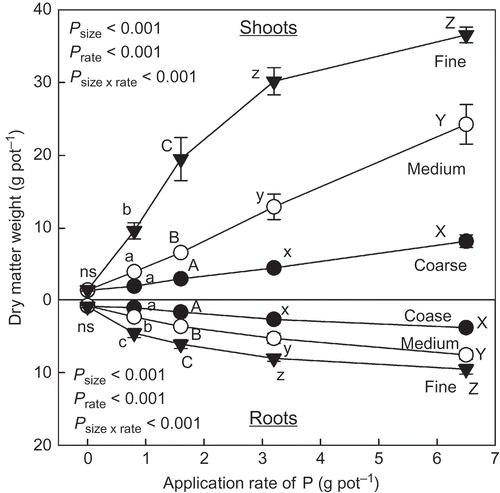
Regardless of the size of the biochar, DM weight of the shoots and the roots increased with the application rate of the biochar (). The increasing effect of the application rate on the DM weight, however, was clearly affected by the size of the biochar. There was a significant interaction between biochar size and application rate (P < 0.001). The fine grade biochar application was the most effective for DM production of the shoots and the roots, at any specific application rate (). Even at the maximum rate of P (6.5 g P pot−1 = 325 g P m−2) derived from the coarse biochar, DM weight of the shoots and roots of the plants was less than from the lowest rate of 0.8 g P pot−1 (40 g P m−2) derived from the fine grade biochar.
Figure 5 Dry matter weight of the shoots and the roots of the plants grown at different application rates of phosphorus (P) derived from the different size biochars. See Table 7 for details of the different size biochars. Different letters within the same application rate of P derived from the biochar show significant difference among the different size biochars by Tukey test (P < 0.05). ns, no significant difference. Error bars represent standard deviation (n = 3).
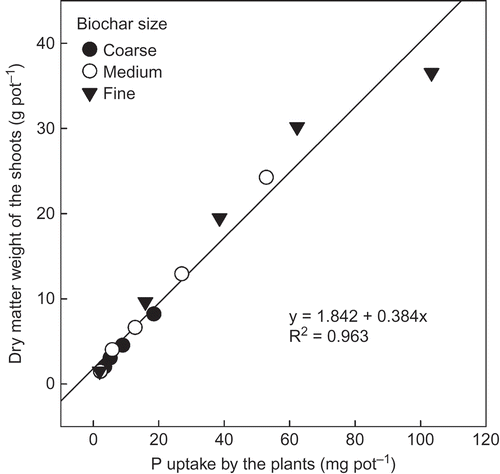
P uptake and DM production
P content in the plants (shoots and roots) significantly increased with the application rate of P derived from the biochars (). This trend, however, was significantly affected by the biochar size, with a significant interaction between the application rate and biochar size (P < 0.001). The fine-grade biochar considerably increased the P content of the plants compared with the coarse and medium biochar, at equivalent biochar application rates (). The highest P content in the treatments of the coarse biochar was found in the highest P application rate (6.5 g P pot−1 = 325 g P m−2), although it was only a little higher than that in the treatment of 1.6 g P pot−1 (80 g P m−2) of the fine biochar.
Table 8 Phosphorus (P) content in the plants (shoots + roots, g kg−1) grown at different P application rates derived from the different size of the biochars
P uptake by the plants (shoots and roots) increased with the P application rate (). This trend, however, was also affected by the biochar size. The interaction in P uptake between the P application rate and the biochar size was significant (P < 0.001). P uptake by the plant in the treatment of the fine biochar was usually the highest and followed by the treatment of medium and coarse biochar, at equivalent P application rates. This result means that the plant could absorb more P from the fine biochar than from the medium and coarse grades, even at equivalent P application rates. Regardless of biochar size, however, the DM weight of the shoots of the plant increased linearly with P uptake by the plants (). This relationship was not affected by the size of the biochar, because the relationship could be significantly expressed by one linear regression line.
Figure 6 Phosphorus (P) uptake by the plants (shoot + root, mg pot−1) grown at different application rates of P derived from different size biochars. See for details of the different size biochars. Different letters within the same application rate of P derived from the biochar indicate significant difference among the different size biochars by Tukey test (P < 0.05). ns, no significant difference. Error bars represent standard deviation (n = 3).
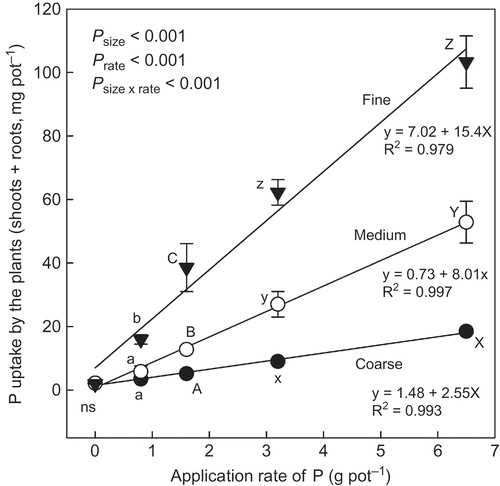
Figure 7 Relation between phosphorus (P) uptake by the plants and dry matter weight of the shoots. See Table 7 for details of the different size biochars.
Soil pH and available P in soils after harvest
Soil pH after harvesting the plants was significantly affected by both biochar size and application rate of P derived from the biochar (). The pH tended to increase with application rate. The application of the fine biochar, however, showed a significantly greater increase in soil pH than the other sizes of biochars, at P application rate from each biochar > 3.2 g pot−1 (160 g P m−2). The increasing effect of the fine biochar application on soil pH was also observed in Experiment 1.
Figure 8 Soil pH (water, H2O) and Truog-phosphorus (P) in soil after harvesting the plants. See Table 7 for details of the different size biochars. Different letters within the same application rate of P show significant difference among the different size biochars by Tukey test (P < 0.05). ns, no significant difference. Error bars represent standard deviation (n = 3).
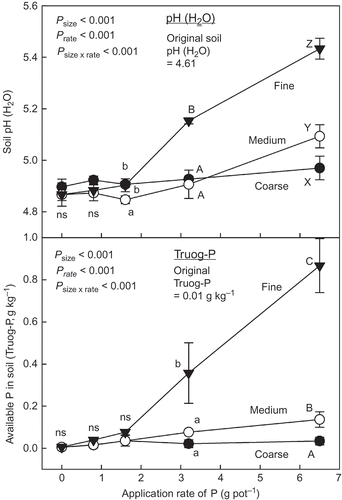
Available P as a form of Truog-P in the soil after harvesting the plants increased significantly with application rate of P derived from each biochar size (). Similar to the results of soil pH, the effect of the application rate of P derived from the biochar on increase in the soil available P was also affected by both biochar size and application rate. The effect of the medium and coarse biochar on the soil available P was significantly less than that of the fine biochar ().
Comparison of P availability of the biochar with that of superphosphate fertilizer
We compared the effect of the applied P on plant growth between the different size grades of biochar and superphosphate, at the same application rate of 1.6 g P pot−1 (80 g P m−2). There was no significant difference in DM production and P uptake by the plants between the treatments receiving the fine biochar and superphosphate (). In addition, there was a significant difference between the effect of the fine biochar and the other size grades of biochar. The results indicated that the P availability of the fine biochar was similar to that of superphosphate and, therefore, the fine biochar could be used as an alternative P source to superphosphate.
Table 9 Comparison of effect of the different phosphorus (P) sources on dry matter (DM) production and P uptake by the corn plants and the parameters of P efficiency for DM production of the shoots (Pe), efficiency of P absorbed by the plants (Pab) and efficiency of DM production of the shoot by the absorbed P (Pdm) among the different P sources in the same application rate of P (1.6 g pot−1)
To confirm the above results, we proposed the following parameters: P efficiency for DM production of the shoots (Pe), efficiency of P absorbed by the plants (Pab) and efficiency of DM production of the shoot by the absorbed P (Pdm). These are defined as follows:
Pe = (DMt – DMc)/Pa (1)
Pab = (Pt – Pc)/Pa (2)
Pdm = (DMt – DMc)/(Pt – Pc) (3) where DMt and DMc are the DM of the shoots of the plants in the pot receiving P from the biochars or superphosphate and no P (control pot), respectively. Pa is the applied P from the biochars or superphosphate (1.6 g P pot−1 = 80 g P m−2). Pt and Pc is P uptake by the plants (shoots and roots) in the pot receiving P from the biochar or superphosphate and in the control pot, respectively. When the two parameters, Pab and Pdm, are defined as in Eq. 2 and 3, Pe can be given by multiplying Pab and Pdm. Therefore, Pe can be considered in terms of the two parameters Pab and Pdm.
clearly shows that the reason why Pe of the coarse and medium biochar was lower than that of the fine biochar and superphosphate was only due to low Pab, and there was no significant difference in Pdm among the different P sources.
DISCUSSION
Experiment 1: Evaluation of the biochar as a nutrient source
We recognized that the effect of the biochar application with fertilizer N on the soil pH was less than that without N. It was probably due to the acidifying effect of the applied fertilizer N (Brady and Weil Citation2008b). Even though we found the result described above, because of the high pH of the biochars (), the biochar applications increased soil pH after plant harvest, regardless of the presence of N. It was therefore suggested that the biochar could be used as an amendment for soil acidity.
In addition, the biochar was relatively rich in some nutrients, not only P but also N, K, Ca and Mg. The results of Experiment 1 showed that biochar could be used as a P source, because growth of corn plants in soil of low available P status was considerably improved by the application of the biochar. Warren et al. (Citation2009) reported the dissolution of P of animal bone char depended on the soil pH, and a lower pH was required for better P dissolution from the animal bone char. There was, therefore, a possibility that the low pH of the soil used in the experiments could provide better conditions to dissolve P from the biochar. The results in the experiment suggest that excessive uptake of P may occur after heavy application of biochar (“luxury uptake”), because this increased P uptake did not increase plant growth ( and ). It therefore appears, at least in this experiment, that the standard application rate of the biochar is sufficient to meet the P requirements of the plants.
The improvement in plant growth by the biochar application was promoted in the presence of N. When N was not applied with the biochar, the plants showed N deficiency, even though the biochar contained N derived from organic matter such as protein of the dead cattle. These results indicated that N supplied from the applied biochar was insufficient to meet the increased N requirement of the plants resulting from the improvement of P supply in soil of low P status. This was also supported by the result that the available soil N content after harvesting the plants in all treatments was lower than that of the original soil ().
According to the mass balance in the pots, total N input derived from the biochar with or without fertilizer N was more than output N as N uptake by the plants grown in the pots receiving the biochar (). The input in the form of only NH4-N was also more than the output in the pots ( and ). This means that the excess applied N should be accumulated in the soil. Nevertheless, the available soil N after harvesting the plants decreased clearly in all treatments compared with the original, and also the plants receiving the biochar without fertilizer N (–N condition) showed slight N deficiency symptoms. We could not theoretically explain the inconsistent results described above. The followings are possibilities that can explain the results: (1) N that was detected as NH4-N of the biochar extracted with KCl solution might not be easily soluble in soil solution, or (2) immobilization of NH4-N derived from both the biochar and fertilizer N. At least, however, we can point out that N in the biochar should not be regarded as a reliable N source because, as described above, we observed the decrease in the available soil N and N deficiency symptoms of the plants grown in the pots receiving the biochar without fertilizer N.
Similar results were also recognized in K derived from the biochar. Mass balance of K in the treatment of standard and heavy application showed that input K was more than output K; nevertheless, soil Ex. K after harvesting the plants decreased from the original ( and ). As in the case of N, the results of K described above were incomprehensible. Even so, it can be suggested that the K in the biochar was not a reliable K source for plant growth, because the excess applied K did not contribute to increased Ex. K in the soil.
The important point to solve these incomprehensible results related with N and K in the biochar is probably to clarify the chemical form of N and K in the biochar. Further studies are needed to elucidate more fully the issues of N and K in the biochar.
Since we did not measure Ca and Mg uptake by the plants, we could not evaluate the biochar as a Ca or Mg source for plant growth. It appeared, however, that those nutrients were supplied by the applied biochar in excess of their requirement by the plants, because Ex. Ca and Mg in the soil after harvesting were more than the original and they increased with the biochar application despite the presence of N ().
Overall results from Experiment 1 revealed that the biochar derived from the dead dairy cattle can be used as good source of P fertilizer and an amendment for soil acidity, while the N and K in the biochar should not be relied upon as a nutrient source.
Experiment 2: The size of biochar and availability of P from the biochar
indicates that the plants grown in the soil receiving the fine biochar could more easily absorb P than the plants grown in the soil receiving the medium or the coarse biochar, at equivalent application rates of P derived from each biochar. The results showed that dissolution of P from the fine biochar occurred more readily than from the medium or coarse biochar. This was also completely supported by the difference in Pab among the different P sources in the application rate of 1.6 g P pot−1 (80 g P m−2) (). It was therefore due to the easier dissolution of P from the fine biochar than the other size grades of biochar that the fine biochar was the most effective for DM production and P uptake.
When the plants grew in soil of poor available P status, the plant tried to absorb the P dissolved from any size of biochar or superphosphate. In this case, however, it is important to confirm whether the absorbed P derived from the different P sources can play the same role in DM production or not. shows clearly that there was no difference in the effect of the absorbed P derived from any size grade of the biochars on the DM production of the shoots. This was supported by the lack of any significant difference in Pdm at the same application of 1.6 g P pot−1 (80 g P m−2) for the different P sources including superphosphate fertilizer ().
Consequently, it is concluded that the plants can easily absorb P from the fine biochar, since it appears that the dissolution of P from the biochar was regulated by the size of the biochar, and P in the fine biochar could more easily dissolve than that in the medium and coarse biochar.
The availability of P derived from the biochar was probably affected by the temperature differences during the pyrolysis process, because the nutrient availability of the biochar usually decreases with increase in the temperature (Atkinson et al. Citation2010). In addition, it is well known (Antal and Grønli Citation2003; Gaskin et al. Citation2008; Novak et al. Citation2009; B. Singh et al. Citation2010) that the conditions of pyrolysis affect the chemical and physical characteristics of biochar. Therefore, further studies, including field trials, are needed to clarify the effect of these issues on nutrient availability, in particular of P, from biochar for agricultural use, in biochar derived from animal carcasses. In Japan, it was legally regulated that the animal carcasses are required to be charred at a higher temperature than 1000°C for more than 30 min. Therefore, experimental results using the biochar produced at a charring of 1000°C for at least 30 min are needed in Japan, if we attempt to actually apply the biochar to the field. According to the experimental results (T. Matsunaka et al. 2011, unpublished data), there was no significant difference in the P availability to the plant among the following three P sources: the biochar reported here, that at 1000°C for 30 min within the 4 h charring at 450°C and superphosphate.
In this paper, we reported only the effect of biochar application on plant growth at one cropping time. As shown in , however, 95% of the P in the biochar was soluble in citric acid solution. This means there is a possibility that the P in the applied biochar will show good results in the next cropping as a residual effect of the P, since the citric acid soluble P was sparingly soluble in water. In fact we clearly observed the residual effect of P in the biochar used here (T. Matsunaka et al. 2010, unpublished data).
CONCLUSION
Biochar derived from dead dairy cattle can be used as an amendment for soil acidity, and also as a P fertilizer. Where fine-size biochar (< 1 mm) charred at 450°C for 4 h is used, the biochar can give similar results to superphosphate fertilizer for DM production and P uptake by the plant. However, the N and K contents of biochar cannot be relied upon as an effective source of mineral N and K fertilizer.
ACKNOWLEDGMENTS
We would like to express our thanks to Mr. T. Shimizu of SS Laboratory, who financially supported our experiments and prepared the biochar with a special charring chamber made in his laboratory. We wish to thank Prof. M. Koiwa of our university for his help to get the materials of dead dairy cattle for the charring. We gratefully acknowledge Mr. H. Hashimoto, Central Agricultural Experiment Station of Hokkaido Research Organization, for his help to measure water soluble and citric acid soluble P in the biochars. We thank all the laboratory students of Soil Fertility and Plant Nutrition in our university for their kind support to our experiments, and also associate Prof. T. Sawamoto for his useful comments. The authors thank Dr. K. Smith of ADAS, Wolverhampton, UK, for his critical reading and correction of the manuscript.
Related Research Data
REFERENCES
- Anonymous 2012: Analytical methods of fertilizers (in Japanese). (July, 2012). http://www.famic.go.jp/ffis/fert/sub6_data/bunsekihou.html (http://www.famic.go.jp/ffis/fert/sub6_data/bunsekihou.html)
- Antal , MJ Jr and Grønli , M . 2003 . The art, science, and technology of charcoal production . Ind. Eng. Chem. Res. , 42 : 1619 – 1640 .
- Atkinson , CJ , Fitzgerald , JD and Hipps , NA . 2010 . Potential mechanisms for achieving agricultural benefits from biochar application to temperate soils: a review . Plant Soil , 337 : 1 – 18 .
- Brady , NC and Weil , RR . 2008a . “ Soil phosphorus and potassium. In ” . In The Nature and Properties of Soils , 14th ed. , Edited by: Brady , NC and Weil , RR . 594 – 622 . Upper Saddle River, NJ : Pearson Prentice Hall .
- Brady , NC and Weil , RR . 2008b . “ Human-influenced soil acidification. ” . In In The Nature and Properties of Soils , 14th , Edited by: Brady , NC and Weil , RR . 375 – 381 . Upper Saddle River, NJ : Pearson Prentice Hall .
- Chan , KY , Van Zwieten , L , Meszaros , I , Downie , A and Joseph , S. 2007 . Agronomic values of greenwaste biochar as a soil amendment . Aust. J. Soil Res. , 45 : 629 – 634 .
- European Union 2002: Animal By-Products Regulations (EC) No. 1774/2002. (July, 2012). http://eur-lex.europa.eu/LexUriServ/LexUriServ.do?uri=OJ:L:2002:273:0001:0095:EN:PDF (http://eur-lex.europa.eu/LexUriServ/LexUriServ.do?uri=OJ:L:2002:273:0001:0095:EN:PDF)
- Gaskin , JW , Steiner , C , Harris , K , Das , KC and Bibens , B . 2008 . Effect of low-temperature pyrolysis conditions on biochar for agricultural use . Trans. Am. Soc. Agric. Biol. Eng. , 51 : 2061 – 2069 .
- Jeffery , S , Verheiien , FGA , van der Velde M and Bastos , AC . 2011 . A quantitative review of the effects of biochar application to soils on crop productivity using meta-analysis . Agric. Ecosyst. Environ. , 144 : 175 – 187 .
- Jeng , AS , Haraldsen , TK , Grønlund , A and Pedersen , PA . 2006 . Meat and bone meal as nitrogen and phosphorus fertilizer to cereal and rye grass . Nutr. Cycl. Agroecosyst. , 76 : 183 – 191 .
- Klock , KA and Taber , HG . 1996 . Comparison of bone products for phosphorus availability . Hortic. Tech. , 6 : 257 – 260 .
- Marris , E . 2006 . Putting the carbon back: Black is the new green . Nature , 442 : 624 – 626 .
- Matsunaka , T and Hashizume , VA . 2008 . Can animal manure and liming increase the availability of phosphorus to the plant in acid Andosol? . J. Rakuno Gakuen Uni. , 33 : 151 – 162 .
- Novak , JM , Lima , I , Baoshan , X , Gaskin , JW , Steiner , C , Das , KC , Watts , DW , Busscher , WJ and Schomberg , H . 2009 . Characterization of designer biochar produced at different temperatures and their effects on a loamy sand . Ann. Environ. Sci. , 3 : 195 – 206 .
- Ozanne , PG . 1980 . “ Phosphate nutrition of plants – A general treatise ” . In In The Role of Phosphorus in Agriculture , Edited by: Khasawneh , FE , Sample , EC and Kamprath , EJ . 559 – 589 . Madison, WI. : American Society of Agronomy .
- Renner , R . 2007 . Rethinking biochar . Environ. Sci. Technol. , 41 : 5932 – 5933 .
- Römer , W . 2006 . Plant availability of P from recycling products and phosphate fertilizers in a growth-chamber trial with rye seedlings . J. Plant Nutr. Soil Sci. , 169 : 826 – 832 . (in German with English summary)
- SI Techno Co. Ltd. 2012: (December, 2012). http://www.silicolloy.co.jp/technicalreport-e.html (http://www.silicolloy.co.jp/technicalreport-e.html)
- Singh , B , Singh , BP and Cowie , AL . 2010 . Characterisation and evaluation of biochars for their application as a soil amendment . Aust. J. Soil Res. , 48 : 516 – 525 .
- Singh , BP , Hatton , BJ , Singh , B , Cowie , AL and Kathuria , A . 2010 . Influence of biochars on nitrous oxide emission and nitrogen leaching from two contrasting soils . J. Environ. Qual. , 39 : 1224 – 1235 .
- Sohi , SP , Krull , E , Lopez-Capel , E and Bol , R . 2010 . A review of biochar and its use and function on soil . Adv. Agron. , 105 : 47 – 82 .
- Takahashi , E . 2007 . On the cause and result of the “Fertilizer Revolution” that occurred in the 19th century (with related episodes) . Jpn. J. Soil Sci. Plant Nutr. , 78 : 97 – 102 . (in Japanese)
- Truog , E . 1930 . The determination of the readily available phosphorus of soils . J. Am. Soc. Agron. , 22 : 874 – 882 .
- United States Geological Survey 2011: http://minerals.usgs.gov/minerals/pubs/commodity/phosphate_rock/mcs-2011-phosp.pdf (July, 2012).
- Warren , GP , Robinson , JS and Someus , E . 2009 . Dissolution of phosphorus from animal bone char in 12 soils . Nutr. Cycl. Agroecosyst. , 84 : 167 – 178 .
- Watanabe , T , Osaki , M and Tadano , T . 1998 . Effects of nitrogen source and aluminum on growth of tropical tree seedlings adapted to low pH soils . Soil Sci. Plant Nutr. , 44 : 655 – 666 .
- Yamane , T . 2007 . “ Autoclaved bone meal ” . In In Encyclopedia on Fertilizers and Materials Increasing Soil Fertility, Ed. Nobunkyo 385 – 386 . Nobunkyo, Tokyo (in Japanese)
- Yanai , Y , Toyota , K and Okazaki , M . 2007 . Effects of charcoal addition on N2O emissions from soil resulting from rewetting air-dried soil in short-term laboratory experiments . Soil Sci. Plant Nutr. , 53 : 181 – 188 .