Abstract
Land-use type and nitrogen (N) addition strongly affect nitrous oxide (N2O) and carbon dioxide (CO2) production, but the impacts of their interaction and the controlling factors remain unclear. The aim of this study was to evaluate the effect of both factors simultaneously on N2O and CO2 production and associated soil chemical and biological properties. Surface soils (0–10 cm) from three adjacent lands (apple orchard, grassland and deciduous forest) in central Japan were selected and incubated aerobically for 12 weeks with addition of 0, 30 or 150 kg N ha–1 yr–1. Land-use type had a significant (p < 0.001) impact on the cumulative N2O and CO2 production. Soils from the apple orchard had higher N2O and CO2 production potentials than those from the grassland and forest soils. Soil net N mineralization rate had a positive correlation with both soil N2O and CO2 production rates. Furthermore, the N2O production rate was positively correlated with the CO2 production rate. In the soils with no N addition, the dominant soil properties influencing N2O production were found to be the ammonium-N content and the ratio of soil microbial biomass carbon to nitrogen (MBC/MBN), while those for CO2 production were the content of nitrate-N and soluble organic carbon. N2O production increased with the increase in added N doses for the three land-use types and depended on the status of the initial soil available N. The effect of N addition on CO2 production varied with land use type; with the increase of N addition doses, it decreased for the apple orchard and forest soils but increased for the grassland soils. This difference might be due to the differences in microbial flora as indicated by the MBC/MBN ratio. Soil N mineralization was the major process controlling N2O and CO2 production in the examined soils under aerobic incubation conditions.
INTRODUCTION
Global warming is unequivocal and may affect many ecosystems, and greenhouse gases (GHGs) are one of the dominating forces for these changes (IPCC Citation2007). Carbon dioxide (CO2) is one of the most important GHGs, increasing from the pre-industrial level of 280 ppm to 379 ppm in 2005 (IPCC Citation2007). Nitrous oxide (N2O), another important GHG, has 298 times higher global warming potential than CO2 over a 100-year time span (Forster et al. Citation2007), also leading to depletion of the stratospheric ozone layer (Ravishankara et al. Citation2009).
Changing land-use types and associated management practices via changing land-cover (e.g., plant species) or agricultural activities (e.g., fertilizer, weeding) can have significant and long-lasting effects on soil pH, carbon (C) and nitrogen (N) contents, and soil microbial activities (Post and Mann Citation1990; Murty et al. Citation2002), and consequently can have a significant impact on GHG emission from the soil (Iqbal et al. Citation2008). Generally, forest soils have a large amount of annual soil organic matter (SOM) input. Grassland soils, affected by weeding or grazing, have a small amount of SOM. Orchard soils under long-term fertilization have a large amount of soil nutrients. Numerous studies have shown that land-use type is a critical controlling factor for GHG fluxes (Lin et al. Citation2010; Lang et al. Citation2011). However, the majority of the previous studies determining the fluxes of N2O and CO2 emissions from soils are usually based on single-location studies with one land-use type, such as paddy (Singla and Inubushi Citation2013), upland (Nagano et al. Citation2012), or forest soils (Kim et al. Citation2012). Thus, comparisons based on observations from adjacent ecosystems with different land management under the same climate and soil conditions can provide a more robust understanding of the specific effects of land-use types on GHG production.
Over the last century, reactive N emissions have increased three- to five-fold (Denman et al. Citation2007), and its emissions and deposition worldwide are projected to increase by 50–100% by 2030, with the largest increase occurring over East and South Asia (Reay et al. Citation2008). The total annual N deposition at 12 monitoring sites throughout Japan ranged from 3.1 to 18.2 kg N ha–1 yr–1 during 2003–2007 (Japanese Ministry of the Environment Citation2009). Increased N deposition could, in turn, increase N2O emissions by enhancing N availability in soils for microbial processes (Bowden et al. Citation1991; Butterbach-Bahl et al. Citation1997). In the available reports, N deposition into soils has shown variable effects on soil CO2 emissions, including an increase (Brumme and Beese Citation1992), a decrease (Janssens et al. Citation2010) and unchanged (Micks et al. Citation2004), but the controlling factors are still not clear. Understanding soil respiration under a N-abundant environment is critical because relatively small changes in respiration rates may dramatically alter atmospheric CO2 concentrations as well as soil C sequestration rates (Bowden et al. Citation2004).
The objectives of this study were to investigate GHG production as affected by land-use types and N inputs together under aerobic experimental conditions, and to find factors influencing the responses of N2O and CO2 productions to these treatments. This study was conducted using soils exposed to three land-use types (apple orchard subjected to intensive agriculture, non-agricultural grassland, and unmanaged deciduous forest) located adjacent to each other to eliminate confounding effects such as climatic conditions and soil types.
MATERIALS AND METHODS
Study site and soil sampling
Soils (0–10 cm) were collected from the Environmental Horticulture and Forestry Experimental Farm of Chiba University (36°36'N, 139°00'E, 780–810 m a.s.l.) Gunma Prefecture, Central Japan, in May 2011. The mean annual temperature and precipitation in this area from 2007 to 2011 were 12.2°C and 1244 mm, respectively (Japan Meteorological Agency Citation2012).
Three adjacent lands (apple orchard, grassland, and deciduous broad-leaved forest: hereafter referred to as A, G and F, respectively) were selected as soil sampling sites. The A soil was treated with orchard fertilizer containing 12% N, 10% potassium (K), 6% phosphorus (P), 3% magnesium (Mg) and 0.4% boron (B) at ca. 400 kg ha–1 once a year at the end of April (JA Higashinihon Kumiai Shiryou Ltd., Gunma, Japan). Weeding under the apple trees in A and at the G land-use type was done once a month during the growing season. The F soil, which was unmanaged, was dominated by Quercus serrata Murray, Castanea crenata Siebold et Zucc., and Magnolia obovata Thunb. Soils in the three lands were classified as Andosols (FAO/UNESCO Soil Taxonomy), which is the dominant surface soil in upland regions of Japan (Wada Citation1986). Collected soils were sieved to 2 mm to remove pebbles and plant debris.
Analysis of chemical and microbial properties of soils
Air-dried soil (10 g) was mixed with 25 mL and 50 mL distilled water respectively to measure soil pH and electrical conductivity (EC). Soil total carbon (TC) and total nitrogen (TN) were measured after combustion using a CN analyzer (MT-700, Yanaco Analytical Instruments Co., Kyoto, Japan). For soil inorganic N (SIN) measurements, 15 g fresh soil samples were extracted with 50 mL of 1 mol L–1 potassium chloride. Soil nitrate nitrogen (NO3–-N) and ammonium nitrogen (NH4+-N) concentrations were then analyzed colorimetrically, using a spectrophotometer (UV-1200V, Shimadzu Co., Kyoto, Japan), by the hydrazine reduction method (Kamphake et al. Citation1967; Hayashi et al. Citation1997) and Berthelot reaction (salicylate-nitroprusside-hypochlorite method, Searle Citation1984; Anderson and Ingram Citation1993), respectively. Soluble organic carbon (SOC) and soluble nitrogen (SN) were extracted from a fresh soil sample of 15 g with 50 mL of 0.5 mol L–1 potassium sulfate. Concentrations of SOC and SN were then determined using a TOC analyzer (TOC-5000, Shimadzu Co.), and the hydrazine reduction method (Kamphake et al. Citation1967; Hayashi et al. Citation1997) following alkaline persulfate oxidation (Cabrera and Beare Citation1993), respectively.
Soil microbial biomass carbon (MBC) and nitrogen (MBN) were determined by the chloroform fumigation-extraction method (Brookes et al. Citation1985; Vance et al. Citation1987). Contents of organic C and total N in the fumigated and unfumigated soils were determined by the method described above for SOC and SN. A factor of 2.22 was used as efficiencies of both microbial biomass C and N extractions (Jenkinson et al. Citation2004).
Determination of N2O and CO2 production rates and N mineralization rate of soils
A laboratory incubation experiment was conducted to evaluate the effects of N addition on N2O and CO2 production potentials simultaneously in the three land-use types. Soils from each land-use type were treated without N addition (N0), with 3.3 mg N kg–1 dry soil (d.s.) 4 weeks–1 (equivalent to 30 kg N ha–1 yr–1) (N30), and with 16.5 mg N kg–1 d.s. 4 weeks–1 (equivalent to 150 kg N ha–1 yr–1) (N150). The ammonium nitrate (NH4NO3) solution was supplemented as a N source and it was applied equally in three split doses to simulate repeating N deposition in the fields with an interval of four weeks. The amounts of N applied in this study were about 3 and 15 times higher than the annual N deposition based on the bulk precipitation 30 km east of the sampling sites (Ohrui and Mitchell Citation1997).
Prior to incubation, the water-holding capacities of each soil were adjusted to 60%. A 15-g sample of each soil was transferred into a 100-mL glass bottle with nine replicates, and then all bottles were sealed with butyl rubber stoppers and incubated at 25°C in the dark for 12 weeks. Production rates of N2O and CO2 were measured weekly, and the stopper was removed from the bottle for 3 h of ventilation after each gas sampling. After four weeks incubation, three bottles were used to determine various soil properties, and then the remaining six replicates had the same doses of NH4NO3 added, and were further incubated in the same conditions. Three replicates among the six were used for the measurement of soil properties at the end of 8 weeks’ incubation. After this, the last three replicates were again treated with the same doses of NH4NO3 and kept in the same incubated conditions for measurements of GHG productions and soil properties.
Concentrations of N2O and CO2 were measured using gas chromatographs (GC-14B, Shimadzu Co.) equipped with an electron capture detector and thermal conductivity detector, respectively. Cumulative GHG production was calculated as the sum of the GHG production rate from each week. The amount of net N mineralization (NM) was determined using the equation:
Statistical analysis
The effects of land-use type and N treatment on the cumulative N2O and CO2 production potentials were examined using the multivariate analysis of variance (MANOVA). Tukey’s highly significant difference (HSD) test was used to identify differences among means, and Pearson’s correlation was applied to examine the relationships between the cumulative GHG productions and soil properties. Stepwise multiple regression analysis was conducted to find out the main factors influencing cumulative N2O and CO2 production potentials. All statistical analyses were performed using SPSS Statistics 20 (IBM, New York, USA).
RESULTS
Production rates of N2O and CO2 in soils
In the A soils, the temporal pattern of the N2O production rate was characterized by the highest rate during the first week, decreased gradually to week 6, and then remained nearly constant during weeks 7–12 (). The N2O production rate in G and F soils fluctuated and remained nearly constant during the whole incubation period, except for G N150 during weeks 1–4 as well as F N150 in the first week ( and ).
Figure 1 Changes in nitrous oxide (N2O) and carbon dioxide (CO2) production in response to three levels of nitrogen (N) addition. Bars indicate the standard error (n = 3). A, G and F indicate apple orchard soil, grassland soil and forest soil, respectively. N0, N30 and N150 indicate N addition levels of 0, 30 and 150 kg N ha–1 yr–1, respectively. Arrows indicate the time of solution addition. N2O-N, nitrous oxide-nitrogen; CO2-C, carbon dioxide-carbon.
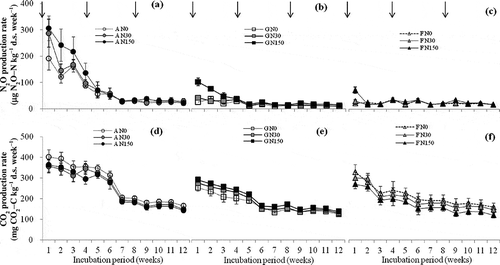
The production rate of CO2 in the A soils was relatively high during weeks 1–6, after which it decreased and remained stable from weeks 7–12 (). The CO2 production for the G and F soils reached the highest rate during week 1 and then decreased gradually through week 12 ( and f). The CO2 production rate tended to decrease with increasing N for the A and F soils (Fig. and f), while it tended to increase for the G soils ().
Cumulative production potentials of N2O and CO2 in soils
Land-use types and N treatments had significant impacts on the cumulative production of N2O (p < 0.001) ( and ). In soils without N addition, the cumulative N2O production in the A soils [0.86 mg nitrous oxide-nitrogen (N2O-N) kg–1 d.s. 12 weeks–1] was 4.1 and 3.3 times higher than those in the G soils (0.21 mg N2O-N kg–1 d.s. 12 weeks–1) and the F soils (0.26 mg N2O-N kg–1 d.s. 12 weeks–1), respectively (). The cumulative production of N2O in all studied soils tended to increase with increasing N doses (). The A soils significantly responded to N additions, being highest in the N150 treatment (p < 0.05) ().
Table 1 General linear model analysis of the effects of land use type and nitrogen (N) addition treatment on cumulative nitrous oxide (N2O) and carbon dioxide (CO2) production during 12 weeks of incubation (n = 3)
Figure 2 Cumulative nitrous oxide (N2O) and carbon dioxide (CO2) production by soils collected from areas subjected to different land uses during 12 weeks of incubation under three levels of nitrogen (N) addition. Bars indicate the standard error (n = 3). Different letters indicate significant differences at p < 0.05 as determined by Tukey’s highly significant difference (HSD) test. A, apple orchard soil; G, grassland soil; F, forest soil; N0, N30 and N150 indicate N addition levels of 0, 30 and 150 kg N ha–1 yr–1, respectively. N2O-N, nitrous oxide-nitrogen; CO2-C, carbon dioxide-carbon.
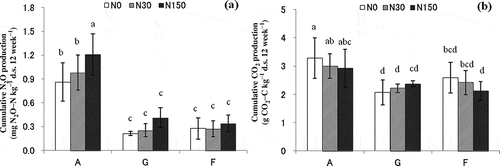
Land-use types also showed a significant impact on the cumulative production of CO2 (p < 0.001) ( and ). In soils subjected to the N0 treatment, the cumulative CO2 production of the A soils [3.3 g carbon dioxide carbon (CO2-C) kg–1 d.s. 12 weeks–1] was 1.6 and 1.3 times higher than that of the G soils (2.1 g CO2-C kg–1 d.s. 12 weeks–1) and F soils (2.6 g CO2-C kg–1 d.s. 12 weeks–1), respectively. On the other hand, N addition did not significantly affect the cumulative CO2 production (p > 0.05) throughout the 12-week incubation period ().
Relationships between N2O and CO2 production and soil properties
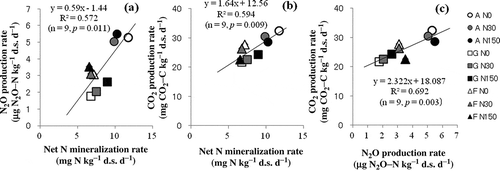
shows the Pearson correlation coefficients between cumulative N2O and CO2 production (N0 group), and some of the soil properties measured before incubation. Cumulative N2O and CO2 production exhibited a significant positive correlation with SIN, SN and EC and a negative correlation with soil pH and TC (). The mean production rates of N2O and CO2 in each land-use type had a significant positive correlation with the mean net N mineralization rate for all treatments ( and ). Furthermore, a positive correlation between CO2 and N2O production rate was detected (R2 = 0.692, p = 0.003, ), which is consistent with the study of Chen et al. (Citation2012) who also observed a significant positive correlation between CO2 flux and N2O flux in situ. However, the key soil parameters affecting the both GHG productions were different. The stepwise multiple regression analyses showed that among all measured soil parameters, the concentrations of NH4+-N and the MBC/MBN ratio significantly affected N2O production, while significant parameters influencing the cumulative CO2 production were NO3–-N content and SOC. The regression models for both cumulative productions were: N2O = 0.577 + 0.167 NH4+-N – 0.025 MBC/MBN (R2 = 0.997, p < 0.001) and CO2 = 1.18 + 0.059 NO3–-N + 0.003 SOC (R2 = 0.923, p < 0.001), respectively.
Table 2 Pearson correlation coefficients between cumulative gas productions [nitrous oxide (N2O) or carbon dioxide (CO2)] from the soils without nitrogen (N) addition and initial soil properties under the three land use types (n = 9)
Figure 3 Correlation between net nitrogen (N) mineralization rate and carbon dioxide (CO2) and nitrous oxide (N2O) production rates with three levels of N addition under three land uses. A, apple orchard soil; G, grassland soil; F, forest soil; N0, N30 and N150 indicate N addition levels of 0, 30 and 150 kg N ha–1 yr–1, respectively. N2O-N, nitrous oxide-nitrogen; CO2-C, carbon dioxide-carbon.
DISCUSSION
Effect of land-use type on production potentials of N2O and CO2
In the present study, a standardized incubation temperature (25°C) and soil moisture condition (60% water-holding capacity) was used. These are considered to be effective in reducing the masking effects of soil temperature and water conditions on N2O and CO2 production, enabling the effects of other soil factors to be determined (Gödde and Conrad Citation2000). The reason for the largest N2O production in orchard soils might be the high initial mineral N levels according to chronic fertilizer application in the fields, which is considered a key factor influencing N2O emissions (Robertson et al. Citation2000; Mathieu et al. Citation2006). Land use types may directly alter soil properties, especially the biological properties (Merino et al. Citation2004), and thus indirectly affect GHG emission (Ishizuka et al. Citation2002). In turn, the correlation analysis between both cumulative GHG productions and the soil properties could become a carrier; this could indirectly reflect the impact of land-use types on both N2O and CO2 emissions. For example, chronic fertilizer use in the orchard fields resulted in significant decreases of soil pH and TC but an increase in soil EC (). Inubushi et al. (Citation1996) suggested that at 60% water-holding capacities, ~90% of N2O production was derived from nitrification. Hence, it was suggested that nitrification, the oxidation of ammonium to nitrate, should be a more dominant process of soil N2O production in the present study. The stepwise multiple regression analysis also indicated that NH4+-N concentration in soil was the key contributing factor, accounting for 98.3% variation to N2O production. Martikainen and De Boer (Citation1993) suggested, from an aerobic incubation study with forest soils, that N2O production associated with soil nitrification would decrease when the pH is increased from 4 to 6. The present study agreed with this point, and a negative correlation between soil pH and cumulative N2O production was observed among the three land-use types (). Under incubation conditions, soil CO2 emissions are mainly caused by microbial respiration (Janssens et al. Citation2001), which is primarily controlled by the supply of readily decomposable SOM (Rustad et al. Citation2000). Land-use types could directly affect the concentrations of soil SIN and SOC (), and consequently affect soil CO2 productions. The stepwise multiple regression analysis showed that soil NO3–-N and SOC content were the key contributing factors, accounting for 75.4% and 16.9% of the variations in CO2 production, respectively.
Table 3 Chemical and microbial properties of initial soils at the three experimental sites
Intensive soil management has led to a considerable increase in the rates of GHG exchange between soils and the atmosphere (Bouwman Citation1990). Conversely, less intensive management improves biological properties (Emmerling et al. Citation2001), and conversion of agricultural land to grassland and forest usually results in considerable gains in soil microbial biomass and reductions in N2O and CO2 production (Paul et al. Citation2002). Agricultural soils often have higher CO2 emissions than soils under native vegetation (Iqbal et al. Citation2010). Conversion from woodland to orchard could significantly increase soil CO2 emissions (Iqbal et al. Citation2008) and CO2 emissions from orchard soils have been found to be higher than those from forest soils (H. Liu et al. Citation2008). The present results also showed this as the apple orchard was subjected to intensive management and had higher soil cumulative N2O and CO2 production potentials than non-agricultural grassland and unmanaged forest (p < 0.001) ( and ). On the other hand, the orchard soils showed higher metabolic quotients (qCO2) than the G and F soils (p < 0.05) (Table S1). This indicated that agricultural soils had substantial effects on soil microbial biomass C utilization efficiency under experimental conditions.
Combined effects of N addition and land-use type on the production potentials of N2O and CO2
Many studies, including the present one, have suggested that N addition is a key parameter that enhances the exchange rate of N2O between soil and the atmosphere (Butterbach-Bahl et al. Citation1997; Ullah and Zinati Citation2006; Li et al. Citation2012). Liu and Greaver (Citation2009) reported that the addition of N at rates of 10 to 562 kg N ha–1 yr–1 significantly increased soil N2O emissions by an average of 216% across agricultural and non-agricultural ecosystems. Soil N2O production was not only related to the rates of nitrification and denitrification, but also to soil N status and soil C/N ratio (Dise et al. Citation1998; Zhang et al. Citation2009). For the A soil with a lower soil C/N ratio (), N2O production significantly increased with the N150 addition rate (p < 0.05) () but the G soil that also had a lower C/N ratio did not exhibit a significant increase with N addition (). In addition, in the F soil with a higher soil C/N ratio (), N addition did not significantly affect N2O production (). SIN and SN are important sources of available N in the soil N pool (Denman et al. Citation2007), having large dynamics before and after incubation ( and Table S1). On the other hand, the present study observed positive correlations between the cumulative N2O production and soil SIN and SN (), which is in accordance with Zhang et al. (Citation2009). Considering these points, the conversion factor of N2O from SIN as defined in was calculated to explore the role of available N during N2O production. In the N0 group, the conversion factor of N2O/SIN in the A soil was a little lower than that in G and F soils, but in the N30 and N150 groups, the conversion factor in the A soil was significant higher than in G and F soils (). This suggested that N2O production was more sensitively affected by N additions in the A soil having initial higher SIN concentrations () than in G and F soils (). The added mineral N in the G and F soils, having lower initial concentrations of SIN and SN, was generally immobilized by microbes as their metabolic materials (Janssen Citation1996). Thus, the remaining N was not sufficient to increase soil N availability, and could not lead to the increases in N mineralization, nitrification or denitrification, and consequently it was not enough to influence the N2O production rate (Bowden et al. Citation1991).
Table 4 Nitrous oxide (N2O) conversion factor according to soil inorganic nitrogen (N) under three land-use types
Figure 4 Regression analyses between cumulative nitrous oxide (N2O) production and nitrogen (N) addition. A, G and F indicate apple orchard soil, grassland soil and forest soil, respectively. N2O-N, nitrous oxide-nitrogen.
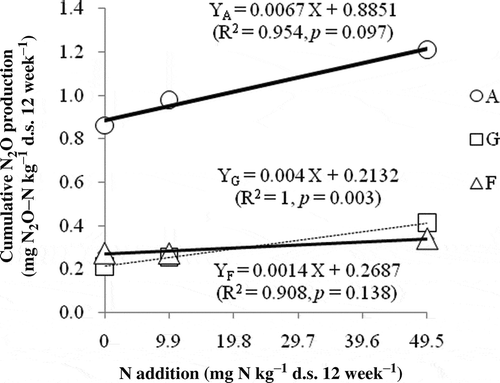
In the A soil, during weeks 1–4, N2O production rate was enhanced by N addition rates significantly (p < 0.05); the cumulative N2O production amount in this period contributed almost 50% of that of the entire incubation period (). In the present study, soil organic matter such as SOC, microbial biomass (e.g., MBC and MBN) and NH4+-N decreased gradually with incubation time ( and Table S1), which was in accordance with the study of Lang et al. . The first instance of N fertilization in the A soil could be rapidly increasing the available N for nitrifying and denitrifying microorganisms (Davidson et al. Citation2000; Nishina et al. Citation2009), and thus increasing N2O production significantly. With the incubation time, interacting with N addition, N2O production in the A soil did not increase significantly after the second and third N additions (). These results indicated that the rates of organic matter decomposition, microbial activity and N mineralization were fast in the first six weeks of the laboratory incubation experiment; after this period, soil microbial activity and N transformation may have reached an equilibrium, so that N additions did not significantly increase N2O production any more.
The effect of N addition on CO2 emission was unknown in different land-use types and ecosystems. Li et al. (Citation2012) reported that elevated N deposition led to a significant increase in the emission of CO2 during the growing season in an alpine grassland. Litton et al. (Citation2007) reported that increased N deposition could reduce allocation to fine roots and then reduce soil respiration rates (Janssens et al. Citation2010). Additionally, Ambus and Robertson (Citation2006) showed that CO2 efflux was not affected by increased N inputs in an unmanaged forest and grassland. In this study, laboratory incubation of root-free soil showed that heterotrophic respiration from the microbial community in the A and F soils was reduced with N additions ( and f), while it was increased in the G soil (). Significant differences caused by short-term N additions were not observed in the aerobic incubation conditions (). Similar dynamical trends were also found for qCO2 (Table S1), indicating N addition had no significant effects on soil microbial biomass C utilization efficiency. N inputs can reduce the amount of soil microorganisms and their activities (Compton et al. Citation2004; Frey et al. Citation2004), and thus restrict CO2 production from the A and F soils. Some studies considered that N additions would increase N mineralization rate and thus promote CO2 emission (Hobbie Citation2000). Similar findings were found in the G soil in that N mineralization rate () increased with the N addition dose associated with higher CO2 production. A nearly equal ratio of soil MBC/MBN from A and F soils () may indicate their similar microbial flora, the rates of microbial N and C turnover and thus similar response of CO2 to N addition (). Therefore, further studies on soil microbial flora and the situ field conditions under the three land-use types are suggested.
CONCLUSION
Land-use type significantly influenced the cumulative production potentials of N2O and CO2 through its effects on soil biological and biochemical properties (p < 0.001). Apple orchard soils that were subjected to intensive agricultural techniques showed significantly increased production potentials of the two major GHGs relative to soils from a non-agricultural grassland and unmanaged mixed forest soils. Furthermore, the response of N2O production to N addition was likely due to the soil available N status, especially at the early stages of N addition, and was relatively larger in apple orchard soil that received fertilizer N than in the other two land-use soils. Soil CO2 production exhibited various responses to additional N, and increased in grassland soils but decreased in the apple orchard and forest soils. The soil N mineralization process, i.e., organic matter decomposition, accounted for the majority of N2O and CO2 production under the aerobic incubation conditions in all land-use soils.
SUPPLEMENTARY MATERIAL
Supplementary material for this article is available online from http://dx.doi.org/10.1080/00380768.2013.817938
Table S1 Chemical and microbial properties of studied soils after 12 weeks of incubation (n = 3)
Download MS Word (52.5 KB)ACKNOWLEDGMENTS
This study was supported in part by a Grant-in-Aid for Young Scientists (B) (No. 22780150). The first author thanks the Ministry of Education, Culture, Sports, Science and Technology, Japan, for providing financial support. The authors also thank Dr. A. Takenaka of the National Institute for Environmental Studies, Japan, for providing information regarding the dominant plant species in the forest. Finally, we thank Mr. J. Hara of Chiba University, Japan, for providing the field fertilization information.
REFERENCES
- Ambus P, Robertson GP 2006: The effect of increased N deposition on nitrous oxide, methane and carbon dioxide fluxes from unmanaged forest and grassland communities in Michigan. Biogeochem., 79, 315–337.
- Anderson JM, Ingram JSI 1993: Colorimetric determination of ammonium. In Tropical Soil Biology and Fertility: A Handbook of Methods, Eds. Anderson JM, Ingram JSI, pp. 42–43. CAB International, Wallingford.
- Bouwman AF 1990: Exchange of greenhouse gases between terrestrial ecosystems and the atmosphere. In Soils and the Green House Effect, Ed. Bouwman AF, pp. 61–127. Wiley-Blackwell, Chichester.
- Bowden RD, Davidson E, Savage K, Arabia C, Steudler P 2004: Chronic nitrogen additions reduce total soil respiration and microbial respiration in temperate forest soils at the Harvard. For. Ecol. Manage., 196, 43–56.
- Bowden RD, Melillo JM, Steudler PA, Aber JD 1991: Effects of nitrogen additions on annual nitrous oxide fluxes from temperate forest soils in the Northeastern United States. J. Geophys. Res., 96, 9321–9328.
- Brookes PC, Landman A, Pruden G, Jenkinson DS 1985: Chloroform fumigation and the release of soil nitrogen: A rapid direct extraction method to measure microbial biomass nitrogen in soil. Soil Biol. Biochem., 17, 837–842.
- Brumme R, Beese F 1992: Effects of liming and nitrogen fertilization on emissions of CO2 and N2O from a temporate forest. J. Geophys. Res., 97, 12851–12858.
- Butterbach-Bahl K, Gasche R, Breuer L, Papen H 1997: Fluxes of NO and N2O from temperate forest soils: Impact of forest type, N deposition and of liming on the NO and N2O emissions. Nutr. Cycling Agroecosyst., 48, 79–90.
- Cabrera ML, Beare MH 1993: Alkaline persulfate oxidation for determining total nitrogen in microbial biomass extracts. Soil Sci. Soc. Am. J., 57, 1007–1012.
- Chen GC, Tam NFY, Ye Y 2012: Spatial and seasonal variations of atmospheric N2O and CO2 fluxes from a subtropical mangrove swamp and their relationships with soil characteristics. Soil Biol. Biochem., 48, 175–181.
- Compton JE, Watrud LS, Porteous LA, DeGrood S 2004: Response of soil microbial biomass and community composition to chronic nitrogen additions at Harvard forest. For. Ecol. Manage., 196, 143–158.
- Davidson EA, Keller M, Ericson HE, Verchot LV 2000: Testing a conceptual model of soil emission of nitrous and nitric oxides. Biosci., 50, 667–680.
- Denman KL, Brasseur G, Chidthaisong A et al. 2007: Couplings Between Changes in the Climate Systemand Biogeochemistry. In Climate Change 2007: The Physical Science Basis. Contribution of Working Group I to the Fourth Assessment Report of the Intergovernmental Panel on Climate Change, Eds. Solomon S, Qin D, Manning M, Chen Z, Marquis M, Averyt KB, Tignor M and Miller HL, pp. 544–547. Cambridge University Press, Cambridge and New York, NY.
- Dise NB, Matzner E, Forsius M 1998: Evaluation of organic horizon C: N ratios as an indicator of nitrate leaching in conifer forests across Europe. Environ. Pollut., 102, 453–456.
- Emmerling C, Edelhoven T, Schröder D 2001: Response of soil microbial biomass and activity to agricultural de-intensification over a 10 year period. Soil Biol. Biochem., 33, 2105–2114.
- Forster P, Ramaswamy V, Artaxo P et al. 2007: Changes in Atmospheric Constituents and in Radiative Forcing. In Climate Change 2007: The Physical Science Basis. Contribution of Working Group I to the Fourth Assessment Report of the Intergovernmental Panel on Climate Change, Eds. Solomon S, Qin D, Manning M, Chen Z, Marquis M, Averyt KB, Tignor M and Miller HL, pp. 201–215. Cambridge University Press, Cambridge and New York, NY.
- Frey S D, Knorr M, Parrent JL, Simpson RT 2004: Chronic nitrogen enrichment affects the structure and function of the soil microbial community in temperate hardwood and pine forests. For. Ecol. Manage., 196, 159–171.
- Gödde M, Conrad R 2000: Influence of soil properties on the turnover of nitric oxide and nitrous oxide by nitrification and denitrification at constant temperature and moisture. Biol. Fertil. Soils, 32, 120–128.
- Hayashi A, Sakamoto K, Yoshida T 1997: A rapid method for determination of nitrite in soil by hydrazine reduction produce. Jpn. J. Soil Sci. Plant Nutr., 68, 322–326 (in Japanese with English abstract).
- Hobbie SE 2000: Interactions between lignin and soil nitrogen availability during leaf litter decomposition in a Hawaiian montane forest. Ecosystems, 3, 484–494.
- Inubushi K, Naganuma H, Kitarohara, 1996: Contribution of denitrification and autotrophic and heterotrophic nitrification to nitrous oxide production in andosols. Biol. Fertil. Soils, 23, 292–298.
- IPCC (Intergovernmental Panel on Climate Change) 2007: Climate Change 2007: Synthesis Report. Contribution of Working Groups I, II and III to the Fourth Assessment Report of the Intergovernmental Panel on Climate Change, Eds. Core Writing Team, Pachauri RK, Reisinger, A. IPCC, Switzerland, Geneva.
- Iqbal J, Hu R, Feng M, Lin S, Malghani S, Ali IM 2010: Microbial biomass, and dissolved organic carbon and nitrogen strongly affect soil respiration in different land uses: A case study at Three Gorges Reservoir Area, South China. Agric. Ecosyst. Environ., 137, 294–307.
- Iqbal J, Ronggui H, Lijun D, Lan L, Shan L, Tao C, Leilei R 2008: Differences in soil CO2 flux between different land use types in mid-subtropical China. Soil Biol. Biochem., 40, 2324–2333.
- Ishizuka S, Tsuruta H, Murdiyarso D 2002: An intensive field study on CO2, CH4 and N2O emissions from soils at four land-use types in Sumatra, Indonesia. Global Biogeochem. Cycles, 16, 1049–1059.
- Janssen BH 1996: Nitrogen mineralization in relation to C-N ratio and decomposability of organic materials. Plant Soil, 181, 39–45.
- Janssens IA, DielemanW, Luyssaert S, Subke J-A, Reichstein M, Ceulemans R 2010: Reduction of forest soil respiration in response to nitrogen deposition. Nature Geosci., 3, 315–322.
- Janssens IA, Lankreijer H, Matteucci G et al. 2001: Productivity overshadows temperature in determining soil and ecosystem respiration across European forests. Global Change Biol., 7, 269–278.
- Japan Meteorological Agency 2012: Climate Statistics. http://www.jma.go.jp/jma/en/menu.html (July, 2013).
- Japanese Ministry of the Environment 2009: Report of the Long Term National Acid Deposition Monitoring in Japan (JFY 2003–2007), Ministry of the Environment, Government of Japan, Tokyo.
- Jenkinson DS, Brookes PC, Powlson DS 2004: Measuring soil microbial biomass (short survey). Soil Biol. Biochem., 36, 5–7.
- Kamphake LJ, Hannah SH, Cohen JM 1967: Automated analysis for nitrate by hydrazine reduction. Water Res., 1, 205–216.
- Kim YS, Imori M, Watanabe M, Hatano R, Yi MJ, Koike T 2012: Simulated nitrogen inputs influence methane and nitrous oxide fluxes from a young larch plantation in northern Japan. Atmos. Environ., 46, 36–44.
- Lang M, Cai ZC, Chang SX 2011: Effects of land use type and incubation temperature on greenhouse gas emissions from Chinese and Canadian soils. J. Soils Sediments, 11, 15–24.
- Li K, Gong Y, Song W, He G, Hu Y, Tian C, Liu X 2012: Responses of CH4, CO2 and N2O fluxes to increasing nitrogen deposition in alpine grassland of the Tianshan Mountains. Chemosphere, 88, 140–143.
- Lin S, Iqbal J, Hu R, Feng M 2010: N2O emissions from different land uses in mid-subtropical China. Agri. Ecosys. Environ., 136, 40–48.
- Litton CM, Raich JW, Ryan MG 2007: Carbon allocation in forest ecosystems. Global Change Biol., 13, 2089–2109.
- Liu H, Zhao P, Lu P, Wang YS, Lin YB, Rao XQ 2008: Greenhouse gas fluxes from soils of different land-use types in a hilly area of South China. Agric. Ecosyst. Environ., 124, 125–135.
- Liu L, Greaver TL 2009: A review of nitrogen enrichment effects on three biogenic GHGs: The CO2 sink may be largely offset by stimulated N2O and CH4 emission. Ecol. Lett., 12, 1103–1117.
- Martikainen PJ, De Boer W 1993: Nitrous oxide production and nitrification in acidic soil from a Dutch coniferous forest. Soil Biol. Biochem., 25, 343–347.
- Mathieu O, Lévêque J, Hénault C, Milloux MJ, Bizouard F, Andreux F 2006: Emissions and spatial variability of N2O, N2 and nitrous oxide mole fraction at the field scale, revealed with 15N isotopic techniques. Soil Biol. Biochem., 38, 941–951.
- Merino A, Pérez-Batallón P, Macías F 2004: Responses of soil organic matter and greenhouse gas fluxes to soil management and land use changes in a humid temperate region of southern Europe. Soil Biol. Biochem., 36, 917–925.
- Micks P, Aber JD, Boone RD, Davidson EA 2004: Short-term soil respiration and nitrogen immobilization response to nitrogen applications in control and nitrogen-enriched temperate forests. For. Ecol. Manage., 196, 57–70.
- Murty D, Kirschbaum MUF, McMurtrie RE, McGilvray A 2002: Does conversion of forest to agricultural land change soil carbon and nitrogen? A review of the literature. Global Change Biol., 8, 105–123.
- Nagano H, Kato S, Ohkubo S, Inubushi K 2012: Emissions of carbon dioxide, methane, and nitrous oxide from short- and long-term organic farming Andosols in central Japan. Soil Sci. Plant Nutr., 58, 793–801.
- Nishina K, Takenaka C, Ishizuka S 2009: Relationship between N2O and NO emission potentials and soil properties in Japanese forest soils. Soil Sci. Plant Nutr., 55, 203–214.
- Ohrui K, Mitchell MJ 1997: Nitrogen saturation in Japanese forested watersheds. Ecol. Appl., 7, 391–401.
- Paul KI, Polglase PJ, Nyakuengama JG, Khanna PK 2002: Change in soil carbon following afforestation. For. Ecol. Manage., 168, 241–257.
- Post WM, Mann LK 1990: Changes in soil organic carbon and nitrogen as a result of cultivation. In Soil and the Greenhouse Effect, Ed. Bowman, AF, pp. 401–407. Wiley, New York.
- Ravishankara AR, Daniel JS, Portmann RW 2009: Nitrous oxide (N2O): The dominant ozone-depleting substance emitted in the 21st century. Science, 326, 123–125.
- Reay DS, Dentener F, Smith P, Grace J, Feely RA 2008: Global nitrogen deposition and carbon sinks. Nature Geosci., 1, 430–437.
- Robertson GP, Paul EA, Harwood RR 2000: Greenhouse gases in intensive agriculture: Contributions of individual gases to the radiative forcing of the atmosphere. Science, 289, 1922–1925.
- Rustad LE, Huntington TG, Boone RD 2000: Controls on soil respiration: Implications for climate change. Biogeochem., 48, 1–6.
- Searle PL 1984: The Berthelot or indophenol reaction and its use in the analytical-chemistry of nitrogen: A review. Analyst., 109, 549–568.
- Singla A, Inubushi K 2013: Effect of biochar on CH4 and N2O emission from soils vegetated with paddy. Paddy Water Environ., doi: 10.1007/s10333-013-0357-3 (in press).
- Ullah S, Zinati GM 2006: Denitrification and nitrous oxide emissions from riparian forests soils exposed to prolonged nitrogen runoff. Biogeochem., 81, 252–267.
- Vance ED, Brookes PC, Jenkinson DS 1987: An extraction method for measuring soil microbial biomass-C. Soil Biol. Biochem., 19, 703–707.
- Wada K 1986: Ando soils in Japan. In Morphology and Classification, Ed. Otowa M, pp. 3–19. Kyushu University Press, Fukuoka, Japan.
- Zhang TY, Xu XK, Luo XB, Han L, Wang YH, Pan GX 2009: Effects of acetylene at low concentrations on nitrification, mineralization and microbial biomass nitrogen concentrations in forest soils. Chin. Sci. Bull., 54, 296–303.