
Abstract
Labile pools of soil organic carbon (SOC) and nitrogen (N) are affecting the carbon (C) and N fluxes in the terrestrial soils, whereas long-term C and N storage is determined by the long-lived recalcitrant fractions. Tillage and subsurface drainage influences these pools; however, the effect of these systems on poorly drained soils may be different. Therefore, the present study was conducted on a field experiment, established at the Waterman Farm of the Ohio State University in 1994. Specific objectives of the study are to assess the influence of no-tillage (NT), chisel tillage (CT) with drainage (TD) and non-drainage (ND) management under a continuous corn (Zea mays L.) system on SOC, C fractions (heavy and light), and water stable aggregates (WSA). Data from this study showed that the SOC stock for the NT was 25, 37 and 32% higher for the 0–10, 10–20 and 40–60 cm depths, respectively, as compared to that under CT system. Tillage significantly influenced the light fraction (LF) and heavy fraction (HF) of carbon. The NT system increased LF and HF by 10 and 12%, respectively, compared to CT for the 0–10 cm depth. Eighteen years of NT management decreased soil bulk density and improved macroaggregates and mean weight diameter compared to that under CT system. Drainage impacts on soil parameters were negligible, and may be partially due to the reason that the corn-corn cropping system may not have sufficiently improved the soil properties between the two tillage systems. In general, drainage improved porosity and the corn yield. It can be concluded that NT with subsurface management improves SOC dynamics and promotes aggregation and corn yield as compared to that with CT system.
INTRODUCTION
Soils managed with no-tillage (NT) alter soil organic matter (SOM), microbial populations and their functions, and availability of nutrients (Dalal et al. Citation1991; Thomas et al. Citation2007). The NT system retains residue on the soil surface and hence improves or maintains the soil organic carbon (SOC) compared to intensive tillage systems (Martino and Shaykewich Citation1994; Six et al. Citation2002; Kumar et al. Citation2012a). However, the rate of accumulation of SOC in NT soils varies with climatic conditions, amount of residue and nitrogen (N) inputs, and mineralogy of the soils. Drainage impacts corn (Zea mays L.) yield by influencing the properties of poorly-drained soils. The NT system when managed with a subsurface drainage system can improve SOC and soil properties in poorly-drained soils. Subsurface tile drainage improves aeration, increases the availability of nutrients and enhances crop productivity (Lal and Taylor Citation1970; Cannell et al. Citation1979). Further, it allows timely farm operations (Nangia et al. Citation2010b) in poorly-drained soils of the midwestern region of the USA, of which about 33% of the cultivated area is tile-drained (Power et al. Citation2000). Subsurface drainage management has now become a routine practice in the midwestern region (Nangia et al. Citation2010a).
The SOC strongly influences soil quality and productivity (Quiroga et al. Citation2006) and can be classified into labile and recalcitrant fractions based on their chemical characteristics and residence time (McLauchlan et al. Citation2006). The total SOC content and fractions of this carbon (C) are important attributes of soil quality (Gregorich et al. Citation1994). Labile pools of SOC and N affect the C and N fluxes in the terrestrial soils, whereas long-term C and N storage is determined by the long-lived recalcitrant fractions. Sequestering more C in the agricultural soils can reduce carbon dioxide (CO2) emissions to the atmosphere (Sperow et al. Citation2003), and also promotes productivity and sustainability of agricultural systems (Lal Citation2004). The flux of C is largely dominated by highly bioreactive labile C (Falloon and Smith Citation2000). Land management practices can have a strong impact on the labile and recalcitrant C pools and fluxes (Nabuurs et al. Citation2008). The labile fraction of SOC is key to interpreting changes in quality (Kapkiyai et al. Citation1999) and is more sensitive compared to SOC and N (Biederbeck et al. Citation1998). Physical fractionation of soil particles into different size classes can provide information on the importance of interaction between different organic and inorganic soil components (Christensen et al. Citation1999). The SOC associated with the sand fraction is a labile pool of C and hence influenced by land use and management (Shrestha and Lal Citation2007), whereas SOC associated with the clay fraction is more stable and is altered more by physical and chemical processes than by land use changes (Khanna et al. Citation2001).
Microbial biomass C (also considered labile C) serves as a source (mineralization) or a sink (immobilization) of labile nutrients (Hu et al. Citation1997) with a turnover time from days to years (Tedla et al. Citation2004). This microbial C is largely influenced by tillage perturbations and by soil moisture (Skopp et al. Citation1990). The soil C and N fluxes are largely dominated by the small but highly bioreactive labile pool; long-term C and N storage is often determined by the long-lived recalcitrant fraction (Trumbore et al. Citation1990). The labile pool is particularly important and exerts considerable control on ecosystem functioning. Through its impact on microbial biomass and activity and on the turnover and supply of nutrients to crops, the labile pool can alter the crop productivity (Pastor and Post Citation1986). The labile pool of SOC is an easily mineralizable fraction with rapid turnover time ranging from months to years (Krull et al. Citation2003). This labile fraction (LF) of SOM consists of micro-organisms, plant and soil fauna residing at different levels of decay and the products of their decomposition, and easily decomposable non-humic organic substances such as carbohydrates, polysaccharides, proteins, organic acids, amino acids, waxes, fatty acids and other non-specific compounds (Poirier et al. Citation2005). In the terrestrial ecosystem, SOC exits in a heterogeneous composition of a range of fractions with turnover times varying from minutes to millennia (Jagadamma and Lal Citation2010). Particulate fractions of SOM occluded into soil aggregates have longer turnover times than free fractions (Six et al. Citation2002). This fraction of C [i.e. particulate organic carbon (POC)] is mainly composed of crop residues and roots in initial stages of decomposition, and is considered a more sensitive indicator of soil and land management than the total organic carbon (TOC) (Bayer et al. Citation2001). The less oxidative environment in soils under the NT system increases the lability of SOM (Bayer et al. Citation2001; Diekow et al. Citation2005). Determination of LF fractions is used for (1) evaluation of farming efficiency, (2) comparisons of different tillage and treatments, (3) SOC sequestration measurements and (4) understanding the decomposition processes in soil and related energy and nutrient flows. The stable pool is used to describe an intermediate fraction with turnover rates in the range of a decadal to centennial time scale (Bruun et al. Citation2008). This pool has a turnover time of thousands of years.
Quantitative analysis of the labile and recalcitrant fractions of SOC can be useful for better understanding of C dynamics and their responses to tillage and drainage. Thus, this study was based on the hypothesis that tillage decreases labile pool sizes due to enhanced oxidation of labile C and reduced substrate inputs. The major goal of this study was to investigate the effects of tillage and drainage on SOC and its fractions.
MATERIALS AND METHODS
Study background and experimental design
The experimental plots were established in the summer of 1994 at the Waterman Farm of the Ohio State University, Columbus (40°02'29''N, 83°02'68''W), Ohio, USA. Soils of the experimental site are classified as Crosby silt loam (fine, mixed, mesic, Aeric Ochraqualf) (Staff Citation1996). The annual average rainfall of the area is 1016 mm, and annual average air temperature is 11°C.
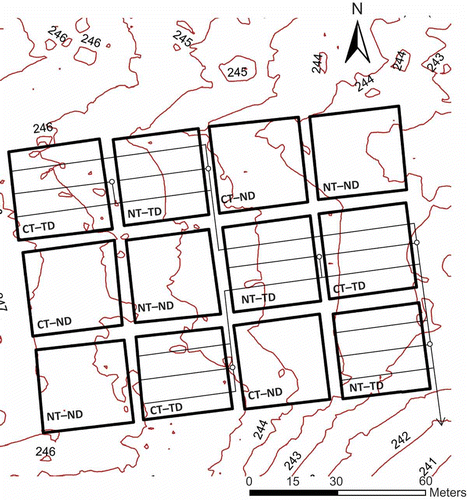
The study design was a factorial experiment which consisted of two tillage (no-till, NT and chisel-till, CT) factors and two drainage (tile-drainage, TD and non-drainage, ND) levels. Twelve research plots of 27.4 × 27.4 m size were divided into six pairs of CT and NT with each replication block containing four plots. These triplicate plots were separated by a 6.1-m grass driveway on all sides (). Treatments included: NT-TD, NT-ND, CT-TD and CT-ND. The CT consisted of fall chisel plowing to a depth of about 20 cm, and spring disking to prepare the seedbed for planting. The experimental site is under continuous corn. This research site has 12 plots and is laid out as a randomized block design. N, potassium (K) and phosphorus (P) fertilizers were applied at the rate of 168 kg N ha−1, 224 kg K ha−1 and 112 kg P ha−1, respectively. Subsurface drainage was installed using perforated corrugated plastic tubing (Sullivan Citation1997). The subsurface drainage tiles were 0.10 m in diameter and installed about 0.75 m deep, and 9.1 m apart with tiles flowing from west to east (Sullivan Citation1997).
Figure 1 The experimental design showing different treatments including no-till (NT) and chisel-till (CT) under drainage (TD) and non-drainage (ND) systems at the Waterman Farm of Ohio State University, Columbus, OH.
Soil sampling and analysis
Soil sampling was carried out during early March 2012 before corn planting. The bulk soil samples were collected using a metallic auger at 0–10, 10–20, 20–40 and 40–60 cm depths for determining the particle size fractionation of SOC, and SOC and N concentrations. Additionally, intact core samples (n = 48) were also collected for determining the soil bulk density from the same soil. Disturbed soil samples were collected using shovel from the 0–10 and 10–20 cm depths for measuring aggregate size distribution and microbial biomass carbon (MBC). All biological determinations were performed within one week of soil sampling.
Soil bulk density was determined by the core method (Grossman and Reinsch Citation2002). SOC and N concentration was determined by the dry combustion method (900°C) using a Vario Max CN Elementer Analyzer Inc., Hanau, Germany (Chintala et al. Citation2013). The pH of the soil ranged from 5.3 to 5.5 and calcium carbonate (CaCO3) of samples was about 0.1%. Therefore, soil inorganic carbon was ignored and total C was considered as the SOC. The SOC stocks were estimated based on an equivalent soil mass-depth basis to correct for differences in bulk density among the treatments (Ellert et al. Citation2002).
The contents of the light fraction (LF) and the heavy fraction (HF) were determined for the 0–10, 10–20, 20–40 and 40–60 cm depths. Ten-gram aliquots of air-dried soil was dispersed in sodium iodide solution (0.2M Na-hexametaphosphate) (1.60 g cm−3) and centrifuged at 2600 g (Spycher et al. Citation1983). Material in the sediment was considered to be the HF (more fully decomposed residues and mineral material) and material in the supernatant was considered to be the LF (mostly partially decomposed plant residues). The LF was filtered and dried at 60°C for 3–4 days. The C and N contents in the LF (LFC and LFN, respectively) were measured by dry combustion with a C/N analyzer. The C and N contents in the HF (HF-C and HF-N, respectively) were determined by subtraction of LF-C and LF-N from TC and TN. The approach used was similar to that of Kadono et al. (Citation2009).
The MBC for 0–10 and 10–20 cm depths from all the plots were determined by the chloroform-fumigation-extraction method (Vance et al. Citation1987). Briefly, three 10-g samples (one as a control, one as a fumigated, and the third used for moisture content) of field moist soil, sieved through a 6.75-mm sieve, were used from each sample. The fumigated samples were placed in a vacuum desiccator with approximately 50 mL of chloroform (CHCl3). The desiccator was evacuated until the chloroform bubbled for 1 min. The desiccator was then sealed and the samples were left in the desiccator for 24 h. Following the fumigation, the samples were extracted by placing them in 250-mL plastic bottles with 80 ml of 0.5M potassium sulfate (K2SO4). The bottles were then shaken in the floor shaker for 1 h. The shaken samples were centrifuged for 5 min and the supernatant was passed through a 0.45-μm syringe filter. Control samples were extracted using the same process, but were not fumigated. Two analytical replicates were analyzed for each sampling date, and blanks were prepared with each replicate. Filtered samples were frozen in 50-mL centrifuge tubes for analyzing the TOC. The MBC was calculated using equations from the method of Voroney et al. (Citation1993). All soil weights were corrected for moisture content. Total weight of extractable C in the fumigated (OCF) and un-fumigated (OCUF) soil samples was calculated as follows:
where VS is the volume of the extractant solution in mL, and MS is the mass of soil solution in g.
The MBC in the soil can be calculated as follows:
The microbial biomass C was measured for the 0–10 and 10–20 cm depths for all four treatments.
Statistical analysis
Analysis of variance (ANOVA) was performed using the SAS statistical software (SAS Institute, Cary, NC) (SAS Citation2007) to test the main effects of tillage and drainage, and interactions of tillage by drainage on soil parameters. Least significant differences were also determined using the PROC (Procedure) GLM (General Linear Model) procedure. All statistical tests were made at α = 0.05 significance level.
RESULTS AND DISCUSSION
Soil organic carbon, total nitrogen and C/N ratio
Tillage significantly influenced SOC for all depths (0–10, 10–20 and 40–60 cm) except 20–40 cm ( and ). Drainage also influenced the SOC but only for the 40–60 cm depth. Interactions of tillage by drainage were observed for the 20–40 and 40–60 cm depths only ( and ). Data show that SOC (g kg−1) was significantly higher for the soils under NT as compared to that under soils of CT for the 0–10 and 10–20 cm depths. The SOC for the NT system was 22 and 39% higher for the 0–10 and 10–20 cm depths, respectively, compared to that under CT system. For the 20–40 cm depth, SOC was numerically higher for the CT system; however, it was significantly higher for the NT system for the 40–60 cm depth compared to that under the CT system (). Drainage did not influence SOC at any depth except at the 40–60 cm. However, plots without sub-surface management (undrained) increased SOC by 12.5, 13.8 and 28.2% compared to those with sub-surface management (drained) for the 0–10, 10–20 and 40–60 cm depths.
Table 1 Soil organic carbon (SOC) and total nitrogen (TN) concentrations influenced by long-term no-till and chisel-till under drainage and non-drainage systems for the 0–10 and 10–20 cm depths, and analysis of variance
Tillage influenced the TN only for the 10–20 cm depth, and no influence was observed for the C/N ratio. Drainage also did not influence the TN and C/N ratio for any depth ( and ). However, data show that TN was consistent with the SOC, and higher values of TN were observed for NT (0–10, 10–20, 20–40 and 40–60 cm depths) and non-drainage (0–10, 10–20, 20–40 and 40–60 cm depths) compared to those for the CT and drainage systems, respectively. Interactions of tillage by drainage were not significant at any depth for either parameter (TN or C/N ratio).
Table 2 Soil organic carbon (SOC) and total nitrogen (TN) concentrations influenced by long-term no-till and chisel-till under drainage and non-drainage systems for the 20–40 and 40–60 cm depths, and analysis of variance
Data on SOC stock (Mg ha−1) as influenced by tillage and drainage systems are presented in . Tillage significantly influenced SOC stock for all depths (0–10, 10–20 and 40–60 cm) except 20–40 cm (). Similarly, drainage also significantly influenced the SOC stock for all depths but 20–40 cm.
Figure 2 Soil organic carbon stock (SOC, Mg ha−1) as influenced by tillage (A; NT, no-tillage, and CT, chisel-tillage) and drainage (B; D, drainage, and ND, no-drainage) systems for the 0–10, 10–20, 20–40 and 40–60 cm depths.
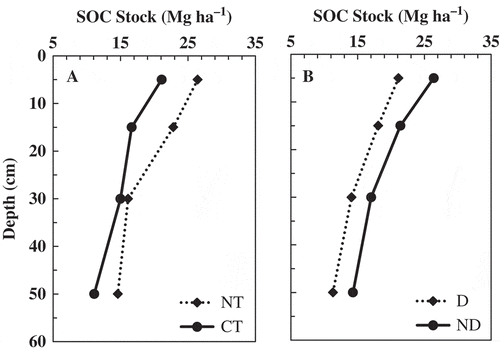
The SOC stock for the NT system was 25, 37 and 32% higher for the 0–10, 10–20 and 40–60 cm depths, respectively, compared to that under the CT system for these depths (P < 0.01). For the 20–40 cm depth, SOC was numerically but not significantly higher (5.2%) for NT compared to CT (). Drainage also significantly influenced the SOC stock at all depths except at the 20–40 cm. Non-drainage increased the SOC stock by 25, 18, 21 and 27% for 0–10, 10–20, 20–40 and 40–60 cm depths, respectively, compared to that under subsurface drainage. Interactions of tillage by drainage were also observed to be significant at 10–20 and 40–60 cm depths.
Continuous tillage over 18 years decreased SOC and increased the soil bulk density of this system compared to that under NT. Soils managed with the NT system improved the SOC and hence reduced soil bulk density. Abid and Lal (Citation2008) conducted a study on the same site and reported similar findings. However, the present study was conducted for a longer duration (18 years) and reported more differences than observed by Abid and Lal (Citation2008) with 13 years of management. Plots with non-drainage reduced SOC decomposition and hence improved the SOC. Kumar et al. (Citation2012b) conducted a study on long-term plots managed for 47–49 years and reported that NT soils improve SOC for 0–10 cm depth for well-drained soils but do not affect poorly-drained soils compared to the CT system; however, SOC for this depth was significantly higher under NT for both soils (poorly and well-drained) compared to the plow-till system.
Light and heavy fractions of carbon
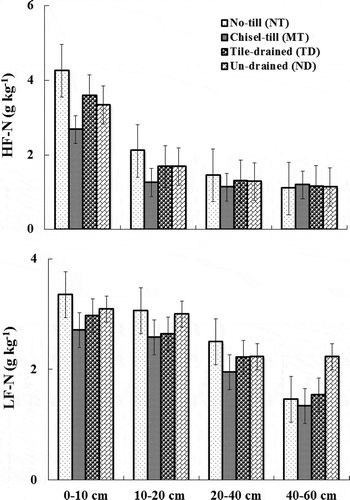
The labile fraction of carbon (LF-C) was significantly impacted by tillage more quickly than the total soil carbon (). The heavy fraction (HF) of C was significantly influenced by tillage for both the 0–10 and 10–20 cm depths. At these depths, LF-C was 12 and 10%, respectively, higher compared to that under CT system. At 0–10 cm depth, drainage decreased the HF by 10% compared to that under non-drainage (P < 0.02). In general, non-drainage increased the HF compared to drainage systems at 40–60 cm depth. Interactions of tillage by drainage were significant for the 20–40 cm and 40–60 cm depths. Similar trend was observed for the HF-N. Tillage significantly impacted HF-N at 0–10 and 10–20 cm depths (P < 0.01). Drainage did not influence HF-N at any depth. Interactions of tillage by drainage were not significant at any depth ().
Figure 3 Soil carbon stored in heavy (HF-C) and light (LF-C) fractions of carbon under long-term tile drainage (TD) and non-drainage (ND) systems for the 0–10, 10–20, 20–40 and 40–60 cm depths.
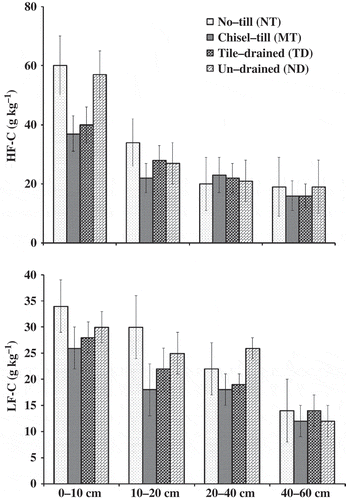
The light fraction (LF) of C was also influenced by tillage at all depths (0–10, 10–20 and 40–60 cm) except at 20–40 cm (P < 0.05). No-tillage increased the LF-C by 10, 20 and 30% compared to that under the CT system at 0–10, 10–20 and 20–40 cm depths, respectively (). Drainage also significantly influenced LF-C but only for the 10–20 cm depth (P < 0.02). Overall, the non-drainage system increased LF-C by 10% compared to that under the drainage system. Interactions of tillage by drainage were significant only for 0–10 cm depth (P < 0.02). A similar trend was also observed for the LF-N. The latter was significantly impacted by tillage at 0–10 and 10–20 cm depths (P < 0.01). Drainage did not influence LF-N at any depth. Interactions of tillage by drainage were also not significant at any depth ().
Figure 4 Soil nitrogen stored in heavy (HF-N) and light (LF-N) fractions of nitrogen under long-term tile drainage (TD) and non-drainage (ND) systems for the 0–10, 10–20, 20–40 and 40–60 cm depths.
The labile C fraction (LF-C) is the key requirement for sustainable soil management (Blair et al. Citation1995). This relatively rapid C fraction turn over can respond more quickly than SOC to land use change and soil management (Ghani et al. Citation2010). In this study, the no-till system influenced the labile C and build-up of labile C pools after 18 years of management. In contrast, frequent tillage under CT breaks down aggregates and exposes protected organic matter to microbial decomposition and enhances the loss of labile C (Chen et al. Citation2007). Further, tillage disrupts macroaggregates, adversely affects the labile C, limits the physical protection of labile C and subsequently reduces the SOC (Chen et al. Citation2009). In NT soils, leftover crop residue provides a substrate to soil microorganisms, and contributes to accumulations of labile C (Chen et al. Citation2009). The increase of labile C in NT soils can help soil fertility improvement through increase of labile sources of nutrients (Chen et al. Citation2009).
Soil microbial biomass carbon (MBC)
Microbial biomass is a fundamental component in nutrient cycling (Balota and Auler Citation2011) and influenced by management and soil types. Tillage can significantly cause modifications in the soil habitat and affects the microbial community. Data presented in show that the MBC was strongly influenced by tillage (P < 0.01) and for the 0–10 depth. However, the effect of drainage systems on MBC was significant for both the 0–10 and 10–20 cm depths.
Table 3 Microbial biomass carbon (MBC) for the 0–10 and 10–20 cm depths under no-till and chisel-till of drainage and non-drainage systems, and analysis of variance
The MBC (µg g soil−1) for the NT system was 19.9% higher for the 0–10 cm depth and 11.3% lower for the 10–20 cm depth compared to that under the CT system for these depths. It may be due to enhanced C storage in the NT system. However, for the 10–20 cm depth, MBC was not significantly different between NT vs. CT. Interactions of tillage by drainage were also significant for the 0–10 cm depth only (P < 0.01).
Soil microorganisms facilitate the decomposition of SOM and nutrient mineralization (Balota and Auler Citation2011). Soil microbial mass is a small but major reservoir of nutrients [such as C, N, P and sulfur (S)] (Balota and Auler Citation2011). It has been well documented that reducing the soil disturbance can enhance C storage in surface soils where > 90% of biological activity occurrs (Doran Citation1980; Six et al. Citation2000). Microbial quotient C (ratio of biomass-C to total soil C) better quantifies biological changes due to tillage than does microbial biomass or soil C alone (Carter Citation1991). Further, it has been reported by Anderson and Domsch (Citation1989) that a consistent change in microbial quotient C over time may indicate whether soil C is accumulating or decreasing. For this study, plots with the NT system have been managed for over 18 years and still are not under equilibrium. The NT soils may improve soil MBC and SOC compared to CT system. MBC, POC, dissolved organic C (DOC), hot-water extractable C (HWC) and permanganate oxidizable (KMnO4-C) are considered labile SOC pools and are important indicators of soil quality (Blair et al. Citation1995; Ghani et al. Citation2003). Physical fractionation of soil for aggregate-size fractions (i.e., wet sieving) has been an effective method for evaluating soil aggregation and degradation induced by management practices (Six et al. Citation2002). Interactions of tillage, drainage (soil moisture), temperature, aeration and substrate availability strongly influence changes in microbial community (Feng and Simpson Citation2009). Soils managed with NT increase nutrient availability to crops (Doran Citation1987) through changes in the mineralization and immobilization of nutrients by microbial biomass (Sørensen and Jensen Citation1995). Drainage increases aerobicity and it was not surprising that 18 years of drainage did affect MBC. However, additional information on microbial community structure and function is required to explain the tillage and drainage impacts.
Aggregate size distribution and stability
Data for WSA and MWD under different tillage and drainage systems for the 0–10 and 10–20 cm depths are presented in . At the 0–10 cm depth, tillage significantly affected the WSA macroaggregates (> 2000 μm), microaggregates (53–250 μm), and silt-and clay-sized microaggregates (< 53 μm; P < 0.05). The small aggregates (250–2000 μm) were not affected by either tillage or drainage. The macroaggregates for the NT (73%) system were 62% higher compared to those for the CT (45%) system at the 0–10 cm depth. The NT soils increased macroaggregates compared to those under CT. A relative increase in the proportion of large macroaggregates has also been reported by Lichter et al. (Citation2008). The relatively small macroaggregates (250–2000 μm), microaggregates (53–250 μm) and silt-and-clay size aggregates (< 53 μm) were higher for CT compared to those for NT soils. The microaggregates and silt-and clay-sized aggregates were 50 and 183% higher for the CT compared to the NT system, respectively. Drainage also significantly influenced all aggregate size classes except microaggregates for the 0–10 cm depth. Tile-drainage improved the macroaggregates but lowered other aggregate size classes. Interactions between tillage by drainage were significant for macroaggregates, small macroaggregates, and silt-and clay-size aggregates. For the 10–20 cm depth, tillage and drainage did not influence any aggregate size classes. However, in general, NT soils had numerically higher macroaggregates (39% vs. 34%), small macroaggregates (25% vs. 20%) and microaggregates (15% vs. 14%) compared to those under CT soils. Similarly, interactions of tillage by drainage for 10–20 cm depth were also not significant for any aggregate size distribution.
Table 4 Water stable aggregates (WSA) and mean weight diameter (MWD) for no-till and chisel-till under drainage and non-drainage systems for the 0–10 cm depth, and analysis of variance
Tillage and drainage significantly influenced the MWD for the 0–10 cm depth only. However, interactions of tillage by drainage were only significant for the 10–20 cm depth. The MWD was 2.6 times higher for NT (4.59 mm) compared to that for CT (1.80 mm). For the 0–10 cm depth, soils managed with tile-drainage (TD; 3.68 mm) improved MWD by 35% over soils under without drainage (ND; 2.72 mm). A similar trend was observed for the 10–20 cm depth; however, differences were not significant.
The formation and stabilization of soil macroaggregates play an important role in protecting the SOM (Balota and Auler Citation2011). Tillage results in low aggregate stability and poor physical protection of SOM, which is decomposed at high rates by heterotrophic bacteria (Beare et al. Citation1994; Abid and Lal Citation2008). However, for this study, the aggregates were a little higher than what observed by Abid and Lal (Citation2008) and this was partially attributed to the additional years of management impacts on these soil parameters. Tillage disrupts the binding agents of macroaggregates (Olchin et al. Citation2008). Reduction in macroaggregates and MWD with tillage could be mainly due to mechanical disruption of macroaggregates from frequent tillage operations and reduced aggregate stability (Chen et al. Citation2009). Aggregate stability is positively correlated to labile organic C in the soil (Cambardella and Elliott Citation1993).
Corn yield
Data for corn yield measured from 2006 through 2012 are reported in . Tillage and drainage did not significantly influence the corn yield in any year. A mixed trend was observed in the corn yield. In 2006, 2008, 2009 and 2010, corn yield was 22, 25, 4 and 22% higher, respectively, in CT compared to that under the NT system. However, in 2007, the yield was 12% higher under NT compared to the CT system. Subsurface drainage improved crop yield in every year except 2006 where yield was almost the same. In 2007, 2008, 2009, 2010 and 2011 the corn yield was 2.5, 21, 36, 18 and 9% higher, respectively, under drainage plots compared to those without drainage system. It has been reported that subsurface drainage enhances the crop yields on poorly drained soils, and help in reducing the yearly yield variability (Zucker and Brown Citation1998). Corn yield was not significantly influenced by tillage and drainage for this study; however, drainage showed a consistent trend in higher yield compared to the non-drainage system. Since these differences are not large, long-term monitoring of crop yield is important.
Table 5 Corn (Zea mays L.) yield for 2006 through 2012 as influenced by tillage and drainage systems
SUMMARY AND CONCLUSIONS
This study was conducted in Central Ohio to investigate tillage and drainage impacts on SOC and its fractions. The following conclusions were drawn from this study:
Tillage caused significant modifications in the soil habitat and affected the microbial biomass C. Usage of NT and drainage for longer duration significantly influenced the MBC for the 0–10 and 10–20 cm depths.
Tillage resulted in low aggregate stability and poor physical protection of SOM, which is decomposed at high rates by heterotrophic bacteria. Results show that SOC was significantly higher for the soils under NT as compared to that of soils under CT for the 0–10 cm depth. A similar trend was observed for the TN and C/N ratio. Drainage also significantly influenced the SOC, TN and C/N ratio; however, a significant effect was observed only for the 0–10 cm depth.
Continuous tillage over 19 years increased soil bulk density for the 0–10 cm depth as compared to that under NT.
The HF and LF-C were higher for the 0–10 and 10–20 cm depths under the NT system compared to the CT system.
Corn yield was not affected by tillage and drainage systems; however, drainage improved corn yield over non-drainage systems.
Soil parameters were not much different between the two tillage systems and this could be due to using a corn-corn cropping sequence for the studied site. However, the cropping system (corn-corn) of the experimental plot has been switched to corn-soybean (Glycine max L.) since 2013 and this may help in regaining the SOC and improving the soil properties over a long-term duration.
ACKNOWLEDGMENTS
This research is part of a regional collaborative project supported by the USDA (United States Department of Agriculture)-NIFA (National Institute of Food and Agriculture), Award No. 2011-68002-30190, “Cropping systems coordinated agricultural project (CAP): Climate change, mitigation, and adaptation in corn-based cropping systems” (sustainablecorn.org). Authors extend special thanks to Molly Moran for the help in soil sampling and lab analysis.
REFERENCES
- Abid M, Lal R 2008: Tillage and drainage impact on soil quality - I. Aggregate stability, carbon and nitrogen pools. Soil Till. Res., 100, 89–98.
- Anderson TH, Domsch KH 1989: Ratios of microbial biomass carbon to total organic-carbon in arable soils. Soil Biol. Biochem., 21, 471–479.
- Balota EL, Auler PAM 2011: Soil microbial biomass under different management and tillage systems of permanent intercropped cover species in an orange orchard. Revista Brasileira De Ciencia Do Solo, 35, 1873–1883.
- Bayer C, Martin-Neto L, Mielniczuk J, Pillon CN, Sangoi L 2001: Changes in soil organic matter fractions under subtropical no-till cropping systems. Soil Sci. Soc. Am. J., 65, 1473–1478.
- Beare MH, Hendrix PF, Coleman DC 1994: Water-stable aggregates and organic matter fractions in conventional and no-tillage soils. Soil Sci. Soc. Am. J., 58, 777–786.
- Biederbeck VO, Campbell CA, Rasiah V, Zentner RP, Wen G 1998: Soil quality attributes as influenced by annual legumes used as green manure. Soil Biol. Biochem., 30, 1177–1185.
- Blair GJ, Lefroy RDB, Lise L 1995: Soil carbon fractions based on their degree of oxidation, and the development of a carbon management index for agricultural systems. Aust. J. Agric. Res., 46, 1459–1466.
- Bruun S, Thomsen IK, Christensen BT, Jensen LS 2008: In search of stable soil organic carbon fractions: a comparison of methods applied to soils labelled with 14C for 40 days or 40 years. Eur. J. Soil Sci., 59, 247–256.
- Cambardella C, Elliott E 1993: Carbon and nitrogen distribution in aggregates from cultivated and native grassland soils. Soil Sci. Soc. Am. J., 57, 1071–1076.
- Cannell RQ, Gales K, Snaydon RW, Suhail BA 1979: Effects of short-term waterlogging on the growth and yield of peas (Isum-Sativum). Ann. Appl. Biol., 93, 327.
- Carter MR 1991: Evaluation of shallow tillage for spring cereals on a fine sandy loam. 1. Growth and yield components, n-accumulation and tillage economics. Soil Till. Res., 21, 23–35.
- Chen HQ, Hou RX, Gong YS, Li HW, Fan MS, Kuzyakov Y 2009: Effects of 11 years of conservation tillage on soil organic matter fractions in wheat monoculture in Loess Plateau of China. Soil Till. Res., 106, 85–94.
- Chen Y-q, Xu X, Ruan H-h, Wang G-b, Luan Y-l 2007: Soil labile carbon in secondary Quercus variabilis forest and Pinus taeda plantation in hilly area off South Jiangsu, China. Shengtaixue Zazhi, 26, 2028–2034.
- Chintala R, Clay DE, Schumacher TE, Malo DD, Julson JL 2013: Optimization of oxygen parameters for analyzing carbon and nitrogen in biochar materials. Anal. Lett., 46, 532–538.
- Christensen TR, Michelsen A, Jonasson S 1999: Exchange of CH4 and N2O in a subarctic heath soil: effects of inorganic N and P and amino acid addition. Soil Biol. Biochem., 31, 637–641.
- Dalal RC, Henderson PA, Glasby JM 1991: Organic-matter and microbial biomass in a vertisol after 20-yr of zero-tillage. Soil Biol. Biochem., 23, 435–441.
- Diekow J, Mielniczuk J, Knicker H, Bayer C, Dick DP, Kogel-Knabner I 2005: Soil C and N stocks as affected by cropping systems and nitrogen fertilisation in a southern Brazil Acrisol managed under no-tillage for 17 years. Soil Till. Res., 81, 87–95.
- Doran JW 1980: Soil microbial and biochemical-changes associated with reduced tillage. Soil Sci. Soc. Am. J., 44, 765–771.
- Doran J 1987: Microbial biomass and mineralizable nitrogen distributions in no-tillage and plowed soils. Biol. Fertil. Soils, 5, 68–75.
- Ellert BH, Janzen HH, Entz T 2002: Assessment of a method to measure temporal change in soil carbon storage. Soil Sci. Soc. Am. J., 66, 1687–1695.
- Falloon PD, Smith P 2000: Modelling refractory soil organic matter. Biol. Fertil. Soils, 30, 388–398.
- Feng X, Simpson MJ 2009: Temperature and substrate controls on microbial phospholipid fatty acid composition during incubation of grassland soils contrasting in organic matter quality. Soil Biol. Biochem., 41, 804–812.
- Ghani A, Dexter M, Perrott KW 2003: Hot-water extractable carbon in soils: a sensitive measurement for determining impacts of fertilisation, grazing and cultivation. Soil Biol. Biochem., 35, 1231–1243.
- Ghani A, Muller K, Dodd M, Mackay A 2010: Dissolved organic matter leaching in some contrasting New Zealand pasture soils. Eur. J. Soil Sci., 61, 525–538.
- Gregorich EG, Carter MR, Angers DA, Monreal CM, Ellert BH 1994: Towards a minimum data set to assess soil organic-matter quality in agricultural soils. Can. J. Soil Sci., 74, 367–385.
- Grossman RB, Reinsch TG 2002: The solid phase; bulk density and linear extensibility. In Methods of Soil Analysis Part 4 Physical Methods, Ed. Dick AD, pp. 201–228. Soil Science Society of America Book Series, Madison, WI.
- Hu S, Grunwald NJ, vanBruggen AHC et al. 1997: Short-term effects of cover crop incorporation on soil carbon pools and nitrogen availability. Soil Sci. Soc. Am. J., 61, 901–911.
- Jagadamma S, Lal R 2010: Distribution of organic carbon in physical fractions of soils as affected by agricultural management. Biol. Fertil. Soils, 46, 543–554.
- Kadono A, Funakawa S, Kosaki T 2009: Factors controlling potentially mineralizable and recalcitrant soil organic matter in humid Asia. Soil Sci. Plant Nutr., 55, 243–251.
- Kapkiyai JJ, Karanja NK, Qureshi JN, Smithson PC, Woomer PL 1999: Soil organic matter and nutrient dynamics in a Kenyan nitisol under long-term fertilizer and organic input management. Soil Biol. Biochem., 31, 1773–1782.
- Khanna PK, Ludwig B, Bauhaus J, O’Hara C 2001: Assessment and Significance of Labile C Pools in Forest Soils, Lewis Publishers, Boca Raton, FL.
- Krull ES, Baldock JA, Skjemstad JO 2003: Importance of mechanisms and processes of the stabilisation of soil organic matter for modelling carbon turnover. Funct. Plant Biol., 30, 207–222.
- Kumar S, Kadono A, Lal R, Dick W 2012a: Long-term no-till impacts on organic carbon and properties of two contrasting soils and corn yields in Ohio. Soil Sci. Soc. Am. J., 76, 1798–1809.
- Kumar S, Kadono A, Lal R, Dick W 2012b: Long-term no-till impacts on organic carbon and properties of two contrasting soils and corn yields in Ohio. Soil Sci. Soc. Am. J., 76, 1798–1809.
- Lal R 2004: Soil carbon sequestration impacts on global climate change and food security. Science, 304, 1623–1627.
- Lal R, Taylor GS 1970: Drainage and nutrient effects in a field lysimeter study. 2. Mineral uptake by corn. Soil Sci. Soc. Am. Proc., 34, 245–248.
- Lichter K, Govaerts B, Six J, Sayre KD, Deckers J, Dendooven L 2008: Aggregation and C and N contents of soil organic matter fractions in a permanent raised-bed planting system in the Highlands of Central Mexico. Plant and Soil., 305, 237–252.
- Martino DL, Shaykewich CF 1994: Root penetration profiles of wheat and barley as affected by soil penetration resistance in-field conditions. Can. J. Soil Sci., 74, 193–200.
- McLauchlan KK, Hobbie SE, Post WM 2006: Conversion from agriculture to grassland builds soil organic matter on decadal timescales. Ecol. Appl., 16, 143–153.
- Nabuurs GJ, van Putten B, Knippers TS, Mohren GMJ 2008: Comparison of uncertainties in carbon sequestration estimates for a tropical and a temperate forest. Forest Ecol. Manag., 256, 237–245.
- Nangia V, Gowda PH, Mulla DJ 2010a: Effects of changes in N-fertilizer management on water quality trends at the watershed scale. Agric. Water Manage., 97, 1855–1860.
- Nangia V, Gowda PH, Mulla DJ, Sands GR 2010b: Modeling impacts of tile drain spacing and depth on nitrate-nitrogen losses. Vadose Zone J., 9, 61–72.
- Olchin GP, Ogle S, Frey SD, Filley TR, Paustian K, Six J 2008: Residue carbon stabilization in soil aggregates of no-till and tillage management of dryland cropping systems. Soil Sci. Soc. Am. J., 72, 507–513.
- Pastor J, Post W 1986: Influence of climate, soil moisture, and succession on forest carbon and nitrogen cycles. Biogeochemistry, 2, 3–27.
- Poirier N, Sohi SP, Gaunt JL et al. 2005: The chemical composition of measurable soil organic matter pools. Org. Geochem., 36, 1174–1189.
- Power JF, Wiese R, Flowerday D 2000: Managing nitrogen for water quality-lessons from Management Systems Evaluation Area. J. Environ. Qual., 29, 355–366.
- Quiroga A, Funaro D, Noellemeyer E, Peinemann N 2006: Barley yield response to soil organic matter and texture in the Pampas of Argentina. Soil Till. Res., 90, 63–68.
- SAS 2007: SAS user’s guide: Statistics. SAS Inst. Cary, NC.
- Shrestha RK, Lal R 2007: Soil carbon and nitrogen in 28-year-old land uses in reclaimed coal mine soils of Ohio. J. Environ. Qual., 36, 1775–1783.
- Six J, Feller C, Denef K, Ogle SM, Sa JCD, Albrecht A 2002: Soil organic matter, biota and aggregation in temperate and tropical soils - Effects of no-tillage. Agronomie, 22, 755–775.
- Six J, Merckx R, Kimpe K, Paustian K, Elliott ET 2000: A re-evaluation of the enriched labile soil organic matter fraction. Eur. J. Soil Sci., 51, 283–293.
- Skopp J, Jawson MD, Doran JW 1990: Steady-state aerobic microbial activity as a function of soil-water content. Soil Sci. Soc. Am. J., 54, 1619–1625.
- Sørensen P, Jensen ES 1995: Mineralization-immobilization and plant uptake of nitrogen as influenced by the spatial distribution of cattle slurry in soils of different texture. Plant Soil, 173, 283–291.
- Sperow M, Eve M, Paustian K 2003: Potential soil C sequestration on US agricultural soils. Climatic Change, 57, 319–339.
- Spycher G, Sollins P, Rose SL 1983: Carbon and nitrogen in the light fraction of a forest soil: vertical distribution and seasonal patterns. Soil Sci., 135, 79–87.
- Staff SS 1996: National soil survey handbook. Title 430-VI. USDA Natural Resources Conservation Service. U.S. Govt. Printing Office, Washington, DC. 20250.
- Sullivan MD 1997: Dissolved organic carbon and soil solution pH as affected by drainage, tillage, depth and season in an agricultural watershed. Environment and Natural Resources. The Ohio State University.
- Tedla AB, Su B, Luo Y, Wallace LL 2004: Carbon and nitrogen dynamics in experimentally warmed and clipped tallgrass prairie soil. Ecol. Soc. Am. Ann. Meeting Abstracts, 89, 501.
- Thomas GA, Titmarsh GW, Freebairn DM, Radford BJ 2007: No-tillage and conservation farming practices in grain growing areas of Queensland - a review of 40 years of development. Aust. J. Exp. Agric., 47, 887–898.
- Trumbore SE, Keller M, Wofsy SC, Dacosta JM 1990: Measurements of soil and canopy exchange-rates in the amazon rain-forest using rn-222. J. Geophys. Res.-Atmos., 95, 16865–16873.
- Vance ED, Brookes PC, Jenkinson DS 1987: An extraction method for measuring soil microbial biomass-c. Soil Biol. Biochem., 19, 703–707.
- Voroney RP, Winter JP, Beyaert RP 1993: Soil microbial biomass C and N. In Soil Sampling and Methods of Analysis, Ed. Carter MR, pp. 277–286. Canadian Society of Soil Science. Lewis Publishers, Boca Raton, FL.
- Zucker LA, Brown LC 1998: Agricultural drainage: Water quality impacts and subsurface drainage studies in the Midwest. Ohio State University Extension Bulletin, 871–898.