
Abstract
We investigated radiocesium distribution in tea plants (Camellia sinensis L. var. sinensis) of Saitama Prefecture, located approximately 200–250 km away from Tokyo Electric Power Company’s Fukushima Daiichi nuclear power plant. In 2012, more than 2500 samples of tea plants were analyzed. We found differences in radiocesium concentration among tea plant cultivars, which appeared to be attributable mainly to the leaf morphology and depth of the leaf layer in tea plants. Furthermore, the radiocesium concentration in the first tea crop showed a strong correlation with that in spring skiffing.
1. INTRODUCTION
The accident that occurred at Tokyo Electric Power Company’s Fukushima Daiichi nuclear power plant (FDNPP) after the Great East Japan Earthquake on March, 11, 2011, spread radioactive material through the shifting winds and rain a few days after the accident, resulting in patchy hot spots of fallout over land (Brumfiel Citation2011; Tsukada et al. Citation2011). In addition, radiocesium concentrations in some manufactured tea exceeded the temporary limit for foods set by the Japanese Ministry of Health, Labour and Welfare (MHLW) (Saitama Prefecture Official Website Citation2011). In particular, “Sayama cha” (a brand name of tea produced in Saitama Prefecture, Japan) had radiocesium concentrations of > 500 Bq kg–1, which exceeded the temporary limit.
Tea production involves two steps: manufacturing of crude tea and refining. Crude tea is distributed by the producers to the wholesalers, but not to the consumers. However, crude tea after refining is marketed to the consumers. In addition, tea plants (Camellia sinensis L. var. sinensis) are subjected to plucking in order to restore the vigor of old plants and to maintain the height of the plucking surface. These treatments are used in different periods: first, every 2–3 years, and then, after every 5 years. Tea skiffing is performed after every harvest and in autumn to remove late-emerging shoots and to keep the surface uniform for mechanical plucking.
Radioactive pollution of Japanese tea was previously investigated during 1950–1960, and it was reported that washing and processing the tea leaves effectively reduced radioactivity (Tanitazawa and Ishihara Citation1956). These investigations were conducted as a result of pollution with rare earth radioactive materials, which may differ from radiocesium pollution in tea plants. On the other hand, many studies were conducted after the accident at the Chernobyl nuclear power plant. It was reported that the radioactivity level of tea produced in 1986 was 0–89,000 Bq kg–1, with a weighted average of 30,000 Bq kg–1 in Turkey (Ahmed Citation1992). The soil surface cesium-137 (137Cs) activity in the eastern part of the Black Sea Mountains was 4000–4500 Bq kg–1 in the top 0.5 cm of the soil in 1988 (Unlu et al. Citation1995).
Therefore, in 2012, after the accident, we investigated the radiocesium concentration in crude tea from local tea plantations in Saitama Prefecture, 200 and 250 km away from FDNPP. We also investigated radiocesium distribution in the tea canopy and the soil under the trees.
2. MATERIALS AND METHODS
2.1 Radiocesium concentration in tea plants in Saitama Prefecture
In Saitama Prefecture, tea shoots are cultivated and harvested from April to June; the first tea crop is obtained between late April and late May and the second tea crop is obtained in late June, which is approximately 40 d after the first harvest ().
Figure 1 The cultivation system of the tea plants (Camellia sinensis L. var. sinensis) in Saitama prefecture. Skiffing tea plants are subjected to plucking to restore the vigor of old plants and to maintain the height of the plucking surface. Crude tea is distributed by the producers to the wholesalers, and manufactured tea, after refining, is marketed to the consumers.
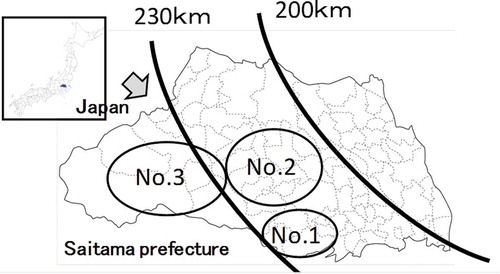
In 2012, we collected more than 2500 tea plant samples obtained from (1) tea-producing areas (Iruma City, Tokorozawa City, and Sayama City: n = 1306), (2) areas around tea-producing areas (Fujimino City, Hidaka City, Kawagoe City, Sakado City, Turugashima City, Miyoshi Town, and Moroyama Town: n = 233) and (3) mountain areas (Hannou City, Chichibu City, Ogano Town, Ogose Town, Tokigawa Town, Yokoze Town: n = 273) (). “Sayama cha” is one of the most popular blends of tea in Japan, and No. 1 areas accounted for 70–80% of the total production in Saitama Prefecture.
Figure 2 Division of the tea (Camellia sinensis L. var. sinensis) -producing areas investigated. Circles indicate the locations of the study sites. No. 1: tea-producing areas (n = 1306); no. 2: areas around tea-producing area (n = 233); no. 3: mountain areas (n = 273).
Crude tea samples from cultivars Camellia sinensis cv. Yabukita, Sayamakaori, and Fukumidori, and a local variety, were examined. The crude and skiffed tea samples were taken to the examination room by an agricultural extension worker and a farmer, who completed a questionnaire about the collection point and the cultivar name. The fresh skiffed samples were ground to approximately 2 kg using a grinding machine (large 300TC type; Taninaka Industry Co.). Prior to the radioactive measurements, all tea samples were stored in a cool, dark place. The crude tea samples were sealed in a plastic Marinelli beaker without grinding, and radiocesium concentrations were measured on the same day.
2.2 Distribution of radiocesium concentrations in tea fields
To clarify radiocesium distribution during the growth phase of tea, C. sinensis cv. Yabukita plants (age, approximately 40 years) from the Green Tea Laboratory in Saitama Prefecture were used. On May 17, 2012, radiocesium distribution in five parts (No. 1–5) was analyzed during the growth phase, as shown in ). The samples were dried in an air-forced oven at 70°C for 72 h and ground into powder for radiocesium analysis. On January 27, 2012, soil samples were collected from the crown bottom and the rainwater outlet during the tea growth phase to measure radiocesium activity. The soil samples were collected at a depth of 5–30 cm. These samples were thoroughly mixed, and fragments of gravels and roots were removed using a sieve with a 5-mm mesh. The distribution of radiocesium in the tea plants and soil was determined using a germanium semiconductor detector by private analytical services.
Figure 3 Radiocesium concentrations in the first tea crop on the tea plants (Camellia sinensis L. var. sinensis), May to June, in Saitama Prefecture in 2012. Means of all samples collected from three areas are shown with standard errors (SE). No. 1: tea-producing areas, n = 217; no. 2: area around tea-producing areas, n = 94; no. 3: mountain areas, n = 58. Vertical bars indicate ± standard error (SE), and any bars followed by the same letter are not significantly different according to the Tukey–Kramer test (P < 0.05). DW: dry weight.
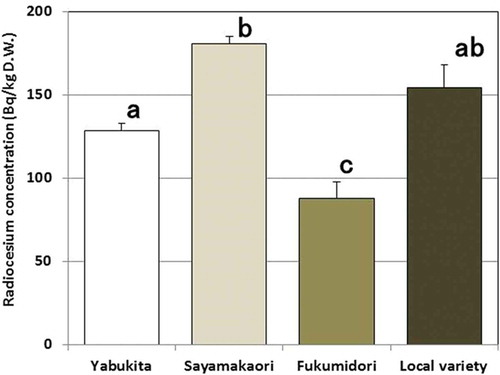
Figure 4 Radiocesium concentrations in the first and second tea crops on the tea plants (Camellia sinensis L. var. sinensis), in Saitama Prefecture in 2012. Vertical bars indicate ± standard error (SE), and any bars followed by the same letter are not significantly different according to the Tukey–Kramer test (P < 0.05). DW: dry weight.
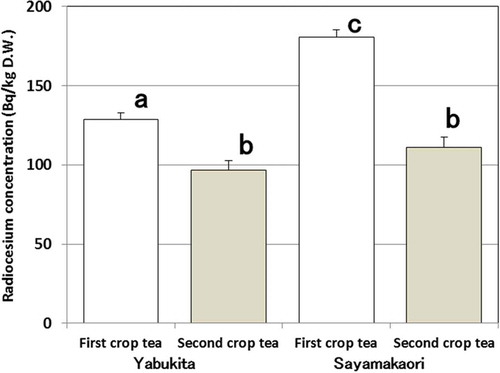
Figure 5 Periodic change in radiocesium concentration among four cultivars of tea plants (Camellia sinensis L. var. sinensis) in the first cropping season in 2012. Each datum represents the samples collected on the date given on the horizontal axis. DW: dry weight.
Figure 6 Radiocesium concentration in (a) tea canopy and (b) soils under tea trees on the tea plants (Camellia sinensis L. var. sinensis).
2.3 Measurement of radiocesium in tea and soil samples
The samples were analyzed using NaI (Tl) scintillation spectrometers (RAD-IQTM FS300, Chiyoda Tekunoru Co., Japan, or Toraiasura Becquerel Viewfinder; Hidex Co., Finland). The scintillation spectrometric measurements were set at 27°C, and the setting was optimized for the radiocesium screening of food (MHLW Citation2011). Because we had to measure more than 100 samples per day and provide the results to the tea cultivation farmhouse, the samples were measured for 600 s. The standard limit for crude tea was set to 150 Bq kg–1 on the basis of the radiocesium screening method for food (MHLW Citation2012). However, there was no standard limit for radiocesium for skiffed tea samples.
The lower limit of measurement for crude tea was < 37.5 Bq kg–1 and that for skiffed tea was set at < 50 Bq kg–1. In addition, samples that did not satisfy the specific setting conditions of the NaI (Tl) scintillation spectrometer were excluded from data analyses. Therefore, the measurements made using the NaI (Tl) scintillation spectrometer were cross-checked using a germanium semiconductor detector, and analyses were conducted by ShinNihon Kentei Kyokai, Japan upon request. The experimental results indicated that it was necessary to use a sample density of > 0.42 g cm–3 for skiffed tea and 0.65 g cm–3 for crude tea in the plastic Marinelli beakers.
2.4 Statistical analysis
Data were analyzed using Microsoft Excel Statistics 2012, and statistical analysis was performed using the Tukey–Kramer test to determine significant difference for each effect and interaction (P = 0.05).
3. RESULTS AND DISCUSSION
3.1 Radiocesium concentration in tea plants in Saitama Prefecture
In 2012, we determined the radiocesium concentration of the tea samples collected from three areas (Nos. 1–3; ). However, no differences were observed among the areas; therefore, all data from the three areas were pooled and statistically analyzed.
We found an intercultivar difference in radiocesium concentrations. The radiocesium concentration in the cultivar Sayamakaori was the highest among the four cultivars in all the investigated areas (). shows the differences in radiocesium concentrations in the first and second tea crops. The decrease in radiocesium concentrations in the cultivar Sayamakaori was more than two-fold higher than that in radiocesium concentrations in the cultivar Yabukita (). The change in radiocesium concentrations in each cultivar of crude tea during the period of the first crop (from May 7 to 23) is shown on each sampling date (). This figure clearly shows that the radiocesium concentration in the cultivar Sayamakaori was higher than that in other cultivars.
Radiocesium concentrations in both cultivars in the second tea crop were lower than those in the cultivars in the first tea crop. This suggests that the effect of reduction was influenced by plucking in the first tea crop.
Northeastern Turkey was one of the most seriously contaminated regions after the Chernobyl accident, and radiocesium concentrations in Turkish tea reached a maximum of 44,000 Bq kg–1 during the emergency in 1986 (Gedikoglu and Sipahi Citation1989). However, in 2000, the average radiocesium concentration in Turkish tea was 72 Bq kg–1 (Yapark et al. Citation2000). This suggests that a reduction in radiocesium concentrations in tea plantations occurred gradually. Schimmack et al. (Citation2007) reported that a significant contribution of variability by the factor “cultivar” alone could not be detected in winter wheat (Triticum aestivum L.). However, we found that radiocesium concentrations in the cultivar Sayamakaori were higher than those in other cultivars. To our knowledge, there are no studies reporting variation in radiocesium uptake by different tea cultivars.
In general, Sayamakaori was distinguished by its bud number and high yield compared with the other cultivars. Furthermore, one of the most striking characteristics was that the leaf layers of this variety were thick during the winter season and its photosynthetic ability was higher than that of Yabukita (Saitama Tea Experiment Station Citation1990; Honda Citation2010). Thus, the depth of the leaf layer may determine the amount of radiocesium absorbed by the plant.
During atmospheric radiocesium contamination of the trees, the volume of particles adsorbed was affected by the leaf surface where hairy leaves, rough leaves and sticky leaves were more efficient at adsorption than smooth leaves, whereas the volume of particles available for adsorption increased with the wind velocity (Chamberlain and Little Citation1980; Lindbreg and Lovet Citation1983).
It was recently reported that a potential radiocesium transport medium was sulfate aerosol (Kaneyasu et al. Citation2012). The higher concentration of radiocesium in the plucking surface of Sayamakaori than in that of Yabukita suggests that the aerosol size was < 0.001 mm and that the aerosols attached to the leaves of Sayamakaori during rain and/or wind. Furthermore, the stomata, which measured approximately 0.005 mm, absorbed the aerosols during photosynthesis (Matuo Citation2011). The mechanism of radiocesium absorption through the stomata awaits elucidation.
3.2 Radiocesium distribution in tea canopy and soil
shows the distribution of radiocesium during the growth phase in fields at the Tea Research Center in Saitama Prefecture. Radiocesium concentrations in the tea plants were in the following order: No. 3 > No. 4 ≥ No. 2 > No. 1 > No. 5. Thus, deep skiffing (No. 2) and deep skiffing–medium pruning (No. 3) parts had radiocesium concentrations that were 2.3–4 times higher than those in the plucking surface (No. 1), whereas radiocesium concentrations in the roots (No. 5) were half of those in the plucking surface.
A previous report showed that radiocesium was absorbed through the stems in tea plants and then translocated to the new shoots (Shiraki Citation2013). Thus, the medium pruning-ground part (No. 4) might have absorbed radiocesium through the stems of the tea plants.
Radioactive concentrations in the tea fields were not affected in the crown bottom or rainwater outlet part at a depth of 0–5 cm. In the rainwater outlet part at a depth of 0–5 cm, radiocesium concentrations were 30 times higher than those in the rainwater outlet part at a depth of 5–15 cm, and the concentrations decreased in parallel with the soil layer ().
In the tea field soils in the eastern part of the Black Sea Mountains, 137Cs activity in surface soil (top 0.5 cm of the soil) was 4000–4500 Bq kg–1 in 1988 (Celik et al. Citation2008). Twenty months after the Chernobyl accident, approximately 80% of the radiocesium was still present at a depth of 10 cm in the tea plantation soil (Yeşın and Çakir Citation1989). The results of that study are in agreement with our results that radiocesium concentration in the tea field soil is not considerably high.
3.3 Correlation between radiocesium concentrations in the first tea crop and in green leaves
shows the relationships between radiocesium concentrations in the first tea crop, green leaves, pruning branches and the second tea crop in the experimental plot. These datasets that included the data collected from the same sites were selected from the data in section 3.1. The slope was roughly divided into three groups. Radiocesium concentrations in the first tea crop and pruning branches were positively correlated (r2 = 0.7482), which indicated that the radiocesium concentrations in the crude tea samples of the first crop were regulated by those in the pruning branches. The radiocesium concentrations of the second and first tea crops were positively correlated (r2 = 0.6054), which indicated that the radiocesium concentrations in the crude tea samples of the second crop were regulated by those in the crude tea samples of the first crop. However, the radiocesium concentrations in the plucked new shoots were not proportional to those in the first tea crop (r2 = 0.2898).
Figure 7 Relationship of radiocesium concentration among crude tea of the first crop, its green leaves, skiffing branch in the first crop and crude tea of the second crop on the tea plants (Camellia sinensis L. var. sinensis) in 2012. Asterisks represent significant differences between radiocesium concentrations of the first tea crop and skiffing branches (P < 0.01). DW: dry weight.
The positive correlation between the first crop tea and pruning branches suggests that radiocesium was translocated to the young buds and new leaves. A previous report by Mori et al. (Citation2012) showed that several small holes were present in the bark of the main tree, allowing fallout to be absorbed and penetrate the trunk. The results of this study suggest translocation involving fallout on bark and old leaves, although direct evidence is lacking. After the determination of the mechanism, a rapid radiocesium diagnostic method may be developed using spring tea trimmings to estimate radiocesium concentrations in the first tea crop.
4. COUNTERMEASURES FOR RADIOCESIUM CONCENTRATION IN TEA IN SAITAMA PREFECTURE
After the accident in March 2011 at Tokyo Electric Power Company’s FDNPP, the Saitama prefectural government ordered testing of “Sayama cha” prior to shipment. For the following reasons, a reduction in radiocesium concentrations was observed in 2012 in the tea market in Saitama Prefecture: (1) implementation of autumn and/or spring skiffing and pruning of old branches (cultivation stage); (2) sampling inspections of all tea factories in the prefecture and a 24-h inspection system for the first tea crop (processed tea stage); (3) random testing of Sayama cha sold in the market by the prefectural government; and (4) restriction on marketing tea exceeding the standard radiocesium concentration.
ACKNOWLEDGMENTS
This research was supported in part by the Product Promotion Division of the Saitama Prefectural Government in Japan, and the authors thank the Agriculture and Forestry Promotion Center of Saitama Prefecture in Japan for providing tea samples.
REFERENCES
- Ahmed Y 1992: Criteria for the management of radioactive tea. A unique experience of radioactive pollution. J. Islam. Acad. Sci., 5(1), 1–3.
- Brumfiel G 2011: Fallout forensics hike radiation toll. Nature, 478, 435–436. doi:10.1038/478435a
- Celik N, Cevik U, Celik A, Kucukomeroglu B 2008: Determination of indoor radon and soil radioactivity levels in Giresun, Turkey. J. Environ. Radioact., 99, 1349–1354. doi:10.1016/j.jenvrad.2008.04.010
- Chamberlain AC, Little P 1980: Transport and capture of particles by vegetation. In Plant and Their Atmospheric Environment, Eds. Grace J, Ford D, Jarvis PG, pp. 147–173. Symposium of the British Ecological Society, Oxford Black well Scientific Publisher.
- Citizens’ Nuclear Information Center:Radioactive Contamination of Japanese Tea after the Fukushima Nuclear Accident. http://www.cnic.jp/english/newsletter/nit152/nit152articles/02_Japanesetea.html.
- Saitama tea experiment station 1990: Examination results book of breeding department.
- Gedikoglu A, Sipahi BL 1989: Chernobyl radioactivity in Turkish tea. Health Phys., 56, 97–101.
- Haluk Y 1994: Migration of 137Cs extracted from contaminated tea in sandy clay soil. J. Nucl. Sci. Technol., 32(6), 547–555.
- Honda Y 2010: New technology information. http://www.pref.saitama.lg.jp/b0909/documents/484846.pdf
- Kaneyasu N, Ohashi H, Suzuki F, Okuda T, Ikemori F 2012: Sulfate aerosol as a potential transport medium of radiocesium from the Fukushima nuclear accident. Environ. Sci. Technol., 46(11), 5720–5726. doi:10.1021/es204667h
- Lindbreg, S.E. and G.M. Lovett, 1985: Field measurements of particle dry deposition rates to foliage and inert surfaces in a forest canopy. Environmental Science and Technology, 19(3), 238–244.
- Matuo 2011: Tea future cultivation management for the radiocesium reduction of the tea tree. Tea, 64(9), 18–20.
- MHLW 2011: New standard limits for radionuclides in food (provisional translation). http://www.mhlw.go.jp/english/topics/2011eq/dl/new_standard.pdf
- MHLW 2012: Method for testing radioactive cesium infood http://www.mhlw.go.jp/english/topics/2011eq/dl/food-120821_2.pdf
- Mori S, Hirato A, Tanoi K, Takeda K, Yamakawa T, Nakanishi H 2012: Radioactive cesium flow in Rhus vernicifera. Soil Sci. Plant Nutr., 58(5), 611–617. doi:10.1080/00380768.2012.727188
- Schimmack W, Gerstmann U, Schultz W, Sommer M, Tschöpp V, Zimmermann G 2007: Intra-cultivar variability of the soil-to-grain transfer of fallout 137Cs and 90Sr for winter wheat. J. Environ. Radioact., 94(1), 16–30. doi:10.1016/j.jenvrad.2006.12.010
- Shiraki Y, 2013: Studies on Dynamics and Reduction Techniques of Radioactive Cesium in Tea Plants. Reporting research of Kanagawa Agricultural Technology Center156, 1–47 (in Japanese). Examination results book of Saitama tea experiment station 1990, Honda 2010.
- Tanitazawa M 1955: Effect of radioactive materialon the crop and soil with atomic explotion.Agriculture and horticulture., 30(2), 259–264. (in Japanese).
- Tsukada H, Toriyama K, Yamaguchi N 2011: Behavior of radionuclides in soil-plant system. Jpn. J. Soil Sci. Plant Nutr., 82, 408–418. (in Japanese).
- Unlu M, Topcuoglu S, Kucukcezzar R, Varinlioglu A, Gungor N, Bulut AM, Gungor E 1995: Natural effective half-life of 137Cs in tea plants. Health Phys., 68(1), 94–99. doi:10.1097/00004032-199501000-00012
- Yapark G, Gur F, Epik O 2000: Radiocesium activity in Turkish tea followed the Chernobyl after thirteen years. I. Eurasia Conference Nuclear Science and Its Application. Izmir, Turkey.
- Yeşın T, Çakir N 1989: Caesium-137 and caesium-134 levels in soil in a tea plantation in Turkey after the Chernobyl accident. Appl. Radiat. Isot., 40, 209–211. doi:10.1016/0883-2889(89)90149-4