
Abstract
Land use change in tropical peat soil is thought to cause intense greenhouse gas emissions by enhancing organic matter decomposition. Although microbes in peat soil play key roles in the emission of greenhouse gases, their characteristics remain unknown. This study was conducted to clarify the effect of land use change (drainage, forest fire and agricultural land use) on the control of gas emission factors with respect to the characteristics of microbes in tropical peat soils. Field observations were carried out in Central Kalimantan, Indonesia, from July 2009 to March 2011. Carbon dioxide (CO2) and nitrous oxide (N2O) fluxes in tropical peat soils were measured in an undrained natural forest, a drained forest, two burned forests and four croplands. A fumigation-extraction method was used to measure the soil microbial biomass to evaluate the relationships among the soluble organic carbon (SOC), microbial biomass carbon (MBC) and nitrogen (MBN) and the CO2 and N2O fluxes in peat soils. Regarding the relationships between weekly precipitation and N2O emission, positive relationships were found in both the forest and cropland soils. However, the slope of the regression line was much higher in the croplands than in the forest soils. The CO2 fluxes in the croplands but not in the forest soils were significantly correlated with both precipitation and N2O fluxes. In contrast, the CO2 fluxes in the forest but not in the croplands were significantly correlated with the MBC and the MBC/SOC ratio. The SOC did not show any relationship with the CO2 fluxes but showed a positive relationship with the MBN and a negative linear relationship with the nitrate (NO3–) concentration. In addition, the MBN showed a negative relationship with most of the probable numbers of ammonium oxidizers. These results indicate that the agricultural land use of tropical peat soils varied the factors controlling greenhouse gas emissions through microbial activities. Therefore, the microbial biomass may be a key factor in controlling CO2 fluxes in forest soils but not in agricultural peat soils. However, precipitation may be a key factor in agricultural peat soils but not in forest soils.
INTRODUCTION
Peatland is an area with an accumulation of partly decomposed organic matter, with an ash content equal to or less than 35%, a peat depth equal to or greater than 50 cm, and an organic carbon (C) content (by weight) of at least 12% (Purnomo et al. Citation2012). Although tropical peatlands account for more than 8% (33–49 Mha) of the total peatlands worldwide (386–409 Mha), the relatively greater depth of tropical peat soils lies in a stock of more than 70 Gt C, which occupies approximately 20% of the global peat soil C (Muhanmad and Rieley Citation2002) and 2% of the global soil C. Peatlands in Southeast Asia extend to at least 26 Mha (69% of all tropical peatlands) and are approximately 50 m above sea level, mostly near the coasts of East Sumatra, Kalimantan; West Papua, Papua New Guinea; Brunei, Peninsular Malaya; Sabah, Sarawak, and Southeast Thailand (Muhanmad and Rieley Citation2002). These peatlands account for low-altitude coastal and sub-coastal situations but may extend inland for distances greater than 150 km along river valleys and across catchments (Wösten et al. Citation2008).
However, due to high levels of organic C, and hydrological conditions, tropical peat soils can become sources of greenhouse gas emissions (Inubushi et al. Citation2003). Peat swamp forests as well as other forests on mineral soils have been logged intensively through the official concession system, and the canals that are dug into the surface of the peat soils enhance the drainage to decrease the groundwater level, exposing the peat soils to the risk of fire and microbial decomposition (Wösten et al. Citation2008). In addition, a large portion of the tropical peatlands in Southeast Asia have since the 1970s been drained and converted to agricultural land to accelerate microbial decomposition, which results in significant C outputs to the atmosphere, contributing to climate change processes (Page et al. Citation2002; Takakai et al. Citation2006; Hirano et al. Citation2007; Jauhiainen et al. Citation2008; Toma et al. Citation2011).
In studying the characteristics of peat soils, it was found that some agricultural peat soils emit large amounts of nitrous oxide (N2O), which is derived from soil organic nitrogen (N) (Toma et al. Citation2011). Although the N2O emissions from tropical peatlands tend to be higher and more varied compared with those of other soils, the impacts of land use management on the conversion rate of soil organic N to N2O have yet to be clarified. It is interesting to note that land reclamation from natural forests to croplands has increased the N2O emissions from tropical peatlands, although high organic matter contents were recorded from most of those soils (Inubushi et al. Citation2003; Takakai et al. Citation2006; Melling et al. Citation2007).
A clarification of the process of peat decomposition under different land uses is important to better estimate the greenhouse gas fluxes from peatlands. There are reports demonstrating how the carbon dioxide (CO2) and N2O fluxes are affected by land use change in peatlands (Inubushi et al. Citation2003; Takakai et al. Citation2006). However, few studies have investigated the relationships among CO2 and N2O emissions and the populations of related soil microorganisms (Jumadi et al. Citation2008) or the microbial biomass in tropical peatlands (Inubushi et al. Citation2005). Although Sjögersten et al. (Citation2011) reported that the microbial biomass concentrations in tropical peatlands under forest sites decreased in parallel with nutrient concentrations, whether the microbial activity is limited by nutrients, labile C or even environmental conditions remains unknown. Because even the relationships among the microbial biomass and related factors have not been clarified, the effect of these factors on greenhouse gas emissions from peatlands still needs to be researched to explain the high greenhouse gases emissions in tropical peatlands.
A factorial analysis on CO2 and N2O fluxes regarding factors controlling the microbial biomass will more clearly explain the effect of land use change on the microbial biomass and on the relationships between the microbial biomass and greenhouse gases emissions in tropical peatlands. The aim of this study was to determine the effect of land use change (drainage, forest fire and agricultural land use) on the contribution of the factors that control gas emission with respect to the characteristics of microbes in tropical peat soils. To achieve this, (1) a comparison of the seasonal dynamics of greenhouse gas fluxes and the soil microbial biomass and their possible controlling factors and (2) a clarification of the relationships among variable factors such as meteorological data, soil chemical properties, fluxes of CO2 and N2O, microbial biomass and populations in tropical peatlands that are subjected to land use change (drainage, fire and cultivation) were conducted.
MATERIALS AND METHODS
Field site description
A field investigation was conducted in Kalampangan Village near Palangka Raya (2°17'–2°21'S, 113°54'–114°01'E) in Central Kalimantan, Indonesia, from July 2009 to March 2011 (). This peatland was reclaimed via the construction of canals in 1995 (Muhanmad and Rieley Citation2002). The dry season in this region generally begins in May or June and lasts until October (Hirano et al. Citation2007).
Figure 1 Locations of the gas and soil sampling sites in Kalampangan, Central Kalimantan, Indonesia (modified from Hirano et al. Citation2007). UNF: undrained natural forest; DF: drained forest; BFa–b: two sites in the burned forest; CLa–d: four sites in the croplands.
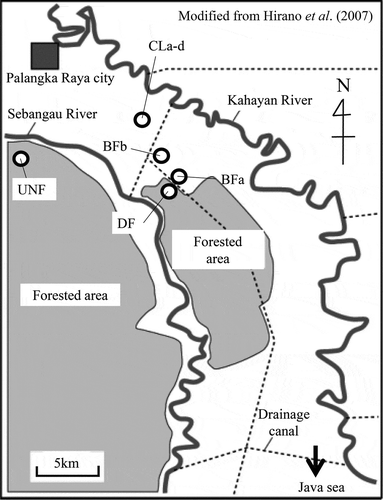
Although the burned forest was destroyed by forest fires in 1997 and 2002 (surface peat soils up to 30 cm in depth were burned during the fires), the natural forest and drained forest were not affected by these fires (Hashidoko et al. Citation2008). In the drained forest, the depth of the peat soil ranged from 3.50 to 4.85 m (Tuah et al. Citation2001). According to the United States Department of Agriculture (USDA) Soil Taxonomy, all of the study sites were Histosols (Typic Tropofibrists) (Takakai et al. Citation2006). The thickness of the peat was 2.6–2.8 m. The bulk density and porosity of the surface soil (0–10 cm) were approximately 0.4 g cm−3 and 73–88%, respectively. The C and N contents of the surface soil (0–10 cm) ranged from 530 to 632 and 13 to 14.3 g kg−1, respectively (Toma et al. Citation2011). The vegetation that existed before the forest fire consisted mostly of deciduous trees, such as Tetramerista glabra Miq., Calophyllum sp., Shorea sp., Combretocarpus rotundatus (Miq.) Danser, Palaquium sp., Buchanania sessifolia Bl., Syzygium sp., Dactylocladus stenostachys Oliv. in Hook, Dyera costulata (Miq.) Hook.f., Ilex cymosa Bl., Tristaniopsis obovata R. Br. and Diospyros sp., and still exists as a natural forest (Tuah et al. Citation2001). After the fire, the vegetation was changed and became covered by ferns, such as Stenochlaena palustris (Burm.f.) Bedd. and Nephrolepis sp. (Takakai et al. Citation2006).
Cultivation began in 1980 on cropland a–c (CLa–c) and 1996 on cropland d (CLd). After ploughing, the croplands were cultivated with cassava (Manihot esculenta Crantz.), maize (Zea mays L.), or vegetables [e.g., eggplant (Solanum melongena L.)]. The amount of N fertilization (mainly urea as described by Takakai et al. Citation2006) applied to CL during the observation period ranged from 1351–1577 kg N ha−1 year−1 according to the farmer (472–1607 kg N ha−1 year−1 from April 2004 to March 2007, reported by Toma et al. Citation2011). Our research sites were distributed into eight sites (): a tract of undrained natural forest (UNF: 2°19'S, 113°54'E described in Hirano et al. Citation2009), a tract of drained forest (DF: 2°21'S, 114°02'E, described in Takakai et al. Citation2006), two tracts of burned forests (BFa–b: 2°19'S, 114°01'E) and four adjacent tracts of croplands (CLa–d: 2°17'S, 114°01'E). The general site information for DF, BF and CL is described in Takakai et al. (Citation2006).
Soil sampling and analyses of the soil properties
Undistributed 100-cm3 core samples and composite soil samples were collected from a depth of 0–10 cm in July and December 2009; July, September and November 2010, and March 2011, passed through a 2-mm mesh sieve and used for laboratory measurements. The composite soil samples were kept in a cold room (4°C) until use. The soil pH was measured with a glass electrode after 1 h of shaking with distilled water. The soil electric conductivity (EC) and total organic C and N contents were determined according to the standard method of soil analysis (Black et al. Citation1981). Five grams of soil was immediately extracted with 25 mL of 1 M potassium chloride (KCl; 1:5) solution by shaking for 30 min on a reciprocal shaker and filtered with filter paper (Advantec No. 6, Tokyo, Japan). The concentrations of ammonium and nitrate N were measured using the nitroprusside (Anderson and Ingram Citation1993) and hydrazine reduction methods (Hayashi et al. Citation1997). Undistributed soil cores were sampled for the measurement of soil volume proportion using a three-phase meter (DIK-1130, Daiki Rika Kogyo Co. Ltd, Saitama, Japan). The core samples were weighed before being oven-dried at 105°C for 48 h. After drying, the samples were reweighed to calculate the soil moisture content, bulk density and water-filled pore space (WFPS). Based on the bulk density, the chemical and biological data ware converted to area base data.
Meteorological data collection and in situ measurements of CO2 and N2O fluxes
The daily air temperature data were obtained from a weather history website (Weather Underground 2013). The precipitation was measured daily with a tipping bucket rain gauge (Campbell Scientific, Inc., Logan, UT, USA). Gaseous fluxes were measured along with soil samplings, except for the CO2 measurement only at UNF, BFb and CLd in September and November 2010 and March 2011. Gas samples were collected by closed cylindrical polyvinyl chloride (PVC) chambers (Furukawa et al. Citation2005; Hadi et al. Citation2005). The gas samples were taken from the triplicate chambers at 0, 10 and 20 min using 30-mL syringes and then immediately transferred to 22-mL evacuated air glass vials with butyl rubber stoppers. The concentrations of CO2 and N2O were quantified using gas chromatographs (Shimadzu 14B, Japan) equipped with a thermal detector and an electron capture detector, respectively. The gas fluxes were calculated using the equation below, which is described in Takakai et al. (Citation2006), and the annual gas emissions were calculated using the trapezoid rule (Whittaker and Robinson Citation1967).
where F is the flux (in mg C m−2 h−1 for CO2 and mg N m−2 h−1 for N2O), ρ is the gas density (ρCO2-C = 0.536 kg C m−3, and ρN2O-N = 1.25 kg N m−3 at 273 K and 760 mm Hg), V is the volume of the chamber (in m3), A is the cross-sectional area of the chamber (in m2), Δc/Δt is the change in the gas concentration inside the chamber as function of time (m3 m−3 h−1), T is the air temperature inside the chamber (in °C), 273 is a correction factor between °C and K, and P is the air pressure (in mm Hg). The value of P was assumed to be 760 mm Hg in our calculation. The methane (CH4) flux data were obtained using a gas chromatograph that was equipped with a flame ionization detector that was not described in this study because the fluxes were negligible.
Measurement of microbial biomass contents and MPN enumeration
A fumigation-extraction method was used to measure microbial biomass (Inubushi et al. Citation1991; Joergensen Citation1996) after 10 d of pre-incubation (25°C) in all of the samples except for those that were collected in July 2009. The amount of potassium sulphate (K2SO4)-extracted SOC and MBC was measured using a TOC meter (Shimadzu, TOC 5000). In addition, the MBN was measured using the persulphate oxidation-hydrazine reduction method (Sakamoto and Hayashi Citation1999).
The most probable number (MPN) counts of ammonium oxidizers and nitrite oxidizers were determined using microtiter plates with a two-fold dilution series, ATCC929 medium for ammonium oxidizers and ATCC480 medium for nitrite oxidizers (Bruns et al. Citation1999). The soil samples were dispersed for 1 min with 100 mM sodium phosphate buffer (pH 7.0), and coarse particles were allowed to settle for 1 min. The soil suspensions were then serially diluted in three separate 96-well microtiter plates containing each medium. The inoculated plates were double-sealed with Parafilm, wrapped in humidified plastic bags and incubated at 25°C in the dark for 2 months before testing aliquots from the wells for nitrate and nitrite. A growth assessment was carried out using Griess-Ilosvay reagents. The MPN values were calculated using the tables of Rowe et al. (Citation1977). Regarding denitrifiers, the MPN was determined using 30-mL sterile bottles with 10 mL of NB medium containing potassium nitrate (KNO3) 500 mg L−1. The growth assessment was conducted using a gas chromate graph that was equipped with an electron capture detector to measure the N2O in the bottles (Tiedje Citation1994).
Statistical analyses
All of the statistical analyses were carried out using the SPSS 11.0 software for Windows (SPSS, Chicago, IL, USA). The means and standard deviations of the data were calculated. A mean comparison was performed using the least significant differences (LSD = 0.05) with the SPSS 11.0 software.
RESULTS
Soil characteristics and seasonal dynamics of microbial biomass and fluxes of CO2 and N2O
As is typical for peatlands, the soil organic C and N contents were high (). Regarding the soil characteristics in CL, low SOC and total organic C and higher pH and nitrate concentrations were observed. Higher cumulative CO2 fluxes were observed in CL (2.39 ± 0.11 to 3.06 ± 0.42 kg C m−2 year−1) despite lower MBC than that in forest soils (2.39 ± 0.11 to 3.06 ± 0.42 kg C m−2 year−1 in CL, 0.70 ± 0.24 to 1.97 ± 0.42 kg C m−2 year−1 in forest soils, ). Among forest soils, higher CO2 fluxes and MBC were observed in DF than those in UNF, and the lowest CO2 fluxes and microbial biomass were observed in the burned forests (). Regarding the N2O fluxes, the cumulative N2O fluxes in CL were also higher (55.1 ± 4.5 to 115 ± 21.1 g N m−2 year−1) than those in the forest soils (0.064 ± 0.069 to 0.17 ± 0.023 g N m−2 year−1) in 2010 (). The weekly precipitation (mm week–1) showed a seasonal pattern reflecting El Niño in 2009 and La Niña in 2010 and significant positive relationships with the N2O fluxes in forest soils (r = 0.52, n = 15) and in CL (r = 0.80, n = 21), but the slopes were 1000 times higher in CL than those in the forest soils (0.100 [µg N m–2 h–1] / [mm week–1] in forest soils, 0.101 [mg N m–2 h–1] / [mm week–1] in CL). The CO2 fluxes in CL but not in the forest soils also correlated significantly with the precipitation (r = 0.90, n = 21) (). In contrast, the air temperature did not show seasonal changes or any relationship with gas fluxes or microbial biomass. Additionally, the CO2 fluxes in CL but not in forest soils showed a significant positive relationship with the N2O fluxes (r = 0.78, n = 21, ).
Figure 2 Seasonal dynamics of carbon dioxide (CO2) fluxes (a) in the forest and (b) in the croplands, and dynamics of microbial biomass carbon (c) in the forest and (d) in the croplands. C, carbon; UNF: undrained natural forest; DF: drained forest; BFa: burned forest; CLa–d: croplands. The error bars show half of the standard deviations. The BFb (second burned forest site) was not measured.
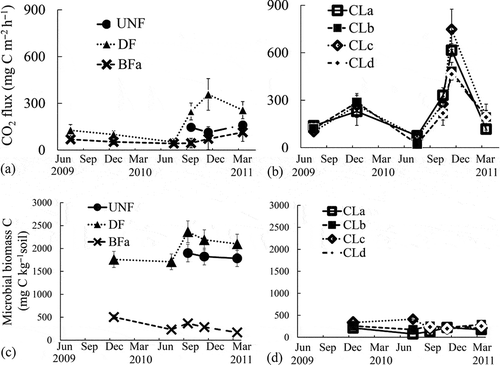
Figure 3 Seasonal dynamics of (a) air temperature, (b) precipitation during each month, nitrous oxide (N2O) flux (c) from the forest and (d) from the croplands (CL), and relationships between the precipitation and N2O fluxes (e) from the forest and (f) from the croplands. A broken line indicates a significant (p < 0.05, n = 15) correlation in the forest soils and a solid line indicates a significant (p < 0.01, n = 21) correlation in CL. UNF: undrained natural forest; DF: drained forest; BFa: burned forest; CLa–d: croplands. The error bars show half of the standard deviations. The BFb (second burned forest site) was not measured.
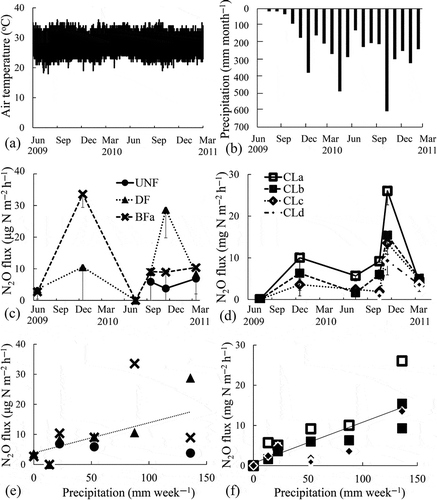
Figure 4 Correlations between the precipitation and carbon dioxide (CO2) flux (a) in the forest soils and (b) in the croplands (CL). Solid lines indicate significant (p < 0.01, n = 21) regressions in CL. C, carbon; UNF, undrained natural forest; DF, drained forest; BFa–b, burned forest.
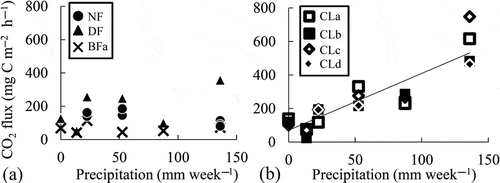
Figure 5 Correlations between the carbon dioxide (CO2) fluxes and nitrous oxide (N2O) fluxes from the peat soils. Solid lines indicate significant (p < 0.01, n = 21) regressions in croplands (CL). C, carbon; UNF, undrained natural forest; DF, drained forest; BF, burned forests.
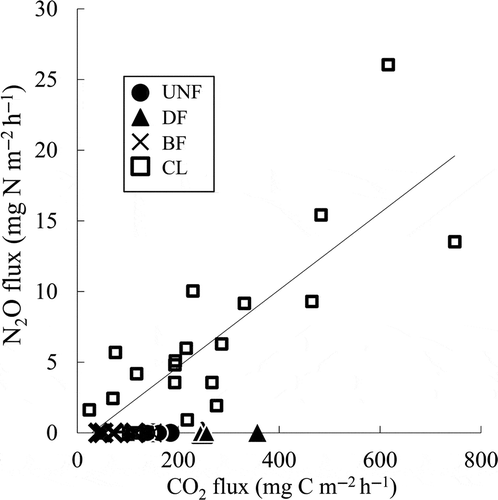
Table 1 Physicochemical characteristics of the eight different soil samples of an undrained natural forest, a drained forest, two burned forests and four croplands [n = 3, mean ± standard error (SE), November 2010]
Soluble organic C, microbial biomass C and microbial biomass N
The MBC and MBC/SOC ratio showed significant positive relationships with the CO2 fluxes in the forest soils (r = 0.74 and r = 0.96, respectively, n = 17, ), but not in CL (, ). In contrast, the pH showed significant positive relationships with the SOC and MBN in CL () but not in the forest soils. Irrespective of land use, the SOC showed significant positive linear relationships with the MBC and MBN (, ) and a negative relationship with the NO3– (r = 0.82, r = 0.95, and r = −0.48, respectively, n = 28, , i) in all of the forest soils and CL. The MBN showed a significant negative relationship with the MPN of the ammonium oxidizers (b).
Figure 6 Correlations among (a) the microbial biomass carbon (MBC) and (b) the soluble organic carbon (SOC) contents at a depth of 0–10 cm, (c) the MBC/SOC ratio of the peat soils and the carbon dioxide (CO2) flux of the peat soils. Solid lines indicate significant (p < 0.01, n = 17) regressions in the forest soils. C, carbon; UNF, undrained natural forest; DF, drained forest; BF, burned forests; CL, croplands.
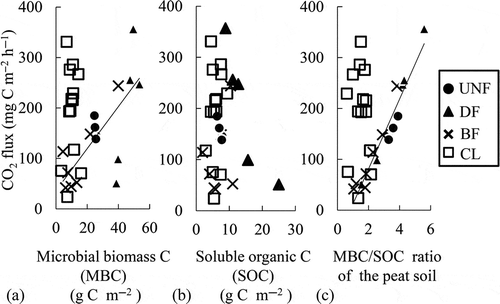
Figure 7 Correlations among the soluble organic carbon (C) and (a) microbial biomass carbon and (b) microbial biomass nitrogen (N). A broken line indicates a significant (p < 0.05, n = 28) correlation and a solid line indicates a significant (p < 0.01, n = 28) correlation in the forest soils and croplands, respectively. UNF, undrained natural forest; DF, drained forest; BF, burned forest; CL, croplands.
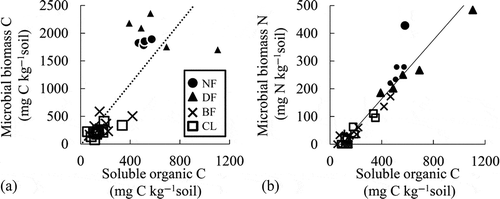
Figure 8 The relationship between (a) the soluble organic carbon and nitrate (NO3–) and (b) the relationship between the microbial biomass nitrogen (N) and the most probable number (MPN) of ammonium oxidizers. Solid lines indicate significant correlations in the forest soils and cropland soils (both r = 0.48, p < 0.01, n = 28). C, carbon; UNF, undrained natural forest; DF, drained forest; BF, burned forest; CL, croplands.
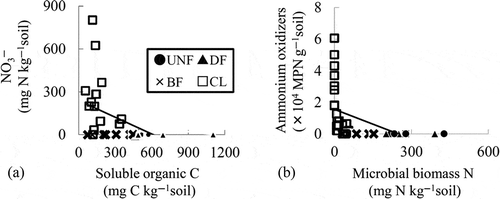
Figure 9 Population of (a) ammonium oxidizers, (b) nitrite oxidizers and (c) denitrifiers in tropical peatlands. DFa: drained forest; BFa,b: burned forest; CLa–d: croplands.† n.d.: not detected. The error bars show the standard error (n = 8). Sampled in July, 2010.
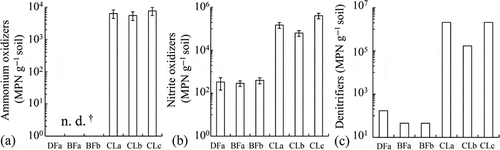
Table 2 Correlation coefficients (r) for relationships among soil chemical characteristics, population of ammonium oxidizers and nitrate oxidizers, microbial biomass, nitrous oxide (N2O) fluxes and carbon dioxide (CO2) fluxes in croplands
MPN of ammonium oxidizers, nitrite oxidizers and denitrifiers and the N cycle
Although the MBC and MBN in CL were lower than those in UNF and DF (), a higher MPN of nitrifiers and denitrifiers was detected in CL accompanied with a high nitrate concentration (). A correlation analysis of the soil chemical properties and microbial properties in CL showed that the soil pH had significant negative relationships with the EC, nitrate concentration and MPN of nitrite oxidizers and positive relationships with the SOC and MBN (). The MPN of nitrite oxidizers showed significant positive relationships with the ammonium and nitrate concentrations in the soil and the N2O fluxes (). The MBN but not the MBC showed a significant negative relationship with the MPN of ammonium oxidizers ().
DISCUSSION
The CO2 fluxes in the DF and CL were greater than those in the UNF, indicating that the drainage of tropical peatlands enhanced the CO2 fluxes, although our greenhouse gas monitoring frequency was not sufficient to make a definite conclusion (). Greater CO2 fluxes were observed in CL than in the forest soils, most likely because the soil was initially drained and then fertilized for vegetable cropping. Regarding the forest soils, the MBC contents had a significant positive relationship with the CO2 fluxes (). Because the MBC in DF was greater than in UNF, drainage might enhance the microbial activity to increase the microbial biomass.
The CO2 fluxes in CL were greater than those in the forest soils, although the MBC in the CL was much lower than in DF and UNF (). It was interesting to note that the CO2 fluxes in CL but not in the forest soils increased with the precipitation (). Regarding the relationship between the weekly precipitation and N2O emissions, significant positive relationships were found both in the forest soils and in CL. However, the slope of the regression line was 1000 times higher in CL than in the forest soils (). These results indicate that the agricultural land use of tropical peatlands may vary the soil conditions such that the greenhouse gas emissions increase and become more closely related to the rainfall.
As Furukawa et al. (Citation2005) reported, the CO2 fluxes tend to decrease with increases in the precipitation due to the limitation of gas permeability and oxygen availability. Because the CO2 emission was accompanied by high N2O fluxes and precipitation, the reason for the effect of rainfall could be the disturbance of the soil organic matter by drying-rewetting. This effect is generally considered to occur during abiological soil organic matter decomposition processes, such as (1) chemical oxidation or hydrolysis, (2) the diffusion from inaccessible soil pores or aggregates, (3) the desorption from the solid phase and (4) the action of extracellular stabilized enzymes that convert non-bioavailable soil organic matter into bioavailable soil organic matter (Kemmitt et al. Citation2008; Sawada et al. Citation2010). However, the contribution of denitrification on the high CO2 fluxes also needs to be considered because a significant positive relationship between the N2O and CO2 fluxes was observed in this study (). In CL, previous research has detected high N2O fluxes when the water-filled pore space was greater than 60% (Takakai et al. Citation2006). In addition, Toma et al. (Citation2011) reported significant correlations between the N2O fluxes and the water-filled pore space and suggested that the N2O fluxes might be derived mainly from denitrification. The relationships between the precipitation and the fluxes of N2O and CO2 that were obtained in this study indicate that the precipitation created adequate soil moisture for denitrification in the soils. These results also suggest that the CO2 fluxes in CL may be emitted mainly by denitrifiers without the N2O-reducing activity in CL.
Although our sampling frequency was not sufficient to quantify an adequate value of annual greenhouse gas emissions, our results recorded the same level of cumulative N2O emissions in CL (55.1 ± 4.5–115 ± 21.1 g N m−2 year−1, ) as the emissions in CL that were reported in Toma et al. (Citation2011), whose value could be the highest value to date (12.6–698 kg N ha−1 year−1).
N2O has a 298-times-higher global warming potential (GWP) than that of CO2 in a time horizon of 100 years on a molar basis (IPCC Citation2007). The GWP that was derived from the emissions of CO2 and N2O was considered soil-derived GWP. The result from the calculation of the GWP, according to the IPCC (Citation2007), indicates that the ratio of the GWP of the cumulative N2O emissions (kg-CO2-equivalent m−2 year−1) to the GWP of the CO2 and N2O emissions (kg-CO2-equivalent m−2 year−1) in CL (69.7–84.5%) was much higher than that in the forest soils (1.07–1.15%). This result indicates that N2O may play a more important role in CL in greenhouse gas emissions than does CO2 in tropical peatlands with agricultural land use. Xu et al. (Citation2008) reported significant linear regressions of the soil CO2 and N2O fluxes in eight ecosystems (bogs and fens, boreal and temperate forests, temperate grasslands, dry croplands, rice paddies, tropical savannahs and grasslands, subtropical and tropical dry forests and subtropical and tropical moist forests) and slope values ranging from 0.0688–0.6629. Regarding these values, our results show that the slope between the CO2 and N2O fluxes in CL was 26.38, much higher than these previously published values (). It was suggested that the high N2O fluxes that were detected in this study (3.48 μg N m−2 h−1 –26.06 mg N m−2 h−1) might also drastically increase the N2O/CO2 ratio. Because the N2O emissions in tropical agricultural peat soils are much more variable compared with those of agricultural fields on mineral soils and boreal peat lands (Toma et al. Citation2011), it was still necessary to develop a large spatial scale evaluation of tropical agricultural peat soil with respect to the mechanisms of high N2O emissions.
The relationship between the greenhouse gas fluxes and the related microbial properties in the forest soils also differed from the soils in CL. The MBC and MBC/SOC ratio showed significant positive linear relationships with the CO2 fluxes in forest soils but not in CL (). These results indicated that agricultural land use of tropical peat soils might vary the contribution of each factor controlling the greenhouse gas emissions, particularly the microbial biomass in the soils. The microbial biomass may be a key factor in the control of the CO2 fluxes in forest soils but not in agricultural peat soils. However, precipitation may be a key factor in agricultural soils but not in forest soils.
From the viewpoint of microbial biomass in peat soils, it is also interesting to note that the SOC showed a stronger relationship with the MBN than with the MBC (). Additionally, the SOC also showed a negative significant correlation with the soil NO3–. These results indicate that N assimilation might activate more than the C assimilation by the SOC, affecting the NO3– concentration. In CL, the SOC also showed a significant positive relationship with the MBN. In addition, the MBN showed a significant negative relationship with the MPN of ammonium oxidizers (, ). These results indicate that the SOC, the amount of substrates, might enhance the N assimilation by heterotrophic microorganisms and N competitors for nitrifiers. Because the MPN of nitrite oxidizers was well correlated with the N2O and CO2 fluxes in CL (), the effect of N competition on the nitrification activity could play an important key role in the mechanisms of N2O and CO2 emission. Regarding the effect of N competition on N2O emission, several reports have also suggested that N competition may inhibit N2O emissions (Khalil and Inubushi Citation2007; Wang et al. Citation2011). Although few reports have clarified the effect of SOC or microbial biomass on N competition, Cai et al. (Citation2003) studied the relationship between the MBC and SOC to estimate the N2O emission in the denitrification-decomposition (DNDC) model with respect to N competition. Because the SOC did not enhance the CO2 fluxes but increased the MBN in this study, the low SOC content in CL may inhibit N competition to increase the N2O fluxes without enhancing the CO2 fluxes. To reduce the greenhouse gas emissions, an increase in the SOC to inhibit the N2O fluxes by enhancing N competition could be expected. Land use management to preserve high SOC contents in soils may be effective in mitigating the greenhouse gas emissions and required for discussion in further experiments.
Although the SOC, the amount of substrate for microbes, did not enhance the CO2 fluxes in this study, the SOC would be converted to the MBC and CO2 flux through C assimilation and respiration. It is interesting to note that the MBC/SOC ratio showed a more intensely significant relationship with the CO2 flux than did the MBC in the forest soils. It was indicated that the MBC/SOC ratio might be a more effective indicator than MBC in illustrating the microbial activity in tropical peat soils. Sawada et al. (Citation2008) mentioned that soil microbes emit CO2 actively by synthesising structural compounds with acquired labile C under conditions where the labile C exceeds a threshold concentration. Regarding this trait, it was also considered that the linear relationship between the MBC/SOC ratio and the CO2 flux could illustrate the microbial synthesis of structural compounds. However, further studies are required to explain why the linear relationship was found only in forest soils but not in CL.
In conclusion, the effects of soil environmental changes on the functions of the microbial biomass need to be considered to evaluate the high greenhouse gas emissions in tropical peatlands as affected by drainage and by agricultural land use changes, such as fertilization or forest fires. The results of this study indicate that the agricultural land use of tropical peat soils varied the contribution of each factor controlling the greenhouse gas emissions. Therefore, the microbial biomass may be a key factor in controlling the CO2 fluxes in forest soils but not in agricultural peat soils. However, precipitation may be a key factor in agricultural soils but not in forest soils.
ACKNOWLEDGMENTS
This research was supported by the Science and Technology Research Partnership for Sustainable Development program of the Japan International Cooperation Agency and Japan Science and Technology Agency. We also thank the staff of the University of Palangka Raya for field investigation support.
REFERENCES
- Anderson JM, Ingram JSI 1993: Colorimetric determination of ammonium. In Tropical Soil Biology and Fertility: a hand-book of methods, Eds. Anderson JM, Ingram JSI 42–43. ISSS, CAB International, Wallingford.
- Black CA, Evans DD, White JJ, Ensminger LE, Clerk FE, (Eds.) 1981: Methods of Soil Analysis Part 2, American Society of Agronomy, Madison, Wisconsin, p. 1572.
- Bruns MA, Stephen JR, Kowalchuk GA, Prosser JI, Paull EA 1999: Comparative diversity of ammonia oxidizer 16S rRNA gene sequences in native, tilled, and successional soils. Appl. Environ. Microbiol., 65, 2994–3000.
- Cai Z, Sawamoto T, Li C, Kang G, Boonjawat J, Mosier A, Wassmann R, Tsuruta H 2003: Field validation of the DNDC model for greenhouse gas emissions in East Asian cropping systems. Glob. Biogeochem. Cycl., 17, doi:10.1029/2003GB002046
- Furukawa Y, Inubushi K, Ali M, Itang AM, Tsuruta H 2005: Effect of changing groundwater levels caused by land-use changes on greenhouse gas fluxes from tropical peat lands. Nutr. Cycl. Agroecosyst., 71, 81–91. doi:10.1007/s10705-004-5286-5
- Hadi A, Inubushi K, Furukawa Y, Purnomo E, Rasmadi M, Tsuruta H 2005: Greenhouse gas emissions from tropical peatlands of Kalimantan, Indonesia. Nutr. Cycl. Agroecosyst., 71, 73–80. doi:10.1007/s10705-004-0380-2
- Hashidoko Y, Takakai F, Toma Y, Darung U, Melling L, Tahara S, Hatano R 2008: Emergence and behaviors of acid-tolerant Janthinobacterium sp. that evolves N2O from deforested tropical peatland. Soil Biol. Biochem., 40, 116–125. doi:10.1016/j.soilbio.2007.07.014
- Hayashi A, Sakamoto K, Yoshida T 1997: A rapid method for determination of nitrate in soil by hydrazine reduction procedure. Jpn. J. Soil Sci. Plant Nutr, 68, 322–326. in Japanese with English summary)
- Hirano T, Jauhiainen J, Inoue T, Takahashi H 2009: Controls on the carbon balance of tropical peatlands. Ecosystems, 12, 873–887. doi:10.1007/s10021-008-9209-1
- Hirano T, Segah H, Harada T, Limin S, June T, Hirata R, Osaki M 2007: Carbon dioxide balance of a tropical peat swamp forest in Kalimantan, Indonesia. Glob. Change Biol., 13, 412–425. doi:10.1111/j.1365-2486.2006.01301.x
- Inubushi K, Brookes PC, Jenkinson DS 1991: Soil microbial biomass C, N and ninhydrin-N in aerobic and anaerobic soils measured by the fumigation-extraction method. Soil Biol. Biochem., 23, 737–741. doi:10.1016/0038-0717(91)90143-8
- Inubushi K, Furukawa Y, Hadi A, Purnomo E, Tsuruta H 2003: Seasonal changes of CO2, CH4, and N2O fluxes in relation to land-use change in tropical peatlands located in coastal area of South Kalimantan. Chemosphere, 52, 603–608. doi:10.1016/S0045-6535(03)00242-X
- Inubushi K, Sakamoto K, Sawamoto T 2005: Properties of microbial biomass in acid soils and their turnover. Soil Sci. Plant Nutr., 51, 605–608. doi:10.1111/j.1747-0765.2005.tb00073.x
- IPCC 2007: Climate Change 2007: The Physical Science Basis. Cambridge University Press, Cambridge.
- Jauhiainen J, Limin S, Silvennoinen H, Vasander H 2008: Carbon dioxide and methane fluxes in drained tropical peat before and after hydrological restoration. Ecology, 89, 3503–3514. doi:10.1890/07-2038.1
- Joergensen RG 1996: The fumigation-extraction method to estimate soil microbial biomass: Calibration of the kEC value. Soil Biol. Biochem., 28, 25–31. doi:10.1016/0038-0717(95)00102-6
- Jumadi O, Hala Y, Muis A, Ali A, Palennari M, Yagi K, Inubushi K 2008: Influences of chemical fertilizers and a nitrification inhibitor on greenhouse gas fluxes in a corn (Zea mays L.) field in Indonesia. Microbes Environ., 23, 29–34. doi:10.1264/jsme2.23.29
- Kemmitt SJ, Lanyon CV, Waite IS, Wen Q, Addiscott TM, Bird NRA, O’donnell AG, Brookes PC 2008: Mineralization of native soil organic matter is not regulated by the size, activity or composition of the soil microbial biomass - A new perspective. Soil Biol. Biochem., 40, 61–73. doi:10.1016/j.soilbio.2007.06.021
- Khalil MI, Inubushi K 2007: Possibilities to reduce rice straw-induced global warming potential of a sandy paddy soil by combining hydrological manipulations and urea-N fertilizations. Soil Biol. Biochem., 39, 2675–2681. doi:10.1016/j.soilbio.2007.05.003
- Melling L, Hatano R, Goh KJ 2007: Nitrous oxide emissions from three ecosystems in tropical peatland of Sarawak, Malaysia. Soil Sci. Plant Nutr., 53, 792–805. doi:10.1111/j.1747-0765.2007.00196.x
- Muhanmad NZ, Rieley JO 2002: Management of tropical peatlands in Indonesia: Mega reclamation project in Central Kalimantan. In Peatlands for People, Natural Resources Function and Sustainable Management. Proceedings of the International Symposium on Tropical Peatlands, 22–23 August 2001, Eds. Rieley JO, Page SE, pp. 155–160. BPPT and Indonesian Peat Association, Jakarta, Jakarta, Indonesia.
- Page SE, Siegert F, Rieley JO, Boehm HDV, Jaya A, Limin S 2002: The amount of carbon released from peat and forest fires in Indonesia during 1997. Nature, 420, 61–65. doi:10.1038/nature01131
- Purnomo A, Sukadri DS, Helmy F, Osaki M, Hirose K, Mackie C 2012: Policy memo: Peat and definition from uncertainty to certainty, Indonesia climate change center, p2.
- Rowe R, Todd R, Waide J 1977: Microtechnique for most-probable-number analysis. Appl. Environ. Microbiol., 33, 675–680.
- Sakamoto K, Hayashi A 1999: A rapid method for determining the microbial biomass-N in soil –Determination of total-N in soil extract by peroxydisulfate oxidation method. Soil Microorganisms, 53, 57–62. (in Japanese)
- Sawada K, Funakawa S, Kosaki T 2008: Soil microorganisms have a threshold concentration of glucose to increase the ratio of respiration to assimilation. Soil Sci. Plant Nutr., 54, 216–223. doi:10.1111/j.1747-0765.2007.00235.x
- Sawada K, Funakawa S, Kosaki T 2010: Simulating short-term dynamics of non-increasing soil respiration rates by a model using Michaelis-Menten kinetics. Soil Sci. Plant Nutr., 56, 570–578. doi:10.1111/j.1747-0765.2010.00495.x
- Sjögersten S, Cheesman AW, Lopez O, Turner BL 2011: Biogeochemical processes along a nutrient gradient in a tropical ombrotrophic peatland. Biogeochemistry, 104, 147–163. doi:10.1007/s10533-010-9493-7
- Takakai F, Morishita T, Hashidoko Y, Darung U, Kuramochi K, Dohong S, Limin SH, Hatano R 2006: Effects of agricultural land-use change and forest fire on N2O emission from tropical peatlands, Central Kalimantan, Indonesia. Soil Sci. Plant Nutr., 52, 662–674. doi:10.1111/j.1747-0765.2006.00084.x
- Tiedje JM 1994: Denitrifiers. In Microbiological and Biochemical Properties. Eds. Weaver RD, Angle JS, Bottomley PS, pp. 245–267. Soil Science Society of, America, Madison.
- Toma Y, Takakai F, Darung U, Kuramochi K, Limin SH, Dohong S, Hatano R 2011: Nitrous oxide emission derived from soil organic matter decomposition from tropical agricultural peat soil in central Kalimantan, Indonesia. Soil Sci. Plant Nutr., 57, 436–451. doi:10.1080/00380768.2011.587203
- Tuah SJ, Osaki M, Matsubara T 2001: Study on leaf elemental characteristics of native plants grown in a distinct ecosystem of tropical peatland in Central Kalimantan. In Environmental Conservation and Land Use Management of Wetland Ecosystem in Southeast Asia, Annual Report of JSPS-LIPI Core University Program for April 2000–March 2001. pp. 69–84. Graduate School of Environmental Earth Science, Hokkaido University, Sapporo.
- Wang JY, Jia JX, Xiong ZQ, Khalil MAK, Xing GX 2011: Water regime–nitrogen fertilizer–straw incorporation interaction: Field study on nitrous oxide emissions from a rice agroecosystem in Nanjing, China. Agric. Ecosyst. Environ., 141, 437–446. doi:10.1016/j.agee.2011.04.009
- Weather Underground 2013: Weather Underground, Weather History & Observations. http://www.wunderground.com/history/station/96655/2009/7/1/DailyHistory.html?MR=1 (April 2013).
- Whittaker ET, Robinson G. 1967: Trapezoidal and Parabolic rules. In The calculus observation: A Treatise of Numerical Mathematics, Chapter VII 77 pp. 156–158. Dover, NY.
- Wösten JHM, Clymans E, Page SE, Rieley JO, Limin SH 2008: Peat–water interrelationships in a tropical peatland ecosystem in Southeast Asia. Catena, 73, 212–224. doi:10.1016/j.catena.2007.07.010
- Xu X, Tian H, Hui D 2008: Convergence in the relationship of CO2and N2O exchanges between soil and atmosphere within terrestrial ecosystems. Glob. Change Biol., 14, 1651–1660. doi:10.1111/j.1365-2486.2008.01595.x