
Abstract
Oil palm (Elaeis guineensis Jacq.) production in Indonesia and Malaysia is currently the focus of concern due to its potential impact on the environment via greenhouse gas emissions. Oil palm plantations have been reported to release large quantities of nitrous oxide (N2O) into the atmosphere, which is most likely linked to nitrogen (N) fertilizer use. However, there are still limited studies comparing effects of the type of soil and N fertilizer on N2O and carbon dioxide (CO2) emissions. This study aimed to evaluate the effects of soil types and N fertilizer on N2O and CO2 emissions in oil palm plantations. N2O and CO2 emissions were measured for 15–16 months from 2010–2012 in Tunggal sandy loam soil, Indonesia, and in Simunjan sandy soil and Tatau peat soil, Malaysia. Within each site, treatments with coated fertilizer and conventional fertilizer, and unfertilized with and without tillage, were established. N2O and CO2 fluxes showed high variabilities with seasons, types of soil and fertilizer treatments. The mean of the N2O fluxes from each treatment in the Simunjan sandy soil was the lowest among the three soils, ranging from 0.80 to 3.81 and 1.63 to 5.34 μg N m−2 h−1 in the wet and dry seasons, respectively. The mean of the N2O fluxes from each treatment in the Tunggal sandy loam soil ranged from 27.4 to 89.7 and 6.27 to 19.1 μg N m−2 h−1 in the wet and dry seasons, respectively. The mean of the N2O fluxes was found to be the highest among the three soils in each treatment of the Tatau peat soil, ranging from 131 to 523 and 66.1 to 606 μg N m−2 h−1 in the wet and dry seasons, respectively. The N application rate of coated fertilizer was about half that of conventional fertilizer and was applied as deep placement. In the Tungal soil, coated fertilizer reduced N2O emissions by 31 and 48% in wet and dry seasons, respectively, compared to the conventional fertilizer, and was similar to unfertilized treatment. However, N2O emissions increased in Simunjan and Tatau soils during dry seasons. There was no significant difference between treatments. These results show that N2O and CO2 fluxes in the tropical oil palm plantations were significantly affected by the type of soil, but not always by fertilizer treatments.
INTRODUCTION
Carbon dioxide (CO2) and nitrous oxide (N2O) account for 77 and 7.9% of the total anthropogenic greenhouse gas (GHG) emissions, respectively, at different values of global warming potentials (Rogner et al. Citation2007). Agricultural soils act as both a source and a sink for carbon and nitrogen (N) gases (Bouwman et al. Citation1995). From a greenhouse gas perspective, the fertilizers with the largest effects are the N-based forms that produce N2O, including ammonium nitrate, ammonium sulphate and urea. According to the Intergovernmental Panel on Climate Change (IPCC), 1 kg of N2O has an equivalent impact of approximately 298 kg of CO2. N2O is responsible for 7.5% of the calculated greenhouse effect caused by human activity. The concentration of N2O in the atmosphere is increasing at a rate of approximately 0.2% per year (IPCC Citation2007).
N2O is produced by both the oxidation of ammonium (NH4+) to nitrate (NO3–) (i.e., nitrification) and the reduction of NO3– to dinitrogen gas (N2) (i.e., denitrification). N2O is either the by-product (nitrification) or the intermediate product (denitrification) of these processes (Firestone and Davidson Citation1989). Because of these changes to the N cycling 100-yr lifetime caused by soil disturbance and use of N fertilizers, N2O emissions from agricultural soils are particularly large, and obtaining reliable estimates is not straightforward (Syväsalo et al. Citation2004). The amount of N2O released is usually related to N application as organic or mineral fertilizers; a linear relationship between N2O emission and fertilizer input has been found (Bouwman Citation1990), and it is dependent on the form in which the N fertilizers are used, the location (i.e., soil type and climatic conditions) and the cultivated crops present (Corre et al. Citation1995; MacKenzie et al. Citation1998; Nagano et al. Citation2012).
The emission factor (EF, i.e., the ratio of N2O-N emission to input of N fertilizer) is often estimated using the default IPCC value as 1% for mineral soil, but 16% for tropical organic soil (peat soils) (IPCC Citation2006). However, there are large variations in EF due to differences in environment, crops and management.
Oil palm (Elaeis guineensis Jacq) production in Indonesia and Malaysia is currently the focus of debates due to its potential impact on the environment when tropical rain forests are converted into such plantations (Dewi et al. Citation2009). Oil palm plantations have been reported to release large quantities of N2O into the atmosphere, which is most likely linked to N fertilizer use. When examining the GHG emissions among land uses in Jambi, Sumatra Island, Indonesia, Murdiyarso et al. (Citation2002) found that oil palm plantations released large quantities of N2O into the atmosphere.
N fertilizer, by increasing N availability, plays a significant role in soil carbon sequestration by increasing crop biomass and by influencing the microbial decomposition of crop residue (Green et al. Citation1995; Lal Citation2004). Although applications of N fertilizer consistently increase crop biomass, its effect on soil carbon content varies with the type of soil (Alvarez Citation2005), which affects the flux of CO2 into the atmosphere.
Soils in tropical ecosystems emit far more N2O than soils in other terrestrial ecosystems (Sanhueza et al. Citation1990). Because of the variability in soil types and soil moisture fluxes, some tropical soils emit more N2O than others. Puerto Rican vertisol has been reported to have an EF of approximately 4%, which is five times what is reported for unfertilized fields (Mosier and Delgado Citation1997).
Studies on tropical peat soils have established that emissions of N2O are related to both season and land use changes (Hadi et al. Citation2000; Inubushi et al. Citation2003). However, studies that compare the effect of soil type with N fertilizer, in relation to N2O and CO2 emission rates, are still limited. Coated fertilizer is one of fertilizer forms that has been reported to reduce N2O emission rate by effectively controlling the release of NH4+, which caused a prolonged production period of NO3– in Japanese Andosol (Hou et al. Citation2000; Amkha et al. Citation2009). In imperfectly drained Gleysol, N release from coated fertilizer matches with plant demand and N use efficiency increase, and the resulting low NO3– concentration would be expected to limit denitrification, providing an explanation for the low N2O fluxes (Akiyama et al. Citation2009). Coated fertilizer releases an adequate amount of N to meet the crop’s N requirement at various growth stages and enhance the N uptake by deep-side placement in clayey and sandy paddy soil (Acquaye and Inubushi Citation2004).
In this study, over a period of more than a year, we evaluated the emissions of the greenhouse gases N2O and CO2 from oil palm plantation fields in Indonesia and Malaysia, across three types of soil (sandy, sandy loam and peat soil) in response to treatments of N fertilizer application.
MATERIALS AND METHODS
Site descriptions and treatments
Study sites were located in oil palm plantation areas on tropical land, with one site in Indonesia and two sites in Malaysia (). The first site was located in Tunggal Plantation, Riau Province, Indonesia (S00°20.731’, E102°17.617’) on sandy loam soil classified as Ultisols [according to the United States Department of Agriculture (USDA) Soil Taxonomy]. The Tunggal Plantation site has a sloping topography with an annual rainfall of 1387 mm. The second site was located in Simunjan Plantation, Sarawak, Malaysia (N01°03.958’, E110°51.798’) on sandy soil, which was also classified as Ultisols. The Simunjan Plantation site is characterized by sloping topography with an annual rainfall of 4095 mm. The third site was located in Tatau Plantation, Sarawak, Malaysia (N02°57.924’, E112°45.851’) on peat soil, classified as Histosols. The Tatau Plantation site is characterized with a flat topography, located along the coast, with an annual rainfall of 2225 mm.
Figure 1 Map of study sites in Indonesia and Malaysia.
Three replications of the following four experimental treatments were conducted:
Treatment B: no nitrogen fertilizer and no tillage.
Treatment M: coated fertilizer in granular form was applied by the deep placement method: namely, after digging soil to 0–15 cm depth at four different spots, approximately 140 cm away from palm trees, fertilizer was incorporated and covered with soil.
Treatment C: conventional fertilizer (non-coated) surface application on four spots approximately 140 cm away from palm trees, with no tillage.
Treatment B2: no nitrogen fertilizer, with tillage only in the soil (0–15 cm) in a similar way as in treatment M.
Except for B and B2 treatments, the annual rates (kg N ha−1) of application for the conventional fertilizer were 151 as NPK (Nitrogen-Phosphorous-Postassium) (16-4-25), 107 in the first year and 121 in the second year as NK1 (1:1 mixture of ammonium sulphate and MOP (Muriate of Potash)), and 69 as urea in Tunggal, Simunjan and Tatau, respectively. The rate of conventional fertilizer application followed each plantation’s guidelines. It was considered that the coated fertilizers are more efficient due to a lower loss rate of N (Shoji and Kanno Citation1994). Hence, the rates of application for the coated fertilizer were about half the rate of the conventional fertilizers, namely 76, 62 and 46 kg N ha−1 in Tunggal, Simunjan and Tatau, respectively. As indicated in a–c, solid arrows and dashed arrows indicate conventional and coated fertilization times, respectively. In Tunggal, fertilizers were applied once each in the wet season and dry season for both conventional and coated fertilizer. In Simunjan, fertilizers were applied twice for conventional fertilizer and once for coated fertilizer in the first wet season, once for both conventional and coated fertilizer in the dry season, and once for both conventional and coated fertilizer in the second wet season. In Tatau, fertilizers were applied twice for conventional fertilizer and once for coated fertilizer in the first wet season, once for both conventional and coated fertilizer in the dry season, and once for coated fertilizer in the second wet season.
Figure 2a Precipitation, soil moisture tension, soil temperature, nitrous oxide (N2O) flux and carbon dioxide (CO2) flux in Tunggal sandy loam soil. Vertical bars indicate ± standard deviation. Treatment B: no nitrogen (N) fertilizer and no tillage; C: conventional fertilizer; B2: no N fertilizer with tillage; M: coated fertilizer. Solid arrows and dashed arrows indicate conventional and coated fertilization timing, respectively. Vertical dashed lines indicate transition period for dry and wet seasons.
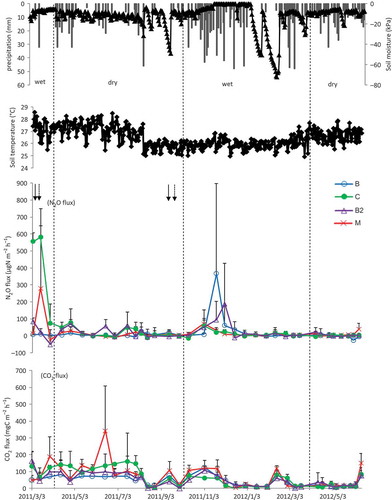
Figure 2b Precipitation, soil moisture tension, soil temperature, N2O flux, and CO2 flux, in Simunjan sandy soil. See details for other remarks in .
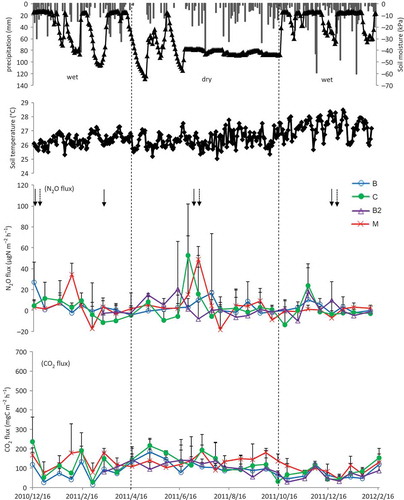
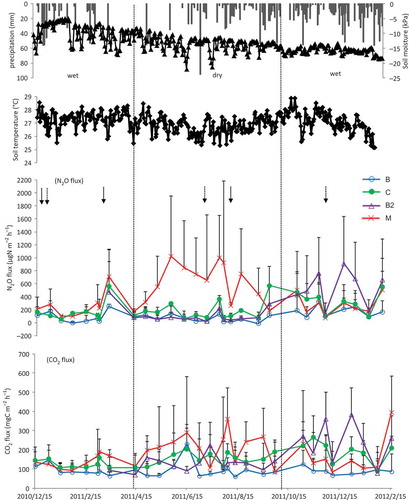
Figure 2c Precipitation, soil moisture tension, soil temperature, N2O flux, and CO2 flux, in Tatau peat soil. See details for other remarks in .
Physicochemical analysis of the soil samples
Both undisturbed soil cores and composite soil samples were collected from the three replications from the 0–10 cm soil depth. The soil samples were analyzed for their physical and chemical properties. Prior to analysis, the soil samples were maintained at 4°C. The undisturbed soil cores were measured for soil volume using a three-phase meter (DIK-1130, Daiki Rika Kogyo Co. Ltd). The core samples were weighed and oven dried at 105°C for 48 h. After drying, the core samples were reweighed to calculate soil moisture content, bulk density (BD) and water-filled pore space (WFPS). Soil particle size distribution was determined by the Bouyoucos hydrometer method (Kroetsch and Wang Citation2008). Soil samples were air dried and passed through a 2-mm sieve, and the sieved soil was extracted with potassium chloride (KCl) solution at a 1:2.5 soil-to-solution ratio. The resulting soil suspension was shaken for approximately 1 h before filtration through filter paper. The soil pH was measured with a glass electrode pH meter (D-52, Horiba Co., Ltd). Total carbon and nitrogen contents were determined using a Carbon and Nitrogen Analyzer (CN corder; MT-700 Yanaco Analytical Industry Co., Ltd). The inorganic N contents of NH4+ and NO3– were determined by sieving fresh soil through a 2-mm sieve, extracting it in 1 M KCl, and using the nitroprusside method (Anderson and Ingram Citation1989) and hydrazine reduction method (Hayashi et al. Citation1997), respectively.
Soil moisture was measured and recorded using a Watermark and Sensor TR-0306 (equipped with a stainless steel protective tube) connected to a Thermo Recorder (TR-71Ui; T&D Corporation). Soil temperature was measured and recorded using a thermo sensor (203AT; T&D Corporation) with a thermo recorder at 10 cm soil depth. Every 3 months, the recorded data were downloaded to a computer. The precipitation data were collected by oil palm plantation staff members using rain gauges located within the oil palm plantation areas.
Measurement of N2O and CO2 fluxes
Measurement of N2O and CO2 fluxes was conducted at 2-week intervals over a period of 15 months from December 2010 to February 2012 at Simunjan and Tatau Plantations and over a period of 16 months from March 2011 to June 2012 at Tunggal Plantation. Gas sampling was consistently conducted at mid-morning. N2O and CO2 fluxes were determined by placing a 20.8 cm diameter and 14.2 cm height PVC pipe chamber driven to a depth of 5 cm into the soil at approximately 1 m distance from the palm tree’s trunk (Handayani et al. Citation2010) in the area under the shade of the palm tree canopy. The chamber was replicated at three different places at least 10 m apart at each treatment site, and included the fertilized spot. Gas samples were taken from each chamber, after stabilizing the chamber for 5 min, using a 30-mL gas syringe with tubes connecting to the chamber. Gas samples were collected at 0-, 10- and 20-min intervals and were injected into glass vials that had been evacuated and closed tightly with a butyl rubber seals. The filled vials were transported to the laboratory, where N2O and CO2 fluxes were measured by a gas chromatograph (GC-14B, Shimadzu, Japan) equipped with an electron capture detector (ECD) and thermal detector (TCD), respectively. The emission factor (EF) was calculated using cumulative N2O fluxes to determine the percentage of N2O-N emitted for each fertilizer treatment (Dobbie and Smith Citation2003; Jumadi et al. Citation2008). The emission factor (EF) was calculated using the following formula:
Statistical analysis
The significance of the cumulative N2O and CO2 fluxes for each treatment and study site were analysed using a two-way analysis of variance (ANOVA) test. Means of N2O and CO2 fluxes for each treatment and study site during wet and dry seasons were analysed using a three-way ANOVA test. Correlations between gas emission and soil physicochemical properties among the study sites were analysed using Pearson’s correlation. Statistical considerations were based on p < 0.05 and p < 0.001 significance levels. Statistical analyses were conducted using IBM SPSS Statistics 21.
RESULTS
Physicochemical soil properties of study sites
The physicochemical properties of the three soil types were varied (). In Tunggal and Simunjan, both were mineral soils with different particle size distributions. Sand content was higher in Simunjan than in Tunggal, while clay and silt contents were higher in Tunggal than in Simunjan. Other soil parameters such as NO3–, NH4+, total N, total carbon and WFPS were higher in Tatau peat soil than the other two mineral soils. Soil pH and BD were lower in the Tatau peat soil than in the other two mineral soils.
Table 1 Descriptions and physicochemical characteristics of soils at the oil palm plantation study sites
Soil N2O emission and emission factors
N2O fluxes for Tunggal, Simunjan and Tatau are shown in , b and c respectively. In Tunggal sandy loam soil, it was observed that there were high N2O fluxes (279–581 μg N m−2 h−1) during the wet season, especially after the first fertilization, and high precipitation, which gradually declined thereafter. The peak of N2O fluxes appeared again after a heavy precipitation in the second wet season (). In the Simunjan sandy soil, N2O fluxes were lower (up to 52.5 μg N m−2 h−1) than in the Tunggal sandy loam soil, but peaks were observed after heavy rains not only in the wet season, but also in the dry season (). N2O fluxes in the Tatau peat soil were higher and more variable (up to 1022 μg N m−2 h−1) than the fluxes in the two mineral soils during the study period, and, only in treatment M, N2O fluxes were highest in the dry season, but the N2O fluxes in the other treatments were higher in the wet seasons ().
During the study period, N2O fluxes varied across all study sites and treatments (). Across all the study sites, the mean of N2O fluxes in the Simunjan sandy soil was lowest, ranging from 0.80 to 3.81 and 1.63 to 5.34 μg N m−2 h−1 in the wet and dry seasons, respectively. The mean of N2O fluxes in the Tunggal sandy loam soil ranged from 27.4 to 89.7 and 6.27 to 19.1 μg N m−2 h−1 in the wet and dry seasons, respectively. The mean of N2O fluxes was highest in the Tatau peat soil among the three soils, ranging from 131 to 523 and 66.1 to 606 μg N m−2 h−1 in the wet and dry seasons, respectively. Coated fertilizer reduced N2O emission by 31 and 48% in wet and dry seasons, respectively, compared to conventional fertilizer, and almost equalled the unfertilized treatment only in the Tunggal soil, but increased in Simunjan and Tatau soils in dry season. Three-way ANOVA for each treatment and study site during wet and dry seasons determined that there were statistically significant differences in means of N2O fluxes among the study sites (p = 0.000) and combination factor of sites, treatments and seasons (p = 0.020) ().
Table 2 Nitrous oxide (N2O) fluxes for the three study sites during wet and dry seasons
The cumulative N2O fluxes are summarized in . Cumulative N2O fluxes ranged from 0.59 to 4.09, 0.11 to 0.42 and 11.1 to 42.7 kg N ha−1 period−1, in Tunggal sandy loam soil, Simujan sandy soil and Tatau peat soil, respectively. Results indicated the highest cumulative N2O fluxes in the Tatau peat soil and the lowest cumulative N2O fluxes in Simunjan sandy soil. Two-way ANOVA analysis determined that there were statistically significant differences in cumulative N2O fluxes among the study sites (p = 0.000), though no significant difference was found in the treatments within each study site (p = 0.125) ().
Table 3 Cumulative nitrous oxide (N2O) fluxes for the three study sites
Among the three study sites, the N2O emission factors were significantly affected by sites (p = 0.000), fertilizer treatment, i.e., use of conventional and coated fertilizer (p = 0.038), and interaction of the sites and fertilizer treatments (p = 0.010) ().
Table 4 Emission factors (EF) calculated for the three study sites
EF for the conventional and coated fertilizer applications showed significantly positive correlation with the soil parameters such as NO3–, NH4+, total N, total carbon and WFPS, and has a significantly negative correlation with the soil pH and BD ().
Table 5 Pearson correlation of nitrous oxide (N2O) emission factors (EF) between the conventional fertilizer and the coated fertilizer among soil parameters for the three study sites (n = 9)
Soil CO2 emission
CO2 fluxes are presented in , b and c for Tunggal, Simunjan and Tatau, respectively. During the study period, CO2 fluxes varied across all the study sites and treatments (). The mean of the CO2 fluxes in the Tunggal sandy loam soil ranged from 45.5 to 56.8 and 56.4 to 96.5 mg carbon m−2 h−1 in wet and dry seasons, respectively. The mean of the CO2 fluxes in the Simunjan sandy soil ranged from 71.1 to 114 and 104 to 134 mg carbon m−2 h−1 in wet and dry seasons, respectively. The mean of the CO2 fluxes was found to be highest in the Tatau peat soil, ranging from 89.8 to 223 and 92.7 to 208 mg carbon m−2 h−1 in wet and dry seasons, respectively. Three-way ANOVA for each treatment and study site during wet and dry seasons determined that there were statistically significant differences in means of CO2 fluxes by effect of study sites only (p = 0.000) (). In Tatau peat soil, as the soil temperature decreased, the soil CO2 fluxes tended to increase. However, these CO2 fluxes included both soil and root respiration, but these values might be underestimated due to relatively long closure time, as 20 minutes.
Table 6 Carbon dioxide (CO2) fluxes for the three study sites during the wet and dry seasons
Cumulative CO2 fluxes ranged from 5302 to 7971, 7638 to 11431 and 8797 to 16949 kg carbon ha−1 period−1, in Tunggal sandy loam, Simunjan sandy soil and Tatau peat, respectively (). Among the three study sites, the cumulative CO2 fluxes were highest in the Tatau peat soil and lowest in the Tunggal sandy loam soil. For cumulative CO2 fluxes, there was a statistically significant difference among the study sites (p = 0.000) but no significant difference in the treatments at each study site (p = 0.064).
Table 7 Cumulative carbon dioxide (CO2) fluxes for the three study sites
DISCUSSION
N2O fluxes and EF correlated with soil and fertilizer types
In Tunggal sandy loam soil, the highest N2O fluxes were measured in the wet season, March 2011 (). High peaks of N2O flux were observed 1 week after the first fertilizer application in both conventional fertilizer and coated fertilizer treatments, and also during high precipitation and soil moisture content at the site. As reported by Clayton et al. (Citation1994) and Webb et al. (Citation2004), increased N2O fluxes after N fertilization are not unusual and often show a marked response to precipitation events. The results also showed that N2O fluxes increased after N fertilization, reached a peak, then decreased rapidly before levelling off after approximately 1 to 2 weeks. Subsequently, N2O fluxes gradually decreased before sharply increasing again in December 2011 with both high precipitation and soil moisture.
In Simunjan sandy soil, high N2O fluxes were shown twice in the wet season and one time in the dry season when precipitation was high (). Increased fluxes during these periods coincided with high precipitation events for 2–3 weeks in duration. Similar results were reported in Minnesota loamy sand in which irrigated potato fields fertilized with polymer-coated urea exhibiting increased fluxes in response to high precipitation events (Hyatt et al. Citation2010). Changes in the soil moisture content after the precipitation event presumably influenced soil porosity, consequently increasing the probability of denitrification and diffusion of N2O out of the soil (Inubushi et al. Citation1996). During the study period, there were negative N2O emissions that may be explained by a decrease in gas diffusivity, leading to increased microbial consumption of N2O and denitrification before emission (Arah et al. Citation1991). Although production rates of N2O are usually larger than consumption rates, stressed soils that are usually considered as net sources of atmospheric N2O can temporarily become a sink (Minami Citation1997; Inubushi et al. Citation2003).
In Tatau peat soil, fluxes of N2O were higher than those in sandy loam and sandy soils. Although the pattern of N2O fluxes varied during the study period, the coated fertilizer application remained high throughout the study period (). N2O emissions were particularly high when fertilizer was applied to wet peat soil. N2O emissions from fertilized tropical agricultural peat soils are high, sometimes even extremely high, especially under humid climate and organic carbon-rich soil conditions (Williams et al. Citation1999). The variation in N2O fluxes is generally relative to the rates of denitrification affected by moisture content and the quantities of NO3–, NH4+ and carbon substrates in soil (Clayton et al. Citation1994; Couwenberg Citation2009).
In our study, patterns of N2O emissions were affected by type of soil, precipitation and soil moisture. Freshly wetted soils often have high carbon and N availability that is linked to high denitrification rates (Peterjohn and Schlesinger Citation1991). The occurrence of rainfall events stimulates soil N mineralization (Jantalia et al. Citation2008).
Tropical peat land could be a potential source of GHG emissions because it contains large amounts of soil carbon and N (Ismunadji and Soepardi Citation1984; Melling et al. Citation2005). However, management practices via physical compaction could increase BD, resulting in higher capillary rise and high moisture content that could decrease the soil CO2 flux. High N2O fluxes in peat soils are further correlated significantly with denitrification activity where a high content of NO3–, NH4+and WFPS are present in the soil. Large amounts of NH4+ and NO3– accumulate when organic matter in peat soil undergoes either aerobic or anaerobic decomposition (Ismunadji and Soepardi Citation1984). This could pose a great threat to the environment by emitting N2O.
Soil pH has a marked effect on the products of denitrification. Denitrification rates would be slower under the strong acid conditions in Tatau peat than under the slightly less acid conditions in the other two soils. This is commonly attributed to the sensitivity of N2O reductase to proton activity, and it is also likely that all denitrifying enzymes are susceptible at low soil pH and produce N2O from other intermediate products (Nägele and Conrad Citation1990).
In our study, coated fertilizer reduced N2O emission in Tunggal sandy loam soil. However, coated fertilizer exhibited higher N2O emission compared to conventional fertilizer in Simunjan sandy soil and Tatau peat. Delgado and Mosier (Citation1996) observed similar results in which N2O emissions from polyolefin-coated urea remained higher than non-coated urea through the growing season in a barley (Hordeum vulgare L.) field on sandy soil. Coated N fertilizer exhibits an intermediate rate of emissions that continue for a relatively long period. The effectiveness of coated fertilizers for N2O emission mitigation depends on increases in the nitrification-derived N2O emissions after fertilizer application and on N substrate availability in Andosol and Fluvisol (Uchida et al. Citation2013). Application of conventional fertilizer often causes a sharp peak immediately after applying the fertilizer, while coated urea shows a broader peak (Akiyama et al. Citation2000). Additional results show that the effectiveness of coated fertilizer for N2O mitigation was dependent on soil and land-use type, where coated fertilizer was significantly effective for imperfectly drained Gleysol grassland but not effective for well-drained Andosol upland fields (Akiyama et al. Citation2009).
The emission factors are highest for Tatau peat soil compared with Tunggal sandy loam and Simunjan sandy soil. These results are similar to the reported values in the Netherlands which indicated that the EF of synthetic fertilizer with nitrate was highest in peat soil (3.68%), followed by clay soil (1.38%) and sandy soil (0.57%) (Kuikman et al. Citation2006). In well-drained Alluvial soil in Indonesia, the EF of urea and the controlled release factor (CRF-LP30) were 1.61% and 1.42%, respectively (Jumadi et al. Citation2008). Therefore, these EF values are mostly dependent on management practices, fertilizer types, climate and soil types.
CO2 fluxes correlated with soil types
Soil CO2 flux is generally positively correlated with soil temperature (Lloyd and Taylor Citation1994; Davidson et al. Citation1998; Nagano et al. Citation2012) and the rates of soil CO2 flux vary by ecosystem (Raich and Schlesinger Citation1992; Melling et al. Citation2005). In our study, the soil CO2 fluxes were not directly influenced by soil temperature. In the Tatau peat soil, as the soil temperature decreased, the soil CO2 fluxes tended to increase. This may be confounded with the increase in oil palm growth, where higher root biomass would result in higher root respiration. The root biomass could have also stimulated the soil microbial activity, which enhanced the soil CO2 fluxes. In the other two mineral soils, the CO2 fluxes tended to be higher in the Simunjan sandy soil than in the Tunggal sandy loam soil. In the Tatau peat soil, CO2 fluxes were highest among three soils examined which may be due to higher soil carbon content. The relationship between quantity of soil carbon, soil CO2 flux and litter respiration remains a serious concern (Gu et al. Citation2004). The rate of CO2 transmission from soils to the atmosphere is determined by microbial respiration, root respiration and bulk soil respiration and is predominately regulated by soil microorganisms found within the soil organic matter (Raich and Schlesinger Citation1992).
CONCLUSION
The effect of soil types on N2O and CO2 fluxes in the studied tropical oil palm plantation was highly significant, but no consistent tendency was observed using different N fertilizers. N2O and CO2 fluxes showed high variation with soil types, N fertilizer and seasons. N2O fluxes were highest in the Tatau peat soil, followed by the Tunggal sandy loam soil and the Simunjan sandy soil, respectively. Applications of fertilizer have to be considered with the suitability of the soil type to mitigate the gas emission to the atmosphere. Further detailed study is needed to assess a more accurate interpretation of the mechanism of N2O and CO2 fluxes in oil palm plantations.
ACKNOWLEDGMENTS
We would like to thank the staff of the oil palm plantations and Tropical Peat Research Laboratory of Sarawak, Malaysia, for their assistance in the field. This study was funded by the Ministry of Economy, Trade and Industry (METI), Japan.
Related Research Data
REFERENCES
- Acquaye S, Inubushi K 2004: Comparative effects of app1ication of coated and non-coated urea in clayey and sandy paddy soi1 microcosms examined by the 15N tracer technique. Soil Sci. Plant Nutr., 50, 205–213. doi:10.1080/00380768.2004.10408469
- Akiyama H, Tsuruta H, Watanabe T 2000: N2O and NO emissions from soils after the application of different chemical fertilizers. Chemos. Global Change Sci., 2, 313–320. doi:10.1016/S1465-9972(00)00010-6
- Akiyama H, Yan X, Yagi K 2009: Evaluation of effectiveness of enhanced-efficiency fertilizers as mitigation options for N2O and NO emissions from agricultural soils: meta-analysis. Glob. Chang. Biol., 16, 1837–1846. doi:10.1111/j.1365-2486.2009.02031.x
- Alvarez R 2005: A review of nitrogen fertilizer and conservation tillage effects on soil organic carbon storage. Soil Use Manage., 21, 38–52. doi:10.1079/SUM2005291
- Amkha S, Sakamoto A, Tachibana M, Inubushi K dec2009: Controlled mineralizing acetaldehyde condensation urea (CM-CDU) fertilizer can reduce nitrate leaching and N2O emission from an Andisol with continuous cropped komatsuna (Brassica napaL.). Soil Sci. Plant Nutr., 55(6), 772–777. doi:10.1111/j.1747-0765.2009.00418.x
- Anderson JM, Ingram JSI 1989: Colorimetric determination of ammonium. In Tropical Soil Biology and Fertility, Ed. Anderson JM, Ingram JSI, pp. 42–43. ISSS, CAB International, Wallingford.
- Arah J, Smith KA, Crighton I, Li HS 1991: Nitrous oxide production and denitrification in Scottish arable soils. J. Soil Sci., 42, 351–367. doi:10.1111/j.1365-2389.1991.tb00414.x
- Bouwman AF 1990: Exchange of greenhouse gases between terrestrial ecosystems and the atmosphere. In Soils and the Greenhouse Effect, Ed. Bouwman AF, pp. 61–127. Wiley, Chichester.
- Bouwman A, Van der Hoek KW, Olivier, JGJ 1995: Uncertainties in the global source distribution of nitrous oxide. J. Geophys. Res., 100, 2785–2800. doi:10.1029/94JD02946
- Clayton H, Arah JRM, Smith KA 1994: Measurement of nitrous oxide emission from fertilized grassland using closed chambers. J. Geophys. Res., 99, 599–607.
- Corre MD, van Kessel KC, Pennock DJ, Solohub MP 1995: Ambient nitrous oxide emissions from different landform complexes as affected by simulated rain‐fall1. Commun. Soil Sci. Plant Anal., 26, 2279–2293. doi:10.1080/00103629509369446
- Couwenberg J 2009: Emission factors for managed peat soils (organic soils, histosols) an analysis of IPCC default values. Greifswald University Wetlands International, Ede, 2009, www.wetlands.org, UN-FCCC meeting, Bonn.
- Davidson EA, Belk E, Boone RD 1998: Soil water content and temperature as independent or confounded factors controlling soil respiration in a temperate mixed hardwood forest. Glob. Chang. Biol., 4, 217–227. doi:10.1046/j.1365-2486.1998.00128.x
- Delgado JH, Mosier AR 1996: Mitigation alternatives to decrease nitrous oxides emissions and urea-nitrogen loss and their effect on methane flux. J. Environ. Qual., 25, 1105–1111. doi:10.2134/jeq1996.00472425002500050025x
- Dewi S, Khasanah N, Rahayu S, Ekadinata A, Van NM 2009: Carbon Footprint of Indonesian Palm Oil Production: a Pilot Study. Bogor, Indonesia. World Agroforestry Centre - ICRAF, SEA Regional Office.
- Dobbie KE, Smith KA 2003: Impact of different form of N fertilizer on N2O emissions from intensive grassland. Nutr. Cycl. Agroecosys., 67, 37–46. doi:10.1023/A:1025119512447
- Firestone MK, Davidson EA 1989: Microbiological basis of NO and N2O production and consumption in soil. In Report for the Dahlem Workshop on Exchange of the Trace Gases between Terrestrial Ecosystems and the Atmosphere, Eds. Andreae MO, Schimel DS, pp. 7–22. John Wiley and Sons Publisher, Berlin.
- Green CJ, Blackmer AM, Horton R 1995: Nitrogen effects on conservation of carbon during corn residue decomposition in soil. Soil Sci. Soc. Am. J., 59, 453–459. doi:10.2136/sssaj1995.03615995005900020026x
- Gu L, Post WM, King AW 2004: Fast labile carbon turnover obscures sensitivity of heterotrophic respiration from soil to temperature: a model analysis. Global Biogeochem. Cy., 18, GB1022. doi:10.1029/2003GB002119
- Hadi A, Inubushi K, Purnomo E, Razie F, Yamakawa K, Tsuruta H 2000: Effect of land-use changes on nitrous oxide (N2O) emission from tropical peatlands. Chemos. Global Change Sci., 2, 347–358. doi:10.1016/S1465-9972(00)00030-1
- Handayani EP, Noordwijk MV, Idris K, Sabiham S, Djiniwati S 2010: The effect of various water table depths on CO2 Emission at Oil Palm Plantation on West Aceh Peat. J. Trop. Soils., 15, 255–260.
- Hayashi A, Sakamoto K, Yoshida T 1997: A rapid method for determination of nitrate in soil by hydrazine reduction procedure. Jpn. J. Soil Sci. Plant Nutr., 68, 322–326. (In Japanese).
- Hou A, Akiyama H, Nakajima Y, Sudo S, Tsuruta H 2000: Effects of urea form and soil moisture on N2O and NO emissions from Japanese Andosols. Chemos. Global Change Sci., 2, 321–327. doi:10.1016/S1465-9972(00)00025-8
- Hyatt CR, Venterea RN, Rosen CJ, Nearney MM, Wilson ML, Dolan MS 2010: Polymer-coated urea maintains potato yields and reduces nitrous oxide emissions in a minnesota loamy sand. Soil Sci. Soc. Am. J., 74, 419–428. doi:10.2136/sssaj2009.0126
- Inubushi K, Furukawa Y, Hadi A, Purnomo E, Tsuruta H 2003: Seasonal changes of CO2, CH4 and N2O fluxes in relation to land-use change in tropical peatlands located in coastal area of South Kalimantan. Chemosphere, 52, 603–608. doi:10.1016/S0045-6535(03)00242-X
- Inubushi K, Naganuma H, Kitahara S 1996: Contribution of denitrification and autotrophic and heterotrophic nitrification to nitrous oxide production in andosol soils. Biol. Fertil. Soil., 23, 292–298. doi:10.1007/BF00335957
- IPCC (Intergovernmental Panel on Climate Change) 2007: Climate Change 2007: Mitigation of Climate Change – Contribution of Working Group III to the Fourth Assesment Report of the Intergovernmental Panel on Climate Change. Cambridge University Press, Cambridge, UK and New York, NY.
- IPCC 2006: In IPCC Guidelines for National Greenhouse Gas Inventories, Prepared by the National Greenhouse Gas Inventories Programme, Eds. Eggleston HS, Buendia L, Miwa K, Ngara T, Tanabe K. IGES, Japan.
- Ismunadji and Soepardi G 1984: Peat soil: problems and crop production. In Organic Matter and Rice, Ed. IRRI, pp. 489–502, Los Banos, Philippines.
- Jantalia CP, Dos Santos HP, Urquiaga S, Boddey RM, Alves BJR 2008: Fluxes of nitrous oxide from soil under different crop rotations and tillage systems in the South of Brazil. Nutr. Cycl. Agroecosyst., 82, 161–173. doi:10.1007/s10705-008-9178-y
- Jumadi O, Hala Y, Muis A, Ali A, Palennari M, Yagi K, Inubushi K 2008: Influences of chemical fertilizers and a nitrification inhibitor on greenhouse gas fluxes in a corn (Zea mays L.) field in Indonesia. Microbes Environ., 23, 29–34. doi:10.1264/jsme2.23.29
- Kroetsch D, Wang C 2008: Particle size distribution. In Soil Sampling and Methods of Analysis, Ed. Cartes MR, Gregorich EG, pp. 713–725. CRC Press, Boca Raton.
- Kuikman PJ, Van der Hoek KW, Smith A, Zwart K 2006: Update of emission factors for nitrous oxide from agriculture soils on the basis of measurements in the Netherlands. Alterra Report 1217. ISSN 1566–7197.
- Lal R 2004: Soil carbon sequestration impacts on global climate change and food security. Science, 304, 1623–1627. doi:10.1126/science.1097396
- Lloyd J, Taylor JA 1994: On the temperature dependence of soil respiration. Funct. Ecol., 8, 315–323. doi:10.2307/2389824
- MacKenzie AF, Fan MX, Cadrin F 1998: Nitrous oxide emission in three years as affected by tillage, corn-soybean-alfalfa rotations and nitrogen fertilization. J. Environ. Qual., 27, 698–703. doi:10.2134/jeq1998.00472425002700030029x
- Melling L, Hatano R, Goh KJ 2005: Soil CO2 flux from three ecosystems in tropical peatland of Sarawak, Malaysia. Tellus, 57B, 1–11.
- Minami K 1997: Atmospheric methane and nitrous oxide: sources, sinks and strategies for reducing agricultural emissions. Nutr. Cycl. Agroecosys., 49, 203–211. doi:10.1023/A:1009730618454
- Mosier AR, Delgado JA 1997: Methane and nitrous oxide fluxes in grasslands in western Puerto Rico. Chemosphere, 35, 2059–2082. doi:10.1016/S0045-6535(97)00231-2
- Murdiyarso D, Van Noordwijk M, Wasrin U, Tomich T, Gillison A 2002: Environmental benefits and sustainable land use options in the Jambi transect, Sumatra, Indonesia. J. Veg. Sci., 13, 429–438. doi:10.1111/j.1654-1103.2002.tb02067.x
- Nägele W, Conrad R 1990: Influence of soil- pH on the nitrate-reducing microbial populations and their potential to reduce nitrate to NO and N2O. FEMS Microbiol. Lett., 74, 49–57. doi:10.1111/j.1574-6968.1990.tb04051.x
- Nagano H, Kato S, Ohkubo S, Inubushi K 2012: Emissions of carbon dioxide, methane, and nitrous oxide from short- and long-term organic farming Andosols in central Japan. Soil Sci. Plant Nutr., 58, 793–801. doi:10.1080/00380768.2012.739550
- Peterjohn WT, Schlesinger WH 1991: Factors controlling denitrification in a Chihuahuan Desert ecosystem. Soil Sci. Soc. Am. J., 55, 1694–1701. doi:10.2136/sssaj1991.03615995005500060032x
- Raich JW, Schlesinger WH 1992: The global carbon dioxide flux in soil respiration and its relationship to vegetation and climate. Tellus, 44B, 81–99. doi:10.1034/j.1600-0889.1992.t01-1-00001.x
- Rogner HH, Zhou D, Bradley R, Crabbe P, Edenhofer O, Hare B, Kuijpers L, Yamaguchi M 2007: Introduction. In Climate Change 2007: Mitigation. Contribution of Working Group III to the Fourth Assessment Report of the Intergovernmental Panel on Climate Change, Eds. Metz B, Davidson OR, Bosch PR, Dave R, Meyer LA, Cambridge University Press, Cambridge, UK.
- Sanhueza E, Hao WM., Scharffe MD, Donoso L, Crutzen PJ 1990: N2O and NO emissions from soils of the Northern part of The Guayana shield, Venezuela. J. Geophysical. Res., 95, 22481–22488. doi:10.1029/JD095iD13p22481
- Shoji S, Kanno H 1994: Use of polyolefin-coated fertilizers for increasing fertilizer efficiency and reducing nitrate leaching and nitrous oxide emissions. Fertil. Res., 39, 147–152. doi:10.1007/BF00750913
- Syväsalo E, Regina K, Pihlatie M, Esala M 2004: Emissions of nitrous oxide from boreal agricultural clay and loamy sand soils. Nutr. Cycl. Agroecosyst., 69, 155–165. doi:10.1023/B:FRES.0000029675.24465.fc
- Uchida Y, von Rein I., Akiyama H, Yagi K 2013: Contribution of nitrification and denitrification to nitrous oxide emissions in Andosol and from Fluvisol after coated urea application. Soil Sci. Plant Nutr., 59, 46–55. doi:10.1080/00380768.2012.708646
- Webb J, Ellis S, Harrison R, Thorman R 2004: Measurement of N fluxes and soil N in two arable soils in the UK. Plant Soil., 260, 253–282. doi:10.1023/B:PLSO.0000030185.29220.79
- Williams DL, Ineson P, Coward PA 1999: Temporal variations in nitrous oxide fluxes from urine-affected grassland. Soil Biol. Biochem., 31, 779–788. doi:10.1016/S0038-0717(98)00186-2