
Abstract
Investigating spatio-temporal trends in soil vulnerability to degradation based on the diachronic analysis of selected biophysical and socioeconomic drivers is a key issue for the identification of prone areas. The working hypothesis of the present study is that a given territorial system may undergo different (and sometimes contrasting) patterns of soil vulnerability (improvement, worsening or stability) in the long term, thus creating (or amplifying) spatial heterogeneity in land resource distribution. Areas classified as “critical” are regarded as soil vulnerability hotspots that require dedicated mitigation policies. The correct identification of “critical” areas to soil degradation is particularly important for the natural areas and, more generally, for the agro-forest systems preserved under various land protection regimes. Based on these premises, the objectives of this study are (i) to assess the spatial distribution of soil vulnerability in Italy over a long enough time interval (1990–2010), (ii) to provide an operational tool to identify soil degradation hotspots according to the observed vulnerability trend and, finally, (iii) to analyze hotspot spatial distribution in relation with natural protected areas and the Natura2000 network. The results of this study provide a useful tool for environmental monitoring and are discussed in the light of sustainable agro-forest management and preservation of natural areas.
1. INTRODUCTION
The United Nations Convention to Combat Desertification defines soil degradation as a process causing the decline of the biological and economic productivity of soils (Romm Citation2011). Soil degradation results either from the unsustainable use of land or from a combination of biophysical and socioeconomic processes (Detsis Citation2010). These include soil erosion, salinization, sealing and long-term loss of natural vegetation, among others (Montanarella Citation2007). Soil degradation (SD) can be thus regarded as an interactive process involving multiple factors, among which climate and land-use play a significant role (Geist and Lambin Citation2004). Particularly in the Mediterranean region, biophysical and socioeconomic drivers together impact ecologically fragile soil–landscape systems (Thornes Citation2004), and their interaction may become extremely complex through space and time, resulting in typical SD patterns (Costantini et al. Citation2009). Understanding spatio-temporal trends in soil vulnerability to degradation is therefore a key issue from both science and policy perspectives (Salvati and Bajocco Citation2011).
Due to the millenary interaction among nature and man, traditional agro-forest systems dominated the Mediterranean landscape in southern Europe, preserving plant and animal biodiversity, water and soil quality, aesthetic values and sustainable agricultural practices (Antrop Citation2005). Agro-forest systems, covering both internal, upland and mountainous areas and more accessible, flat areas, are widely diffused in Italy and extensively protected through the institution of national and regional parks (Capotorti et al. Citation2012). The core area of parks and natural reserves is frequently formed by high-diversity, mixed agro-forest landscapes (Basso et al. Citation2012). Although experiencing a higher human pressure and local-scale climate warming (Mancino et al. Citation2013), it was demonstrated that agro-forest systems, and especially those placed under environmental protection, may represent effective buffer zones positively contributing to the containment of soil degradation and desertification risk (e.g., Salvati et al. Citation2014).
The working hypothesis considered in the present study is that a given territorial system may undergo different (and sometimes contrasting) patterns of soil vulnerability to degradation in the long term (improvement, worsening or stability), thus amplifying the spatial heterogeneity in the distribution of land resources (Salvati et al. Citation2013). ‘Critical’ areas to SD are considered vulnerability hotspots and require specific mitigation measures (Imeson Citation2012). This concept is particularly relevant when dealing with natural areas, or, more generally, with agro-forest systems under various regimes of land protection (Oldfield et al. Citation2004; Ioja et al. Citation2010; Capotorti et al. Citation2012).
Based on these premises, the aims of the present study are (i) to define “hotspots” for soil vulnerability to degradation in the northern Mediterranean basin, (ii) to assess the spatial distribution of soil vulnerability hotspots in Italy (1990–2010) and, finally, (iii) to analyze soil vulnerability patterns in hotspots within protected areas of regional and national relevance and the Natura2000 reserve network. The proposed approach provides a useful tool supporting environmental monitoring and informing land conservation policies (Simeonakis et al. Citation2007). The methodology would allow us, on the one hand, to identify areas where SD impact is increasing and, on the other hand, to monitor the evolution of SD processes in relation to different land protection regimes (Sommer et al. Citation2011; Vogt et al. Citation2011).
2. STUDY AREA
Italy is a southern European country located on the northern side of the Mediterranean basin. The country surface area (301,330 km2) lies between latitudes 35 and 47°N and longitudes 6 and 19°E, being composed of 23% flat areas, 42% uplands and 35% mountainous land. The Italian borders and coastlines on the Adriatic, Ionian and Tyrrhenian Seas amount to around 7600 km including the islands. The Alps form most of its northern boundaries and the Apennine Mountains form the backbone of the peninsula. Thanks to the remarkable longitudinal extension and to the mostly mountainous conformation of the inner areas, different climate regimes can be found in Italy. In most of the inland northern and central regions, the climate ranges from humid sub-tropical to humid continental and oceanic; in particular, the climate regime in the Po Valley is mostly continental with harsh winters and hot summers. The coastal areas of Liguria, Tuscany, Latium and most of southern Italy generally match the Mediterranean climate stereotype. Conditions on peninsular coastal areas can be different from the interior’s higher grounds and valleys, particularly during winter when the higher altitudes tend to be cold and wet, and where it often snows. The coastal regions have mild winters and warm, dry summers. The average winter temperatures vary from 0°C on the Alps to 12°C in Sicily, while average summer temperatures range from 20 to over 30°C.
The geographical partition into three subdivisions (Northern, Central and Southern Italy), in turn formed by the 20 Italian administrative regions, reflects important socioeconomic disparities (). Northern Italy (Aosta Valley, Piedmont, Liguria, Lombardy, Trentino-Alto Adige, Veneto, Friuli-Venezia Giulia and Emilia Romagna) occupies the whole of Po Valley and is one of the most developed regions in Europe. Central Italy (Tuscany, Marche, Umbria, Latium), separated from Northern Italy by the Apennine Mountains, is a region polarized in urban areas (e.g., Rome, Florence) and traditional, rural landscapes based on a crop mosaic mixed with woodland, shrubland and pastures. Southern Italy (Campania, Abruzzo, Molise, Apulia, Basilicata, Calabria, Sicily and Sardinia) is one of the most economically disadvantaged regions in Europe. The spatial partitioning mentioned above is particularly meaningful in the assessment of soil vulnerability to degradation, since the administrative regions were designed by the Italian National Action Plan to Combat Desertification as the effective spatial unit to coordinate and implement policies against soil degradation (Salvati and Bajocco Citation2011).
Figure 1 Upper panel: map representing Italy and the boundaries of the 20 administrative regions (northern Italy: Va, Pi, Li, Lo, Tr, Ve, Fr, Em; central Italy: Tu, Ma, Um, La; southern Italy: Ab, Mo, Ca, Ap, Ba, Cal, Si, Sa). Lower panels: maps representing the distribution of the National Protected Areas (NPAs, left) and Natura2000 sites (right) in Italy.
3. MATERIALS AND METHODS
3.1. Assessing soil vulnerability to degradation
Severe forms of SD result from a combination of inadequate land management and a number of environmental factors including soil, climate and vegetation as the most relevant ones (Lavado Contador et al. Citation2009). To develop a diachronic soil vulnerability map, a total of 14 variables have been considered in the present study, according to the Environmentally Sensitive Area (ESA) framework referring to four themes: climate, soil, vegetation and human pressure (). The outcomes of the ESA model have been extensively validated on the ground (e.g., Kosmas et al. Citation1999). A regional assessment based on heterogeneous geographical datasets with different reliability, indicates the Environmentally Sensitive Area Index (ESAI), i.e., the composite index derived from the ESA methodology, is a reliable proxy for SD in the Mediterranean basin (Lavado Contador et al. Citation2009). Significant correlations have been identified between the ESAI and a number of SD indicators (Basso et al. Citation2000). Ferrara et al. (Citation2012) assessed the statistical stability of the ESAI, demonstrating that the index is not affected by spatial and temporal heterogeneity in the composing variables.
3.2. Elementary variables
The complete list of the ESA variables is reported in . Slope aspect, the long-term average annual rainfall rate and the long-term aridity index [defined as the ratio between rainfall and reference evapotranspiration calculated using the Hargreaves and Samani (Citation1985) approach based on computation of minimum, mean and maximum air temperature] have been used in the present study to classify land based on climate quality using information collected in the Agro-meteorological Database of the Italian Ministry of Agriculture. The database relates to gauging data collected daily from various meteorological and hydrological networks (Italian Ministry of Agriculture, National Hydrological Service, Italian Air Force and some minor networks), operating with nearly 3000 weather stations since 1951 and homogeneously covering the whole of Italy (Salvati and Bajocco Citation2011). Two time windows were selected (1961–1990 and 1981–2010) considering 30-year periods as stable enough to describe climatic conditions in the area at different points in time through the last 50 years (Salvati and Bajocco Citation2011).
Table 1 List of variables used in the Environmentally Sensitive Area (ESA) framework by theme, measurement unit and statistical source
Soil data were obtained from the soil quality map produced in the framework of the Desertification Information System for the Mediterranean (DISMED) project (Basso et al. Citation2000) and derived from the European Soil Database at 1 km2 pixel resolution (Joint Research Center, JRC). According to the ESA framework, soil texture, depth, slope and parent material have been selected as soil-related variables. Considering the examined time span, these variables are regarded to be static during the study period because they change slowly, if at all or, by their nature, are infrequently measured (Salvati and Bajocco Citation2011).
Changes in vegetation cover and their possible contribution to the degree of soil vulnerability to degradation were assessed through four variables (Lavado Contador et al. Citation2009): (i) fire risk, (ii) vegetation protection from soil erosion, (iii) vegetation drought resistance and (iv) plant cover. The four variables were determined by applying a standard weighting system that classifies each observed land-cover class according to the level of vulnerability to land degradation (see Salvati and Bajocco Citation2011 for the weight matrix). Scores range from 1 (the lowest contribution to land vulnerability to degradation) to 2 (the highest contribution to land vulnerability to degradation). Following the benchmarks introduced by Kosmas et al. (Citation1999), Basso et al. (Citation2000) and Lavado Contador et al. (Citation2009), the applied scoring system was based on the known relationship between each factor and the land degradation processes (Salvati et al. Citation2013). Primary land-cover data were derived from Corine Land Cover (CLC) maps produced by the Italian Institute of Environmental Research and Protection (Ispra) for 1990 and 2006 (Salvati and Bajocco Citation2011). The CLC program was developed by the European Environment Agency (EEA) using satellite imagery to provide pan-European, diachronic 1:100,000 land-cover maps with a 25-ha minimum mapping unit. The CLC nomenclature includes 44 land-cover classes grouped into a three-level hierarchy.
Finally, human pressure shaping SD vulnerability has been assessed as the combination of three variables (population density, demographic variation and land-use intensity). Population density was measured on a municipality scale in 1991 and 2011 on the basis of the National Censuses of Population and Households (Salvati et al. Citation2013). Annual population growth rate was measured at the same spatial scale during 1981–1991 and 2001–2011, using the same data source. Land-use intensity was estimated by applying a score system (ranging from 1 to 2 and derived from Salvati and Bajocco Citation2011) that classifies each of the observed classes according to the intensity of use and the potential level of vulnerability to SD. This indicator was obtained from elaboration on the CLC maps described above.
3.3. Vulnerability (partial) indicators
All variables were ranked according to a specific vulnerability score system based on the estimated degree of correlation with SD processes (Ferrara et al. Citation2012). The standard benchmarking of the score system introduced by Salvati and Bajocco (Citation2011) was adopted in the present study and supplemented with information taken from Kosmas et al. (Citation1999), Basso et al. (Citation2000), and Ferrara et al. (Citation2012). For each variable, scores range from 1 (the lowest contribution to land vulnerability to degradation) to 2 (the highest contribution to land vulnerability to degradation). Four partial indicators (climate quality – CQI, soil quality – SQI, vegetation quality – VQI and land management quality – MQI) have been derived from the geometric average of the scores attributed to each elementary variable measured in every spatial unit (Lavado Contador et al. Citation2009).
3.4. Developing a composite index of soil vulnerability
A composite index (ESAI) quantifying the degree of soil vulnerability to degradation has been finally calculated for each spatial unit and year as the geometric mean of the four partial indicators described above, obtaining a score ranging from 1 (the lowest vulnerability to soil degradation) to 2 (the highest vulnerability to soil degradation). The four indicators were weighted the same in the ESAI procedure (Kosmas et al. Citation1999). With reference to the most used ESA classification systems (Salvati and Bajocco Citation2011), three classes of soil vulnerability were identified: (i) < 1.225: non-affected or only potentially affected (NA); (ii) 1.225–1.375: fragile (F); (iii) > 1.375: critical (C). Geographic information system (GIS) layers for the different input variables were generated and subsequently rasterized, registered and referenced to an elementary spatial unit of 1 km2 resolution. Intermediate (for the partial quality indicators) and final (for the composite ESAI) maps were then derived from the input variable layers using the “raster calculator” tool provided by the ArcGis version 9.3 package (Salvati et al. Citation2013).
3.5. Land protection regime
Two different data sources were used in the present study to identify natural protected areas in Italy: the National Protected Areas (NPAs) archive and the Natura2000 sites (). The official list of NPAs in Italy is drawn up and periodically updated by the Italian Ministry for the Environment, Land and Sea (Directorate for the Protection of Nature), which covers all the officially recognized protected areas, either marine or terrestrial (Italian Ministry for the Environment, Land and Sea Citation2010). Natura2000 is an ecological network composed of Special Areas of Conservation (SACs) and sites designated under the Birds Directive 79/409/EEC (Special Protection Areas, SPAs) and the Habitat Directive 92/43/EEC (Sites of Community Importance, CISs) (Italian Ministry for the Environment, Land and Sea Citation2012). For each Natura2000 site, national authorities have submitted a standard data form that contains an extensive description of the site. The European Topic Centre for Biological Diversity (ETC-BD) is responsible for validating these data and creating a Europe-wide database. The European database of Natura2000 sites consists of data submitted by member states to the European Commission. These data are subjected to a periodic validation and updating process. The sites’ boundaries submitted by each member state are validated by the European Environment Agency (EEA) and linked to descriptive data. Spatial data are generalized to 1:100,000 and integrated into a database covering the whole of Europe.
Figure 2 A flowchart illustrating the Environmentally Sensitive Area (ESA) methodology. ESAI, Environmentally Sensitive Area Index.
3.6. Spatial analysis
A change detection layer (1990–2010) was created using the ESAI maps dated 1990 and 2010. The analysis was focused on the pixels where trends of improvement, worsening or stability in soil vulnerability occurred during the investigated period (20 years). This time period was considered enough long to capture relevant changes in both biophysical variables (e.g., climate regime) and socioeconomic factors (e.g., land-use change, population growth, urban sprawl). Each elementary spatial unit was therefore classified into five “hotspot” classes (a–e) according to one of the nine types of SD transitions based on the scheme provided in . The last two classes (d and e) formed by transitions 6–9 were considered “critical” hotspots due to their vulnerability status and trend over time. To derive the final hotspot map a 3 × 3 km median filter was applied to the native hotspot raster map in order to eliminate spurious pixels and to create more homogeneous boundaries for each hotspot class. The final hotspot map was then overlain with the boundaries of NPAs and Natura2000 sites (see section 3.5) to derive the surface area classified for each soil vulnerability hotspot class within and outside protected areas.
Table 2 Land classification based on hotspot analysis (for abbreviations, see paragraph 3.4)
4. RESULTS AND DISCUSSION
illustrates the average score and the coefficient of variation of each partial indicator (SQI, CQI, VQI, MQI) and of the composite index of soil vulnerability (ESAI) for the two studied years (1990, 2010), the three geographical divisions of Italy (Northern, Central and Southern regions) and the three land partitions (NPAs, Natura2000 sites and non-protected land). The ESAI showed a diverging pattern at the regional scale with increasing soil vulnerability over time in Northern Italy (1.5%) and Central Italy (1%) and decreasing soil vulnerability in Southern Italy (−0.4%). In Northern Italy, soil vulnerability grew in both protected and non-protected areas, while in Central Italy the highest growth rate was found in non-protected areas. In Southern Italy, the vulnerability level observed in protected areas (both NPAs and Natura2000 sites) decreased by 0.7–0.8% during the investigated time period.
Table 3 Descriptive statistics of the partial indicators (SQI, CQI, VQI, MQI) and the composite index (ESAI) by geographical division and land protection regime in Italy
Despite specific trends at the regional scale, all partial indicators showed a generalized tendency towards higher land vulnerability in Italy. The CQI increased primarily in protected areas of Northern Italy and decreased at a comparable rate in protected areas of Southern Italy. The VQI declined in Northern Italy and increased in Southern Italy with a relatively stable pattern observed in Central Italy. The MQI increased in Northern and Central Italy showing higher growth rates in NPAs and maintaining relatively stable values in Southern Italy.
illustrates the spatial distribution of soil vulnerability hotspots identified in Italy according to the procedure illustrated in section 3.6. “Critical” hotspots (including land classified as “critical, stable” and “worsening”) are concentrated in specific areas of Italy. In Northern Italy, “critical” hotspots cover 26.8% of the investigated area and are concentrated along the Po plain and in the internal uplands of Emilia Romagna and Veneto regions, being formed by a combination of both “critical, stable” (25.4%) and “worsening” conditions (1.4%). In Central Italy, “critical” hotspots cover 25.5% of the total land and are concentrated along coastal areas mainly on the Tyrrhenian side; land classified as “critical, stable” accounts for most of the hotspot area (). In both Northern and Central Italy, “critical” hotspots are concentrated in semi-dry land with high human pressure owing to agricultural intensification and urban expansion or with land abandonment, possibly determining a higher soil erosion risk.
Figure 3 Spatial distribution of soil vulnerability hotspots in Italy (1990–2010) based on the land classification system illustrated in .
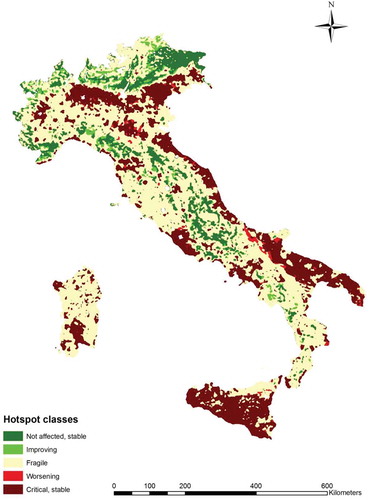
Table 4 Percent distribution of land by hotspot class, geographical division and land protection regime
In Southern Italy, “critical” hotspots cover more than 44% of the regional area and are concentrated in coastal and lowland areas of Campania and Sardinia. The largest part of Apulia and Sicilian land was also classified as “critical” to SD. This is in accordance with previous studies (Salvati and Bajocco Citation2011; Ferrara et al. Citation2012) which indicated that soil vulnerability to degradation is distributed along a latitudinal gradient in Italy and shaped by site-specific factors (micro-climate, soil attributes, vegetation cover and population pressure). Non-affected hotspots (land classified as “non-affected, stable” and “improving”) are located primarily in mountain areas along the Alps and the Apennine mountains, especially in Northern and Central Italy. In Southern Italy, non-affected hotspots are more fragmented and heterogeneously distributed in inland, mountain and marginal rural areas.
reports the percent land distribution of the five hotspot classes found in Italy as a whole and, separately, in the NPAs and Natura2000 sites. The percent composition of the hotspot classes varied significantly between Italy as a whole and NPAs, and between Italy as a whole and Natura2000 sites (in both cases, Kruskal–Wallis test, p < 0.05) while non-significant differences were found in the percent distribution of the five classes between NPAs and Natura2000 sites (Mann–Whitney U test, p > 0.1). While non-affected hotspots are concentrated in both NPAs and Natura2000 sites, the opposite pattern was observed for stable critical areas. These findings indicate the positive impact of land protection regimes (both NPA and Natura2000 status) to the mitigation of soil vulnerability to degradation and to the containment of “critical” hotspots expansion over time.
shows the proportion of land under NPAs or the Natura2000 protection regime by hotspot class. Interestingly, only 20 and the 10% of the land classified as “critical” hotspots is under Natura2000 or NPA protection regimes, respectively. These results suggest that protected areas in Italy, especially NPAs, were designated preferentially for preserving agro-forest systems with high biodiversity and good environmental quality that are not (structurally) affected by SD (but see also Capotorti et al. Citation2012 for a discussion).
Figure 4 Percent class area under the Natura2000 and National Protected Areas (NPAs) regime on the total surface area of each hotspot class in Italy.
Our results suggest that soil vulnerability to degradation in Italy is higher in NPAs. These areas may experience worse environmental conditions in the future, with the negative consequence of a further expansion of the “critical” hotspots. Traditional agro-forest systems may act as “buffer zones” to prevent the expansion of “critical” hotspots (Tombolini and Salvati Citation2014), especially in less accessible lowlands and hilly areas. Sustainable land management practices coupled with land protection measures specifically designed for traditional agro-forest landscapes were considered an indirect mitigation strategy against soil vulnerability hotspot expansion (Basso et al. Citation2012).
5. CONCLUSIONS
The present study illustrates a methodology for identifying soil vulnerability hotspots on a local scale, comparing hotspot spatial dynamics (1990–2010) in both protected and non-protected areas of Italy. The proposed approach can be implemented as a multi-temporal monitoring scheme and provides a potentially useful tool for environmental assessment and policy implementation (Gisladottir and Stocking Citation2005). The methodology allows the characterization of “critical” hotspots which require specific measures for land conservation (Barbayiannis et al. Citation2011). At the same time, the results contribute to evaluating the effectiveness of land protection measures (e.g., the Natura2000 initiative) in the mitigation of soil degradation (Briassoulis Citation2011). These findings prove to be a useful base for implementing dedicated conservation policies for natural ecosystems and agro-forest landscapes.
References
- Antrop M 2005: Why landscapes of the past are important for the future. Land. Urban Plan., 70 (1–2), 21–34. doi:10.1016/j.landurbplan.2003.10.002
- Barbayiannis N , Panayotopoulos K , Psaltopoulos D , Skuras D 2011: The influence of policy on soil conservation: a case study from Greece. Land Degrad. Develop., 22, 47–57. doi:10.1002/ldr.1053
- Basso B , De Simone L , Cammarano D , Martin EC , Margiotta S , Grace PR , Yeh ML , Chou TY 2012. Evaluating responses to land degradation mitigation measures in southern Italy. Int. J. Environ. Res., 6 (2), 367–380.
- Basso F , Bove E , Dumontet S , Ferrara A , Pisante M , Quaranta G , Taberner M 2000: Evaluating environmental sensitivity at the basin scale through the use of geographic information systems and remotely sensed data: an example covering the Agri basin—Southern Italy. Catena , 40, 19–35. doi:10.1016/S0341-8162(99)00062-4
- Briassoulis H 2011: Governing desertification in Mediterranean Europe: the challenge of environmental policy integration in multi-level governance contexts. Land Degrad Develop., 22 (3), 313–325. doi:10.1002/ldr.1018
- Capotorti G , Guida D , Siervo V , Smiraglia D , Blasi C 2012: Ecological classification of land and conservation of biodiversity at the national level: the case of Italy. Biol. Cons., 147 (1), 174–183. doi:10.1016/j.biocon.2011.12.028
- Costantini EAC , Urbano F , Aramini G et al. 2009: Rationale and methods for compiling an atlas of desertification in Italy. Land Degrad. Develop., 20, 261–276. doi:10.1002/ldr.908
- Detsis V 2010. Placing land degradation and biological diversity decline in a unified frame work: methodological and conceptual issues in the case of the north Mediterranean region. Land Degrad. Develop., 21 (5), 413–422.
- Ferrara A , Salvati L , Sateriano A , Nolè A 2012: Performance evaluation and costs assessment of a key indicator system to monitor desertification vulnerability. Ecol. Ind., 23, 123–129. doi:10.1016/j.ecolind.2012.03.015
- Geist HJ , Lambin EF 2004: Dynamic causal patterns of desertification. Bioscience , 54, 817–829. doi:10.1641/0006-3568(2004)054[0817:DCPOD]2.0.CO;2
- Gisladottir G , Stocking M 2005: Land degradation control and its global environmental benefits. Land Degrad. Develop., 16, 99–112. doi:10.1002/ldr.687
- Hargreaves GH , Samani ZA 1985: Reference crop evapotraspiration from ambient air temperature. ASAE Paper no. 85-2517. St. Joseph, Michigan: ASAE.
- Imeson A 2012: Desertification, land degradation and sustainability . London: Routledge.
- Ioja CI , Patroescu M , Rozylowicz L , Popescu VD , Verghelet M , Zotta MI , Felciuc M 2010: The efficacy of Romania’s protected areas network in conserving biodiversity. Biol Cons., 143, 2468–2476. doi:10.1016/j.biocon.2010.06.013
- Italian Ministry for the Environment, Land and Sea 2010: Officially recognized protected areas. Rome (http://www.minambiente.it retrieved October 2014).
- Italian Ministry for the Environment, Land and Sea 2012: Sites of community importance. Rome (http://www.minambiente.it retrieved October 2014).
- Kosmas C , Kirkby M , Geeson N 1999: Manual on key indicators of desertification and mapping environmental sensitive areas to desertification. Bruxelles: European Commission, Directorate General, Project ENV4-CT-95-0119 (EUR 18882).
- Lavado Contador JF , Schnabel S , Gomez Gutierrez A , Pulido Fernandez M 2009: Mapping sensitivity to land degradation in Extremadura, SW Spain. Land Degrad. Develop., 20 (2), 129–144. doi:10.1002/ldr.884
- Mancino G , Nolè A , Ripullone F , Ferrara A 2013: Landsat TM imagery and NDVI differencing to detect vegetation change: assessing natural forest expansion in Basilicata, southern Italy. Iforest, Biogeosci. Forest., 7, 75–84. http://www.sisef.it/iforest/contents/?id=ifor0909-007. (accessed October 2014). doi:10.3832/ifor0909-007
- Montanarella L 2007: Trends in land degradation in Europe. In MV Sivakumar , N N’diangui (eds). Climate and land degradation , pp. 83–104. Berlin: Springer.
- Oldfield TEE , Smith RJ , Harrop SR , Leader-Williams N 2004: A gap analysis of terrestrial protected areas in England and its implications for conservation policy. Biol. Cons., 120, 303–309. doi:10.1016/j.biocon.2004.03.003
- Romm J 2011: Desertification: the next dust bowl. Nature , 478, 450–451. doi:10.1038/478450a
- Salvati L , Bajocco S 2011: Land sensitivity to desertification across Italy: past, present, and future. Appl. Geogr., 31 (1), 223–231. doi:10.1016/j.apgeog.2010.04.006
- Salvati L , Bajocco S , Ceccarelli T , Perini L 2013: Amplifying (or reversing) the territorial disparities in land vulnerability to soil degradation: the case of Italy. Prof. Geogr., 65 (4), 647–663. doi:10.1080/00330124.2012.724351
- Salvati L , Sabbi A , Smiraglia D , Zitti M 2014. Does forest expansion mitigate the risk of desertification? Exploring soil degradation and land-use changes in a Mediterranean country. Int. For. Rev., 16 (4), 485–496.
- Simeonakis E , Calvo-Cases A , Arnau-Rosalen E 2007: Land use change and land degradation in southeastern Mediterranean Spain. Environ. Manage., 40, 80–94. doi:10.1007/s00267-004-0059-0
- Sommer S , Zucca C , Grainger A , Cherlet M , Zougmore R , Sokona Y , Hill J 2011: Application of indicator systems for monitoring and assessment of desertification from national to global scales. Land Degrad. Develop., 22 (2), 184–197. doi:10.1002/ldr.1084
- Thornes JB 2004: Stability and instability in the management of Mediterranean desertification. In J Wainwright , M Mulligan (eds). Environmental modelling: finding simplicity in complexity , pp. 303–315. Chichester: Wiley.
- Tombolini I , Salvati L 2014. A diachronic classification of peri-urban forest land based on vulnerability to desertification. Int. J. Environ. Res., 8 (2), 279–284.
- Vogt JV , Safriel U , Bastin G , Zougmore R , Von Maltitz G , Sokona Y , Hill J 2011: Monitoring and assessment of land degradation and desertification: towards new conceptual and integrated approaches. Land Degrad. Develop., 22 (2), 150–165. doi:10.1002/ldr.1075