
Abstract
The profile distribution of soil organic carbon (SOC) and total nitrogen (TN) are important indicators for predicting and simulating the effects of human activities on soil fertility and quality. However, most studies have focused on these changes in surface soil or the top 100 cm of short-term cultivated farmlands in arid regions. In the present study, farmlands cultivated for 0, 10, 15, 30, 80 and 100 years in the Cele oasis, at the southern margin of the Tarim Basin, were selected to examine cultivation effects on the vertical distribution of SOC and TN to 200 cm, and to try to find a rational approach to increase the SOC and TN stocks in cultivated farmland. The results showed that although SOC concentration and stock increased significantly at 0–20 cm along the chronosequence, the total SOC stock of the 0–200 cm layer was 13.8% lower in 30-year farmlands and 88.3% higher in 100-year farmlands than that in natural soil due to the corresponding decrease in 30-year farmlands and significant increase in 100-year farmlands at 40–200 cm depth. Cultivation also significantly increased TN concentration and stock at 0–20 cm, but the obvious increase of TN stock at 0–200 cm was only found in 100-year farmlands due to the slight change of TN stock at 40–200 cm except for 100-year farmlands. C and N stocks in the 40–200 cm layer of the cultivated farmlands contributed respectively 67.6 and 61.9% of the total SOC and TN stocks of 0–200 cm, further confirming the importance of C and N cycling in the deep layer. The continuous applications of N fertilizers combined with organic manures and irrigation with silt-laden river water contributed greatly to the increase of SOC and TN stocks. These results suggest that the oasis farmland has great potential capacity to accumulate SOC and TN only if long-term cultivation (> 30 years) and the enhancement of organic materials are implemented.
INTRODUCTION
Over the last 50 years in the Southern Rim of the Tarim Basin, increasing population pressures have led to indiscriminate exploitation of fragile lands for farmlands. Land use changes may have significant positive or negative effects on soil quality (Mojiri et al. Citation2011; Xu et al. Citation2011). However, assessing soil quality is difficult, because unlike water and air quality for which standards have been established primarily by legislation, soil quality assessments are purpose oriented and site specific (Karlen et al. Citation1994). Soil organic carbon (SOC) and total nitrogen (TN) are widely considered to be important indicators, even the major determinants of soil fertility and quality (Murty et al. Citation2002; Al-Kaisi et al. Citation2005), and both of them are very sensitive to land management practices (Gui et al. Citation2009). Thus, a better understanding of the variability of SOC and TN as affected by cultivation practices is important for improving sustainable farmland management in ecologically fragile areas.
It is well known that cultivation from native vegetation to farmlands can cause sharp declines in SOC and TN (Henry et al. Citation2009; Jiao et al. Citation2012). These losses not only affect soil productivity but also have negative environmental effects (Jia et al. Citation2006). However, it has been suggested that appropriate land use and agricultural management could contribute to an increase in SOC and improve soil quality (Bationo et al. Citation2007). After the conversion of desert to irrigation farmland in an arid region, Su et al. (Citation2012) found that returning crop residues to soil and placing legumes in a crop rotation regime can contribute to a rapid increase of SOC. In addition, continuous application of chemical fertilizer with the addition of organic manures in arid regions may also result in both higher SOC and TN contents (Liu et al. Citation2011).
Most of the studies related to the C and N stock changes have been restricted to the surface soil or the top meter of the soil horizon, and only a few include the deeper soil profile. However, soil profile distributions of SOC and TN have been considered important indicators for predicting and simulating the effects of human activities on the stability of ecosystems (Wang et al. Citation2004). After 5 years of Bermuda grass (Cynodon dactylon (L.) Pers.) management in Georgia, SOC and TN sequestration occurred in the surface 15 cm and small declines for SOC and TN occurred at lower depths to 150 cm (Franzluebbers and Stuedemann Citation2005). In the arid land, Li et al. (Citation2010) found that desert cultivation increased SOC and TN at 20–250 cm, and about 65% of the total SOC was stored at 60 to 250 cm depth. Based on the data from China’s second national soil survey and field observations in northwest China, Yang et al. (Citation2007) indicated that SOC in arid zones was distributed much deeper than expected. As a result, SOC and TN stocks in deep soil will have an unexpected impact on the entire C and N balance in arid land.
Soil organic matter accumulation is a long process, typically taking decades or hundreds of years to reach a stable level after disturbance (Powlson and Johnston Citation1994). This makes measuring SOC stocks and losses difficult and unsuited to short-term monitoring. However, the changes of SOC and TN as well as soil fertility in the process of oasisization in the Southern Rim of the Tarim Basin have received little attention. The objectives of this study were to: (1) detect the cultivation effects on the stocks and vertical distributions of SOC and TN in the cultivated oasis farmlands; (2) provide theoretical guidance and give further suggestions for sustainable development and rational management of oasis farmlands.
MATERIAL AND METHODS
Study area description
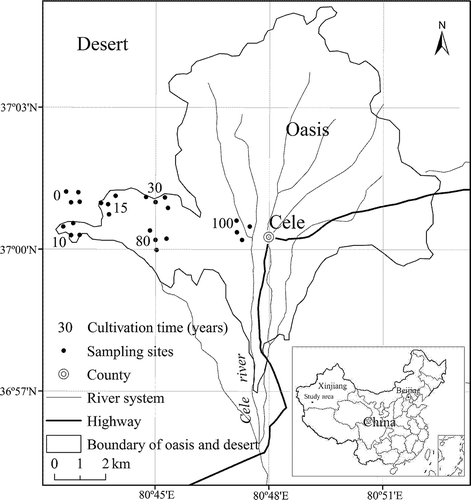
The study area is located in the Cele oasis (80°42′~80°53′E, 36°57′~37°05′N) in the lower reaches of the Cele River (). The oasis is situated in the southern margin of the Tarim Basin and at the northern piedmont of the Kunlun Mountains in southern Xinjiang, China. Elevation ranges from 1340 to 1380 m above sea level. The oasis has a typical arid continental climate with an average annual temperature of 11.9°C, average annual precipitation of 35.1 mm (maximum in May and July), and evaporation of 2595 mm. Temperature ranges from 42°C in summer to −24°C in winter. Wind is common year-round, and northwesterly winds prevail. Cele River is the only source of irrigation water in Cele oasis with annual runoff 121.4 × 10⁶ m3, and about 72.0% of the runoff distributed between July and August.
Figure 1 Location of six soil sampling sites: 100-year farmland (100), 80-year farmland (80), 30-year farmland (30), 15-year farmland (15), 10-year farmland (10) and natural land (0).
The zonal soils are predominantly aeolian sandy soil and irrigated desert soil according to Chinese Soil Taxonomy, which are equivalent to Entisols and Inceptisols in terms of the Calciorthid great group [United States Department of Agriculture (USDA) Soil Taxonomy]. These soils had a loose sandy structure, very low organic matter content, and were very susceptible to wind erosion (Gui et al. Citation2010a). Since the 1970s, sandy lands were gradually reclaimed for agriculture use, and the oasis farmland area has been increased by 76% in the past 30 years. So the history of land use for farmland in the area was from 1 year to more than 30 years. The new farmlands are primarily located in the desert–oasis ecotone in the northwest, where vegetation cover is 5–20% and is largely dominated by Alhagi sparsifolia Shap., Karelinia caspica (Pall.) Less., and Tamarix ramosissima Ledeb. This made the northwest edge of the oasis a perfect choice for the study.
Study site selection
Cultivation was mainly conducted in the most recent 30 years, and thus farmlands cultivated from native desert, representing three time periods (10, 15 and 30 years), were selected to investigate the effects of cultivation practices on changes in soil SOC and TN. The cultivated farmlands of the tree cultivation times are located at the western edge of the Cele oasis, and the study sites for each cultivation time are about 1–2 km apart (). In addition, farmlands cultivated for 80 and 100 years in the interior of the oasis with the same soil parent materials were also selected, representing long-term cultivation sites. The exact land use time of each cultivated farmland was confirmed through the previous soil survey by Gui et al. (Citation2010b). Previous study demonstrated that the SOC in the native desert had not changed significantly since 1987 (Li et al. Citation2010). Therefore, the adjacent natural desert shrubland in the desert–oasis ecotone was selected as a control site (0 year) to identify the extent of change in soil SOC and TN. More detailed information for the farmlands in each cultivation time is listed in . Our previous study showed that the utilization years of farmlands had a more significant influence on surface particle size distribution and organic matter in the study area, while the spatial distribution of farmlands did not (Gui et al. Citation2010b). Therefore, the space-for-time substitution method was used in the present study. In addition, all the farmlands were natural sandy lands before cultivation, which could justify the comparability of the soils of the cultivation chronosequence.
Farming system and management
The main crops were winter wheat (Triticum aestivum L.), summer maize (Zea mays L.) and cotton (Gossypium hirsutum L.), in the most recent 30 years. In the 1980s, the increase of crop yields mainly depended on inputs of organic manures, and a very limited number of chemical fertilizers were applied in that time (according to the census data in the 1987 statistical yearbook of Cele County). The rate of fertilizers was about 372 N kg ha−1and 90 phosphorus (P) kg ha−1 for cotton, 225 N kg ha−1 and 80 P kg ha−1 for maize, and 225 N kg ha−1, 105 P kg ha−1 for wheat each year in the most recent 15 years. Sheep manure with bedding straw and compost (82.1 and 4.9 g kg−1 as total C and N, 6.4 and 17.1 g kg−1 as available P and K) is applied at a rate of 15 t ha−1 yr−1 for cotton, 20 t ha−1 yr−1 for maize and 30 t ha−1 yr−1 for wheat. Groundwater and floods from the Cele river were the main water resources for crop production, and the former used for crop production made up more than 60% of the total irrigation water in the most recent 15 years. However, crop production completely depended on the flood from the Cele river more than 15 years ago. Irrigation amounts of 8600, 8000 and 6000 m3 ha−1 yr−1 are common in local commercial practice to ensure cotton, maize and wheat yields, respectively. Generally, the fields were plowed one time before sowing. After harvest, stalks of wheat, maize and cotton were removed, leaving a short stubble (5 cm).
The cropping system of each cultivation time in recent decades was as follows: (1) winter wheat, summer maize rotation and continuous cotton were the main cropping system in the four sampling sites of 100-year farmlands in recent 30 years; (2) winter wheat and summer maize rotation, continuous spring maize and continuous cotton were the main cropping system in the four sampling sites of 80-year farmlands in recent 30 years; (3) continuous spring maize, cotton and spring maize rotation and continuous cotton had become the main cropping system in the four sampling sites of 30-year farmlands in recent 30 years; (4) continuous spring maize and continuous cotton were the main cropping system in the four sampling sites of 10- or 15-year farmlands.
Soil sampling and measurements
In late March 2010, four replicate cotton farmlands located within the scope of 1 km2 were selected as sampling sites for each cultivation time (), since much of the cultivated land has been used for cotton cropping in recent years. The farmland size of each cultivation time was about 500 m2. To avoid significant differences caused by farming activities such as tillage, fertilization, crop rotation and irrigation, the four cotton farmlands in each cultivation time had similar planting arrangements and field management. The plant community in the desert is composed of Alhagi sparsifolia, Karelinia caspica and Tamarix ramosissima. Thus, four 20 × 20 m plots with these three vegetation types were selected as natural desert soil. Consequently, there were 24 sample sites as the experimental fields.
Soil samples were collected from 0 to 200 cm (in 10-cm intervals to 40 cm, and 20-cm intervals from 40 to 200 cm) in each sample farmland before the cotton planting in April 2010. Four 1 × 1 m plots in each farmland or the assigned natural land were chose randomly as sample points. Sampling was repeated three times per depth interval in each point, and then three samples obtained from each depth were combined. Plant residues and visible soil organisms were removed, and then samples from the same layer in each farmland were mixed into a composite sample. Meanwhile, 100-cm3 undisturbed soil samples were taken with a soil corer (stainless steel cylinder with volume of 100 cm3) at the following depths (cm): 0–10, 10–20, 20–30, 30–40, 40–60, 60–80, 80–100, 100–120, 12–140, 140–160, 160–180 and 180–200 for bulk density measurements.
The soil samples were air-dried, divided and passed through a 0.25-mm mesh. SOC was measured by the potassium dichromate and sulfuric acid (K2Cr2O7–H2SO4) oxidation method of Walkley–Black (Nelson and Sommers Citation1982). Soil TN was determined by the semi-micro Kjeldahl method (Bremner and Mulvaney Citation1982).
Statistical analysis
The total SOC density (kg m−2) and TN density (kg m−2) in each depth were calculated as follows:
One-way analysis of variance (ANOVA) was used to assess the effects of cultivation practices on the changes of SOC and TN stocks at depths. When the effect was significant (P < 0.05), a post hoc separation of means was done using the univariate least significant difference (LSD) test. ANOVA, LSD and correlation analysis were performed using SPSS 13.0 software.
RESULTS AND DISCUSSION
Soil-profile distribution of soil organic carbon and total nitrogen concentrations
Cultivation effects on the surface SOC and TN concentrations were more significant than those in deep soil layers (). At 0–20 cm, the concentrations in 10-, 15-, 30-, 80- and 100-year farmlands were 130.2, 116.9, 134.7, 303.5 and 285.3% greater than that in natural land, respectively (). The corresponding values for TN concentrations were 125.1, 106.5, 123.6, 217.6 and 170.4% greater (). In the 20- to 60-cm layers, the significant increase in SOC and TN concentrations only occurred in 80- and 100-year farmlands. Below 40 cm, SOC and TN concentrations between 0 and 15 years were almost unaffected by the cultivation practices. However, SOC concentration in 30-year farmland was about 35.9% lower than that in 15-year farmlands when averaged across 60–200 cm, but that increased by 146.9% from 30- to 100-year farmlands.
Figure 2 Depth distribution of (a) soil organic carbon (SOC) concentration, (b) total nitrogen (TN) concentration, (c) carbon:nitrogen (C:N) ratio and (d) bulk density in different cultivated farmlands. Corresponding data for 10- and 80-year farmlands were similar to these of 15- and 100-year farmlands, respectively, and they are not displayed in the line charts in order to display the SOC and TN dynamics clearly. Bars show the standard errors of means.
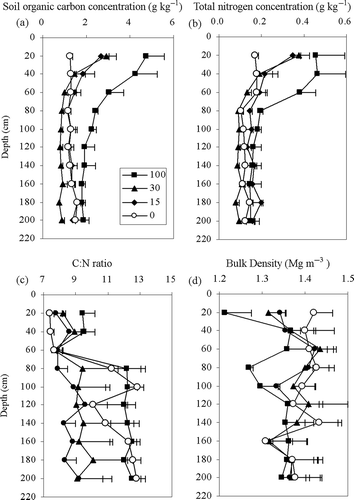
The C:N ratio in the surface soil (0–40 cm) increased with cultivation time, but tended to stabilize below 60 cm, and was even lower than that in the natural soil (). This suggests that cultivation had a more significant effect on surface SOC accumulation than on TN, but this was inverse in the deep soil layers. Moreover, the C:N ratios in the cultivated farmlands were less than 10 in 0–40-cm layers and less than 13 in deeper depths, indicating that the input of organic materials was still at low levels.
The changes in SOC and TN stocks over 100 years’ cultivation
Compared with desert soil, cultivation reduced bulk density by 5.4, 5.5, 7.6, 11.5 and 14.7% in the 10-, 15-, 30-, 80- and 100-year farmlands, for the 0–20-cm depth (). A similar result was also observed at 60–100-cm depth for 80- and 100-year farmlands. Based on the changes of soil bulk density and concentrations of SOC and TN throughout the soil profile, the cultivation effects on SOC and TN stocks at 0–200 cm depth were divided into three depths, i.e., 0–20-cm, 20–40-cm and 40–200-cm depths.
Summed to various depths, SOC and TN stocks at 0–20 cm depth increased significantly in both short-term and long-term farmlands, but changed slightly at 20–40 cm depth for the initial 30 years (). However, the obvious increase occurred at 0–20-, 20–40- and 40–200-cm depths in 80- and 100-year farmlands. The sequestration of SOC and TN in the topsoil was also observed in other oasis farmlands in northwest China (Su et al. Citation2010; Li et al. Citation2010; Xu et al. Citation2011), but was contrary to the result observed by Lobe et al. (Citation2001) who found that prolonged arable cropping leads to severe SOC loss in dry regions with sandy soils in the South African Highveld, and reached equilibrium after 34 years, but the loss continued if the cropping was prolonged even after almost 100 years. Generally, ecosystem C sequestration is determined by the law of mass conservation and the availability of key nutrient elements, such as N or P (Hessen et al. Citation2004; Kirkby et al. Citation2011). Shortage of natural resources and climatic extremes led to very low nutrient concentrations and poor soil structure in the desert in the southern rim of the Tarim Basin (Gui et al. Citation2010a). After cultivation, significant sequestrations of SOC and TN in the topsoil may be attributed mostly to the large amounts of N and P fertilizer and organic fertilizer (equivalent to 1.2~3.4 Mg C ha−1 yr−1 and 0.07~0.23 Mg N ha−1 yr−1) application as well as the frequent flood irrigation, which could improve plant production, and, in turn, increase C and N input to soils by increased litter and root production (Entry et al. Citation2004). In addition, Su et al. (Citation2010) and Li et al. (Citation2013) observed that the potential for soil carbon storage and fertility improvement in the process of desert soil cultivation were controlled to a large extent by silt and clay contents. In the present study, the irrigation water from the Cele river contains much silt and clay with 4.23~5.45 g SOC kg−1 and 0.25~0.37 g N kg−1 during flood season (Shi and Gong Citation1995). Thus, the largest SOC sequestration rate for 80- and 100-year farmlands was possibly favored by the continuous increasing clay and silt content in surface soils. These results further demonstrated that fertilization in combination with irrigation activities can lead to surface soil C and N sequestration following the conversion of desert soil to farmland (Zhang et al. Citation2014).
Figure 3 Changes of (a) soil organic carbon and (b) total nitrogen stocks at different depths after conversion of desert soil to irrigation farmlands. Different letters for each depth interval indicate significant differences between farmlands cultivated in different years (P < 0.05). Bars show the standard errors of means.
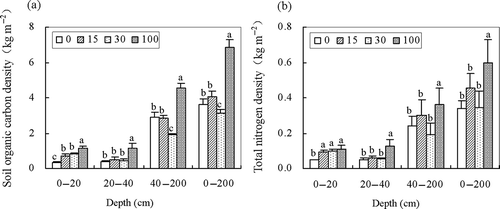
In the 40–200-cm soil layers, the sum of total SOC and TN stocks changed slightly for the initial 15 years, but total SOC stocks decreased by 35.1% in 30-year farmlands and increased by 55.0% in 100-year farmlands compared to that in natural soil (). The loss of SOC at great depths for 30-year farmlands could not be explained logically from the current experiment. It was reported that the significantly higher belowground production could promote greater soil C sequestration (Shimoda and Koga Citation2013). The desert shrubland had a strong and deep root system (Zeng et al. Citation2013), but with no fine roots in the topsoil layers (Zeng et al. Citation2006), resulting in a deep SOC distribution. However, the contributions of annual crops to C sequestration at deep depths may be limited due to the shallow distribution of roots and the slow decomposition of organic matter. Moreover, it is possible that there was a lag effect from the changes of surface SOC and TN stocks on the deep stocks. To confirm these explanations, further studies should be conducted. Long-term experiments have found that higher SOC levels in the topsoil would lead to increased fluxes of dissolved organic carbon (DOC) into the deeper depth (Drinkwater et al. Citation1998). In this study, significantly higher SOC content in the topsoil may promote the transfer of C from the topsoil to the deep soils of 80- and 100-year farmland, which was probably a reason for the increase in SOC in the deep layer. Meanwhile, soil finer particles (clay) in the farmland cultivated from desert were prone to be transported downward by irrigation and accumulate in the deep soil layer, which could provide circumstances to accumulate DOC and nutrients (Li et al. Citation2013). To improve the accuracy of predictions, more data coupled with detailed information on the mechanism of C and N cycling, belowground production and soil structure are required.
The summed SOC stocks of 0–200 cm in 10-, 15-, 80- and 100-year farmlands increased by 8.1, 11.3, 34.4 and 88.3%, respectively, but decreased by 13.8% for 30-year farmlands compared with the desert soil (). The corresponding values for TN stocks were 17.3, 33.6, 1.2, 43.9 and 76.5% higher than that in the natural soil (). Carbon stocks in the 40–200-cm layer of the cultivated farmlands contributed about 67.6% of the total variance in the whole profile SOC stocks, and that was about 61.9% for TN stocks of 40–200 cm, confirming the importance of C and N cycling in the deep layer.
Overall, the results indicated that the trend in total SOC and TN stocks of 0–200 cm exhibited complex behaviors, i.e., increased slowly from 0 to 15 years, decreased slowly for SOC but increased slightly for TN from 15 to 30 years, and then both increased significantly between 30, 80 and 100 years. Our study further affirms that soil serves as a C sink in the process of desert soil cultivation. The combined cultivation practices such as fertilization, irrigation and crop rotation appear to be the important factors for the increases of SOC and TN stocks via the addition of more organic matter (dead roots, crop residues and finer particles), which could be the logical reasons for the different results from the rain-fed farmland in the semiarid region.
Cultivation suggestions for soil organic carbon and total nitrogen accumulation
As mentioned above, agricultural management practices played an important role in the process of SOC and TN dynamics at depths. Nevertheless, positive or negative effects of management practices on stocks for the whole soil profile were also closely related to the cultivation time. The decrease of SOC sequestration in 30-year farmland and the increase in 100-year farmland were suggestive of this issue. Similarly, Su et al. (Citation2010) suggested that the evolution of desert soil toward sustainable agricultural soil requires at least 50 years. This has important implications for sustainable land management in the area.
Firstly, short-term cultivation (less than 30 years) should be reduced or eliminated, since it cannot maintain SOC and N and tends to cause land degradation and desertification. After cultivation, the continuous application of mineral fertilizer combined with organic manures in the present study was further proved to be a rational approach for the increase of SOC and TN. However, the conventional input of organic materials (≤ 30 t ha−1 yr−1) in Cele oasis was still at a low level, and the aboveground crop residues were not returned to the soil. Hence, applying more organic manure and straw returning to the farmland must be considered and guaranteed. Furthermore, water scarcity has become an increasingly serious concern in the oasis agro-ecosystem, and ineffective water use such as flood irrigation is widespread. Therefore, we have to take the water resources’ carrying capacity into consideration during the oasis farmland expansion process. Meanwhile, advanced water-saving techniques such as drop irrigation, plastic film mulching or straw mulching should be used to maintain stable and sustainable development of the oasis agriculture. Finally, even though it was uncertain whether cotton, maize and wheat affected the accumulation of SOC and TN differently, the continuous cotton cropping system was not desirable due to its higher irrigation amount and lower input of organic manure compared to maize and wheat. Overall, the newly cultivated farmlands in the oases of arid regions have a great potential capacity to accumulate SOC and TN only if appropriate or sustainable agricultural management measures, such as optimal crop rotations and advanced irrigation and fertilization methods, are effectively conducted.
Table 1 Basic conditions of the sample plots
ACKNOWLEDGMENTS
The authors would like to give their sincere thanks to the National Natural Science Foundation of China (Project No. 31200352), the Western Light Foundation of the Chinese Academy of Sciences (No. YBXM-2014-03), the National Basic Research Program of China (Project No. 2009CB421302) and the China Postdoctoral Science Foundation funded project (No. 20100471680).
REFERENCES
- Al-Kaisi MM, Yin XH, Licht MA 2005: Soil carbon and nitrogen changes as affected by tillage system and crop biomass in a corn–soybean rotation. Appl. Soil Ecol., 30, 174–191. doi:10.1016/j.apsoil.2005.02.014
- Bationo A, Kihara J, Vanlauwe B, Waswa B, Kimetu J 2007: Soil organic carbon dynamics, functions and management in West African agro-ecosystems. Agric. Syst., 94, 13–25. doi:10.1016/j.agsy.2005.08.011
- Bremner JM, Mulvaney CS 1982: Nitrogen-total. In Methods of Soil Analysis. Part 2, Ed. Page AL, Miller RH, Keeney DR, pp. 595–624. American Society of Agronomy, Madison, WI.
- Drinkwater LE, Wagoner P, Sarrantonio M 1998: Legume-based systems have reduced carbon and nitrogen losses. Nature, 396, 262–265. doi:10.1038/24376
- Entry JA, Fuhrmann JJ, Sojka RE, Shewmaker GE 2004: Influence of irrigated agriculture on soil carbon and microbial community structure. Environ. Manag., 33, S363–S373. doi:10.1007/s00267-003-9145-y
- Franzluebbers AJ, Stuedemann JA 2005: Bermudagrass management in the Southern Piedmont USA: VII. Soil-profile organic carbon and total nitrogen. Soil Sci. Soc. Am. J., 69, 1455–1462. doi:10.2136/sssaj2004.0142
- Gui DW, Lei JQ, Mu GJ, Zeng FJ 2009: Effects of different management intensities on soil quality of farmland during oasis development in southern Tarim Basin, Xinjiang, China. Int. J. Sustain. Dev. World Ecol., 16, 295–301. doi:10.1080/13504500903108887
- Gui DW, Lei JQ, Zeng FJ 2010a: Farmland management effects on the quality of surface soil during oasification in the southern rim of the Tarim Basin in Xinjiang, China. Plant Soil Environ., 56, 348–356.
- Gui DW, Lei JQ, Zeng FJ, Mu GJ, Yang FX, Su YL, Pan YF 2010b: Fractal dimension of particle size distribution and its affecting factors in oasis farmland soils in southern marginal zones of Tarim Basin. Chinese J. Eco-Agric., 18, 730–735. doi:10.3724/SP.J.1011.2010.00730
- Henry M, Valentini R, Bernoux M 2009: Soil carbon stocks in ecoregions of Africa. Biogeosci. Discuss., 6, 797–823. doi:10.5194/bgd-6-797-2009
- Hessen DO, Ågren GI, Anderson TR, Elser JJ, De Ruiter PC 2004: Carbon sequestration in ecosystems: the role of stoichiometry. Ecology, 85, 1179–1192. doi:10.1890/02-0251
- Jia Y, Li FM, Wang XL, Xu JZ 2006: Dynamics of soil organic carbon and soil fertility affected by alfalfa productivity in a semiarid agro-ecosystem. Biogeochemistry, 80, 233–243. doi:10.1007/s10533-006-9020-z
- Jiao Y, Xu Z, Zhao JH, Yang WZ 2012: Changes in soil carbon stocks and related soil properties along a 50-year grassland-to-cropland conversion chronosequence in an agro-pastoral ecotone of Inner Mongolia, China. J. Arid Land, 4, 420–430. doi:10.3724/SP.J.1227.2012.00420
- Karlen DL, Wollenhaupt NC, Erbach DC, Berry EC, Swan JB, Eash NS, Jordahl JL 1994: Crop residue effects on soil quality following 10-years of no-till corn. Soil Till. Res., 31, 149–167. doi:10.1016/0167-1987(94)90077-9
- Kirkby CA, Kirkegaard JA, Richardson AE, Wade LJ, Blanchard C, Batten G 2011: Stable soil organic matter: a comparison of C:N:P:S ratios in Australian and other world soils. Geoderma, 163, 197–208. doi:10.1016/j.geoderma.2011.04.010
- Li CH, Li Y, Tang LS 2010: Soil organic carbon stock and carbon efflux in deep soils of desert and oasis. Environ. Earth Sci., 60, 549–557. doi:10.1007/s12665-009-0195-1
- Li CH, Li Y, Tang LS 2013: The effects of long-term fertilization on the accumulation of organic carbon in the deep soil profile of an oasis farmland. Plant Soil, 369, 645–656. doi:10.1007/s11104-013-1605-4
- Liu WJ, Su YZ, Yang R, Yang Q, Fan GP 2011: Temporal and spatial variability of soil organic matter and total nitrogen in a typical oasis cropland ecosystem in arid region of Northwest China. Environ. Earth Sci., 64, 2247–2257. doi:10.1007/s12665-011-1053-5
- Lobe I, Amelung W, Du Preez CC 2001: Losses of carbon and nitrogen with prolonged arable cropping from sandy soils of the South African Highveld. Europ. J. Soil Sci., 52, 93–101. doi:10.1046/j.1365-2389.2001.t01-1-00362.x
- Mojiri A, Kazemi Z, Amirossadat Z 2011: Effects of land use changes and hillslope position on soil quality attributes (A case study: Fereydoonshahr, Iran). Afr. J. Agri. Res., 6, 1114–1119.
- Murty D, Kirschbaum MUF, Mcmurtrie RE, Mcgilvray H 2002: Does conversion of forest to agricultural land change soil carbon and nitrogen? a review of the literature. Global Change Biol., 8, 105–123. doi:10.1046/j.1354-1013.2001.00459.x
- Nelson DW, Sommers LE 1982: Total carbon, organic carbon and organic matter. In Methods of Soil Analysis. Part 2, Ed. Page AL, Miller RH, Keeney DR, pp. 534–580. American Society of Agronomy, Madison, WI.
- Powlson DS, Johnston AE 1994: Long-term field experiments: their importance in understanding sustainable land use. In Chapter 22 in Soil Resilience and Sustainable Land Use, Eds. Greenland DJ, Szabolcs I, pp. 367–394. CAB International, Wallingford.
- Shi CH, Gong ZT 1995: Formation and classification of warpic soils in China. Acta Pedol. Sin., 32, 437–448. In Chinese
- Shimoda S, Koga N 2013: Rapid change in soil C storage associated with vegetation recovery after cessation of cultivation. Soil Sci Plant Nutr., 59, 27–34. doi:10.1080/00380768.2012.736342
- Su YZ, Yang R, Liu WJ, Wang XF 2010: Evolution of soil structure and fertility after conversion of native sandy desert soil to irrigated cropland in arid region, China. Soil Sci., 175, 246–254. doi:10.1097/SS.0b013e3181e04a2d
- Su YZ, Yang R, Yang X, Fan GP 2012: Effects of agricultural management practices on soil organic carbon and its fractions in newly cultivated sandy soil in Northwest China. Sci Agric Sin., 45, 2867–2876.
- Wang SQ, Huang M, Shao XM, Mickler RA, Li KR, Ji JJ 2004: Vertical distribution of soil organic carbon in China. Environ. Manage., 33, S200–S209. doi:10.1007/s00267-003-9130-5
- Xu WQ, Chen X, Luo G, Lin Q 2011: Using the CENTURY model to assess the impact of land reclamation and management practices in oasis agriculture on the dynamics of soil organic carbon in the arid region of North-western China. Ecol. Complex, 8, 30–37. doi:10.1016/j.ecocom.2010.11.003
- Yang YH, Mohammat A, Feng JM, Zhou R, Fang JY 2007: Storage, patterns and environmental controls of soil organic carbon in China. Biogeochemistry, 84, 131–141. doi:10.1007/s10533-007-9109-z
- Zeng FJ, Bleby TM, Landman PA, Adams MA, Arndt SK 2006: Water and nutrient dynamics in surface roots and soils are not modified by short-term Flooding of Phreatophytic Plants in a Hyperarid Desert. Plant Soil, 279, 129–139. doi:10.1007/s11104-005-0498-2
- Zeng FJ, Song C, Guo HF, Liu B, Luo WC, Gui DW, Arndt S, Guo DL 2013: Responses of root growth of Alhagi sparsifolia Shap. (Fabaceae) to different simulated groundwater depths in the southern fringe of the Taklimakan Desert, China. J. Arid Land, 5, 220–232. doi:10.1007/s40333-013-0154-2
- Zhang L, Zhao R, Xie Z 2014: Response of soil properties and C dynamics to land-use change in the west of Loess Plateau. Soil Sci Plant Nutr., 60, 586–597. doi:10.1080/00380768.2014.922407