
Abstract
During plant development and growth, low phosphorus (P) is a common stress. Under low P, plant roots release organic acids to acidify the rhizosphere, which is an important physiological response of plants during adaptation to low-P stress. Acidification enhances the solubility of P in the rhizosphere and increases P uptake by plants. However, how plants perceive and transduce the signal of low P, and acidify the rhizosphere to achieve efficient absorption and utilization of P, is not clear. This report established a direct and efficient method to screen rhizosphere acidification deficiency mutants by observing the color change on medium containing bromocresol purple. Twenty-two rhizosphere acidification deficiency mutants were cloned from a library of 70000 T-DNA insertion mutants. These mutants were related to, for example, transcription regulation, calcium ions and Proton-Adenosine Triphosphatase (H+-ATPase), which represent starting points for understanding the mechanism for the regulation of P nutrition, absorption and utilization via rhizosphere acidification.
INTRODUCTION
Phosphorus (P) is a macronutrient that affects plant growth, development and reproduction. Not only is P an important component of biological molecules, such as Adenosine Triphosphate (ATP), nucleic acids and phospholipid, it also plays important roles in many enzymatic reactions, signal transductions and metabolic pathways. P fertilizer consumption is increasing each year because of food demand resulting from population expansion. The majority of P is adsorbed and fixed when applied to the soil. However, the orthophosphate content is still low in the growing season, because most of it exists in the form of barely soluble and organic P (Vance et al. Citation2003; Cordell et al. Citation2009). Higher plants have developed strategies to cope with this; for example, increased density of lateral roots and increased root hairs; increased morphological ratio of roots to shoots; secretion by plant roots of acid phosphatases, nucleases and organic acids to mobilize more phosphate (Pi) from the rhizosphere; increased expression of Pi starvation-induced genes and molecular-level activation of Pi transport proteins (Bates and Lynch Citation1996; Rausch and Bucher Citation2002; Ticconi and Abel Citation2004). Thus, physiological, biochemical and morphological changes are used by plants to accomplish highly efficient adsorption of soil P.
Acidificaiton of the rhizosphere, a common strategy to cope with low P stress, activates and improves the utilization efficiency of soil P. White lupin (Lupinus albus L.) has developed so-called proteoid roots to acidify infertile soil under P deficiency, which is attributed to the release of organic acids and H+ (Li et al. Citation1997; Watt and Evans Citation1999). Sugar beet roots mainly exude salicylic acid and citramalic acid to solubilize soil P (Khorassani et al. Citation2011). Higher activity of root-secreted acid phosphatase in a P-efficient genotype of rapeseed (Brassica napus L.) was induced under low-P conditions, which was beneficial for the increased uptake of P (Zhang et al. Citation2010). Further research suggested that the plasma Proton-Adenosine Triphosphatase (H+-ATPase) drives transmembrane transport by creating a proton motive force; its activity is induced by P deficiency and is involved in rhizosphere acidification and the efficient utilization of P (Yan et al. Citation2002). However, how plants perceive and transduce a low P signal, and then regulate the secretion of organic acids and protons to promote acidification and improve the P adsorption efficiency, remains unclear.
This study showed that the pH of the rhizosphere decreased to below 5.5 when the roots of Arabidopsis are induced to promote acidification under low P conditions. Bromocresol purple was chosen as the pH indicator, whose color changes from yellow to purple when the pH increases from 5.2 to 6.8. Thus, the process of rhizosphere acidification could be observed by the color changes of bromocresol. A library of T-DNA mutants was used to screen for rhizosphere acidification deficiency mutants. The physiological functions of potential mutants were analyzed under low P and the genes of mutants were cloned using Thermal asymmetric interlaced PCR (Tail-PCR) technology. The identified mutants represent vital research materials to analyze the regulatory mechanism of P absorption and utilization, and the production of high-efficiency P strains.
MATERIALS AND METHODS
Plant materials and growth conditions
Dry seeds of Arabidopsis thaliana (L.) were surface sterilized using 0.1% mercury chloride (HgCl2) for 5 min, washed 6–8 times using sterilized water and placed on Murashige and Skoog (MS) medium plates (containing Murashige and Skoog (MS) salts, 3% sucrose and 0.6% agar, pH 5.8) at 4°C for 3 d. Plates were placed in chambers (day/night cycle of 16 h/8 h at 22°C; light intensity of 90–120 mmol m−2 s−1; relative humidity of 80%), for 1–2 weeks.
Screening of rhizosphere acidification deficiency mutants
T3 generation seeds of the T-DNA insertion library created by Zhang et al. (Citation2005) were used to screen for mutants. This T-DNA library contained an estrogen-inducible expression LexA-VP16-Estragon Receptor (XVE) system. The seeds were placed on MS medium (0.6% agar) at 4°C for 3 d. The plates were then incubated for 10 d. The seedlings were transferred to MS or low P (12.5 μM potassium dihydrogen phosphate (KH2PO4)) medium which contained 0.75% [weight/volume (w/v)] agar, 0.006% (w/v) bromocresol purple, pH 5.8 for 8–24 h.
Measurements of rhizosphere acidification capacity
The measurements were performed as previously described (Santi and Schmidt Citation2009) and modified. Three hundred microliters of the MS or low-P solution (0.5% sucrose, 0.006% bromocresol purple, pH 5.8) was added into 96-well plates. The 10-d-old seedlings were transferred to the plates and three seedlings were pooled as one sample; three samples were set per treatment. The plates were placed in chambers for 2–3 h. One hundred microliters of solution of each sample was removed to another 96-well plate. Rhizosphere acidification capacity was accessed by reading the adsorption at 590 nm (A590).
Measurements of lateral roots and primary roots
Seedlings grown on 0.5 × MS medium for 5 d were transferred to MS or low-P (12.5 μM) medium for 9 d. The roots from 20 individual plants of each line per treatment were used. Three samples were set per treatment. The roots of seedlings were photographed. The number and total length of the lateral roots of each seedling were determined. The total length of primary roots of each seedling was also determined.
Anthocyanin measurements
This method followed that of Kim et al. (Citation2003) with some modifications. Seedlings (0.01 g) were collected and extracted with 1% hydrochloric acid (HCl)-methanol solution overnight at 4°C. After adding 200 μL deionized water and 200 μL methenyl trichloride, samples were centrifuged at 14,000 × g for 10 min. The supernatant was removed and the amounts of anthocyanins in the supernatant were quantified spectrophotometrically. The amount of anthocyanin was calculated as A 530–0.33A 657.
Assay of phosphate (Pi)
Inorganic phosphate in plant samples was determined by the method of Ames (Citation1966) with modifications. Fresh tissue was ground into powder and mixed with 125 μL of deionized water. The samples were centrifuged at 3000 × g for 4 min. Ten microliters of supernatant was removed and added into 96-well plates. Fifteen microliters of deionized water, 100 μL of 1 M HCl and 100 μL of assay solution (4.2% ammonium molybdate (NH4MoO4), 0.2% malachite green) were added to the wells. After incubation for 15 min, 100 μL of 1.5% tween-20 was added, the solution was mixed and incubation was continued for another 15 min. The adsorption was read at 660 nm and the Pi content was calculated according to a standard curve.
Tail-PCR
This method followed that of Liu and Whitter (Citation1995). The primers were used as followed: A3-5’ ATCATCCCCTCGACGTACTGTAC-3’, A4-5’ CTGG TTTTATATACAGCAG TCGACG-3’, A5 5’-AGTCGAGGTAAGATTAGATATGG −3’, A1-a 5’-GGATCTTCGCAAGACCCTTCCTC-3’, and AD3 5’- (A/T)GTGNAG (A/T) ANCANAGA-3’.
Reverse transcriptase-PCR
Total RNA was isolated with TRIzol reagent (Invitrogen). The first-strand cDNA was synthesized from 0.5 μg total RNA using Moloney murine leukemia virus reverse transcriptase (Invitrogen) with the oligo(dT) primer. The Actin2 gene was amplified with specific primers to calibrate equal quantities of first-strand cDNA per reaction. The following gene-specific primers were used to detect RAD10 cDNA: 5’- CATAA GACCTGGCTGGCTGTATCGTA-3’ and 5’- CTTGCTTAGCAGAATCAGTTCC-3’.
Ten microliters of the product was run on an agarose gel and the results were documented.
RESULTS
Establishment of rhizosphere acidification mutant screening conditions
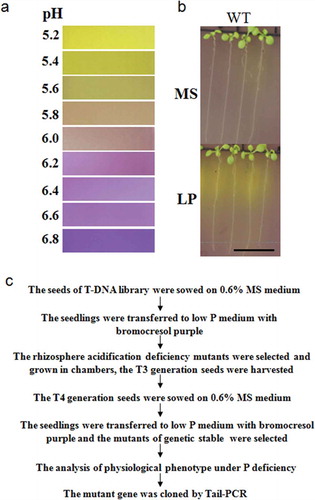
As a pH indicator, the color of bromocresol purple changes from yellow to purple when the pH increases from 5.2 to 6.8. To establish the screening system for rhizosphere acidification deficiency mutants, MS media containing bromocresol purple at different pH were observed and used as an indicator standard (). Low P concentration, coloration time and the growth condition of seedlings were assessed and the final screening conditions were set as follows: T3 generation seeds of the T-DNA library were placed on MS medium (0.6% agar) and incubated for 10 d. The seedlings were transferred to MS or low P (12.5 μM) medium containing 0.75% (w/v) agar, 0.006% (w/v) bromocresol purple, pH 5.8, for 8 h. As shown in , there were no significant color changes around the roots of wild-type (WT) seedlings on the MS medium. By contrast, the color of the rhizosphere of WT seedlings on the low-P medium turned yellow. The results suggest that the WT rhizosphere did not acidify under the normal conditions. When it was induced by low P, acidification occurred and the pH of the rhizosphere decreased to 5.2. It was reported that the proteoid roots of White lupin (Lupinus albus) acidify the medium (Yan et al. Citation2002). Consistent with this, our results show that the maturation zone and elongation zone of the roots of Arabidopsis thaliana acidified the medium. The screening procedure is shown in .
Figure 1 The rhizosphere acidification of Arabidopsis thaliana (L.) is shown on medium with the pH indicator bromocresol and the screening procedure. (a) A comparison of the color of medium containing bromocresol purple with pH. (b) The rhizosphere acidification of the wild type (WT) on the medium with indicator purple under sufficient phosphorus (P; 1.25 mM) or low-P (12.5 µm) conditions. Bar = 1 cm. MS, Murashige and Skoog media. LP, low P. (c) The screening procedure for rhizosphere acidification deficiency mutants under low P Tail-PCR, Thermal asymmetric interlaced PCR.
The screening of rhizosphere acidification deficiency mutants under low P
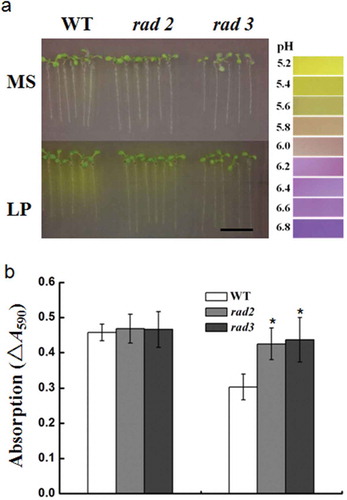
Two hundred and sixteen candidate rhizosphere acidification deficiency mutants were screened from a library of about 70000 T-DNA insertion seeds. After self-pollination, the seeds of the T4 generation of the mutants were harvested. The rhizosphere acidification experiment was repeated to check all of the candidate mutants from the first screening. Sixty mutant lines of 216 mutant plants showed a phenotype of rhizosphere acidification deficiency, which was consistent with the T3 generation. This indicated that the phenotype could be inherited stably (). To ensure the accuracy of the screening conditions, the acidification capacity of candidate mutants was examined. Zero point zero zero six percent bromocresol purple was added into MS or low P nutrient solution. Bromocresol purple, which does not bind to protons, has a maximum absorption peak at 590 nm. As the pH value of the solution decreased, the proton concentration increased, and bromocresol purple reduced, which resulted in a decrease in absorption. As shown in and Table S1, the absorption of the WT at 590 nm decreased under low P compared with normal conditions, indicating a significant net increase in proton flux. The adsorptions of all 60 mutant lines such as rhizosphere acidification deficiency (rad)2 and rad3 were greater than the WT, which suggested that the acidification capacity of the mutants was significantly lower than that of the WT.
Figure 2 The phenotype of the T4 generation of rhizosphere acidification deficiency mutants on the medium with bromocresol purple, and measurement of acidification capacity. (a) The rhizosphere acidification reaction of the T4 generation of acidification deficiency mutants under phosphorus (P)-sufficient and low-P conditions. Bar = 1 cm. MS, Murashige and Skoog media. LP, low P. (b) The acidification capacity of the wild type (WT) and mutants rhizosphere acidification deficiency 2 (rad2), rad3. Data are the mean ± standard deviation of three biological replicates with nine seedlings per replicate. Asterisks indicate statistically significant differences compared with WT (Student’s t test, P < 0.05).
Analysis of the low-P phenotype of rhizosphere acidification deficiency mutants
The rhizosphere acidification deficiency mutants were grown on MS and low-P medium for 20 d, after which their physiological phenotypes were observed. The WT and mutants showed good and uniform growth on MS medium. On the low-P medium, 38 of 60 mutants accumulated higher anthocyanin than that of WT (Table S2). For example, the rad10 mutant showed a phenotype of sensitivity to Pi deficiency (). The anthocyanin contents of the WT and rad10 were determined. Consistent with the phenotype, the anthocyanin content of rad10 seedlings was approximately 2-fold higher than in the WT (). The Pi contents of the 60 candidate mutants were also determined. The data suggested that the Pi contents of 23 mutants, such as rad6, were different from those of WT (; Table S3). A slight increase in the Pi concentration was observed in the leaves of the rad6 plants compared with the WT plants under low-P conditions (). The results indicated that the rad6 mutant differed in the process of rhizosphere acidification, and was associated with Pi homeostasis. In addition, among these 23 mutants, some of them did not accumulate higher anthocyanin than the WT. It seems that there is no inevitable correlation between anthocyanin accumulation and Pi content.
Figure 3 The anthocyanin accumulation phenotype and measurements of contents of wild type (WT) and rad10. (a) The anthocyanin accumulation in WT and rad10 plants during phosphorus (P)-sufficient and P-deprivation conditions. Five-day-old seedlings of WT and rad10 plants were transferred into MS medium with P (1.25 mM) or low P (12.5 μM) for 20 d. Bar = 1 cm. (b) Anthocyanin content was determined in WT and rad10 plants grown with P and low P on the 20th day of Pi starvation. Bars represent the mean ± standard deviation of three biological replicates with 12 seedlings per replicate. Asterisks represent statistically differences compared with the wild type (Student’s t test, P < 0.05). MS, Murashige and Skoog media. LP, low P.
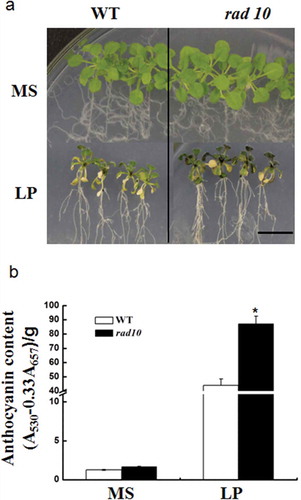
Figure 4 Determination of Pi contents of wild type (WT) and rad6. Pi contents in shoots and roots of wild-type and rad6 plants grown on MS or LP medium for 21 d. Bars represent the mean ± standard deviation of three biological replicates. Asterisks represent statistically significant differences compared with WT (Student’s t test, P < 0.05). MS, Murashige and Skoog media. LP, low P. Pi, phosphate.
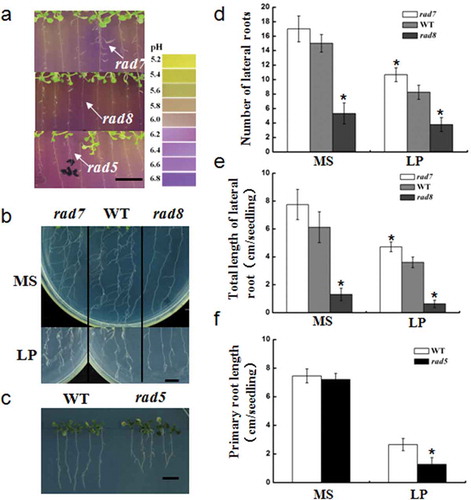
The rhizosphere acidification deficiency mutants with root development mutation were identified. As indicated in , fewer lateral roots were found in rad8 and excessive lateral roots were found in rad7. Mutant rad5 had shorter primary roots compared with the WT. Thus, in these mutants, there is a close relationship between the process of rhizosphere acidification and root development. To confirm the genetic stability of these mutants, the acidification phenotypes of T4 generation mutants were repeated and statistical data were collected. As shown in –, the lateral root numbers and total length of rad8 plants were reduced under both sufficient and low-P conditions compared with the WT plants. In addition, there was a significant increase in the length and number of lateral roots of rad7 plants under Pi deficiency. Compared with the WT plants, the primary root length of rad5 plants was reduced.
Figure 5 Some of the root development mutants screened from acid-base indicator medium, and data statistics. (a) The rhizosphere acidification of rad5, rad7 and rad8 mutants and root architecture under low phosphorus (P) in the first screening. Bar = 1 cm. (b) The root architecture of rad7, rad8 and wild type (WT) in the second screening under both P-sufficient and low-P conditions. Bar = 1 cm. (c) The root architecture of rad5 and WT under low P in the second screening. Bar = 1 cm. (d–f) Comparative histograms of wild type and rad5, rad7 and rad8 mutants with regard to lateral root number and length, and primary root length under both P-sufficient and low-P conditions. Bars represent the mean ± standard deviation of three biological replicates. Asterisks represent statistically significant differences compared with WT (Student’s t test, P < 0.05). MS, Murashige and Skoog media. LP, low P.
The cloning of a rhizosphere acidification mutant gene
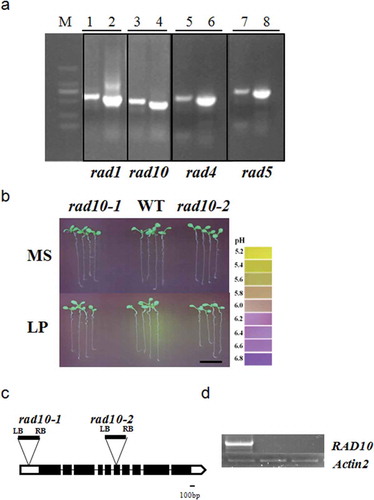
The rhizosphere acidification mutants were screened from a library of T-DNA insertion mutants; therefore, the acidification deficiency mutation might have been caused by the T-DNA insertion. The tail-PCR approach was used to clone the mutant gene from 60 candidate mutant lines. Electrophoresis of the products of tertiary and quaternary reactions was performed. The clear bands of the fourth round were purified and sequenced (). Forty-eight mutants were successfully amplified by Tail-PCR. Sequence alignment was used to identify the insertion sites of possible genes, at the website http://www.arabidopsis.org/. To prove the co-segregation of the phenotype and the T-DNA line, we ordered seeds from the Salk institute that included all the candidate genes at different insertion sites. The seeds were bred, and homozygotes were identified. The acidification phenotype of each Salk seed was then determined. Ultimately, the phenotypes of 22 genes were successfully repeated from different T-DNA insertion sites, such as rad10 ( and Table S4). The expression of the RAD10 gene in rad10-1 and rad10-2 (SALK-058642) was analyzed. The results showed that RAD10 was knocked out in both rad10-1 and rad10-2 (–). The predicted functions were shown in . H+-ATPase is involved in the process of rhizosphere acidification under P deficiency and a related H+-ATPase was screened from this library (rad5), which confirmed the depth and accuracy of this screening system.
Table 1 The amplification of insertion sites of rhizosphere acidification deficiency candidate mutants and function prediction
Figure 6 (a) The Thermal asymmetric interlaced PCR (Tail-PCR) amplification products of rad1, rad10, rad4 and rad5 mutants. Numbers 1, 3, 5 and 7 were products of tertiary reactions; 2, 4, 6 and 8 were products of quaternary reactions. MS, Murashige and Skoog media. LP, low P. (b) The rhizosphere acidification of rad10-1, wild type (WT) and rad10-2 (SALK-058642) mutants under phosphorus (P)-sufficient and low-P conditions. Bar = 1 cm. (c) T-DNA insertion sites of rad10-1 and rad10-2. (d) Reverse transcriptase-PCR analysis of RAD10 expression. Actin2 served as a control.
DISCUSSION
Rhizosphere acidification is a widespread response to P deficiency, particularly in dicotyledonous plants. Organic acids are often secreted by roots during the process of acidification. These organic acids often include: malic acids, malonic acid, lactic acid, acetic acid, citric acid, butanedioic acid and trans aconitic acid (Rengel Citation2002). Root exudates cause the rhizosphere pH to decrease by 2–3 units. Rhizosphere pH change is mainly due to the imbalance of anions and cations, which are taken up by plant roots (Zhang Citation1992). To compensate for the imbalance of charge, plants release proton (H+) or hydroxide (OH−). If the cation absorption is dominant, the roots secrete more H+ than bicarbonate (HCO3 −) or OH– to maintain pH values for plant normal growth and the charge balance, resulting in acidification of the rhizosphere soil. It is reported that increased absorption of cations is the main cause of the secretion of protons and rhizosphere acidification under P deficiency (Hinsinger et al. Citation2003). Excessive absorption of cations prompted proton release in leguminous plants, causing the pH value of the rhizosphere to decrease significantly, which improved the dissolution of insoluble P compounds and the biological availability of P (Hinsinger et al. Citation2005).
The identification of the rhizosphere acidification deficiency mutants will increase our understanding of the regulation mechanism of efficient P utilization via rhizosphere acidification. Thus, the establishment of an efficient screening method is vital. Here, the response of bromocresol purple to changing pH was used to identify rhizosphere acidification deficiency mutants. With the increasing pH, the color of the medium changed from yellow to purple. The color of the rhizosphere was close to yellow when the roots performed acidification under P deficiency. Therefore, the change of pH could be shown visually and clearly by this medium.
Chen et al. (Citation2000) identified mutants that showed severely impaired growth on media containing nucleic acids as the only source of P. The ribonuclease and acid phosphatase activities were reduced significantly in these mutants in response to Pi limitation. Wang et al. (Citation2011) screened mutants with altered acid phosphatase under Pi deficiency by applying an agar solution containing 5-bromo-4-chloro-3- indolyl-phosphate (BCIP), which is a substrate of the acid phosphatase. The roots of WT plants secrete acid phosphatase to degrade BCIP producing blue precipitates that can be observed on the low Pi medium. In contrast, the roots of acid phosphatase deficiency mutants remained white. In this report, a novel method of in situ coloration was applied to screen for rhizosphere acidification deficiency mutants. Compared with previous methods, this selection process is simpler, more efficient and intuitive. Using this method, a number of stable mutants were screened, suggesting that this method is effective. Among the cloned mutants, some are related to H+-ATPase, calcium ion (Ca2+) or transcription factors, which suggested that many different types of genes are involved in rhizosphere acidification. In addition, the physiological phenotypes of these mutants were different, suggesting crosstalk between the rhizosphere acidification process and other low-P reactions, and implying that rhizosphere acidification is a complex process. The relationship between rhizosphere acidification and root development, Pi content and rhizosphere acidification needs further research. Collectively, this screening system supplied important materials to aid our understanding of the molecular mechanism of rhizosphere acidification and laid the foundation for the construction of high-P-using crops.
Supplemental Materials
Download MS Word (53.5 KB)ACKNOWLEDGMENTS
We thank Jian Ru Zuo for providing the library of T-DNA seeds. This work was supported by the National Natural Science Foundation of China (31371426).
SUPPLEMENTARY MATERIAL
The supplementary material for this article is available online from: http://dx.doi.org/10.1080/00380768.2015.1007025.
REFERENCES
- Ames BN 1966: Assay of inorganic phosphate, total phosphate and phosphatase. Methods Enzymol., 8, 115–118. doi:10.1016/0076-6879(66)08014-5
- Bates TR , Lynch JP 1996: Stimulation of root hair elongation in Arabidopsis thaliana by low phosphorus availability. Plant Cell Environ., 19, 529–538. doi:10.1111/j.1365-3040.1996.tb00386.x
- Chen DL , Delatorre CA , Bakker A , Abel S 2000: Conditional identification of phosphate-starvation-response mutants in Arabidopsis thaliana . Planta , 211(1), 13–22. doi:10.1007/s004250000271
- Cordell D , Dranger JO , White S 2009: The story of phosphorus: global food security and food for thought. Global Environ Change , 19, 292–305. doi:10.1016/j.gloenvcha.2008.10.009
- Hinsinger P , Gobran GR , Gregory PJ , Wenzel WW 2005: Rhizosphere geometry and heterogeneity arising from root-mediated physical and chemical processes. New Phytol., 168(2), 293–303. doi:10.1111/j.1469-8137.2005.01512.x
- Hinsinger P , Plassard C , Tang C , Jaillard B 2003: Origins of root-mediated pH changes in the rhizosphere and their responses to environmental constraints. Plant Soil , 248, 43–59. doi:10.1023/A:1022371130939
- Khorassani R , Hettwer U , Ratzinger A , Steingrobe B , Karlovsky P , Claassen N 2011: Citramalic acid and salicylic acid in sugar beet root exudates solubilize soil phosphorus. BMC Plant Biol., 11, 121–128. doi:10.1186/1471-2229-11-121
- Kim J , Yi H , Choi G , Shin B , Song PS , Choi G 2003: Functional characterization of phytochrome interacting factor 3 in phytochrome-mediated light signal transduction. Plant Cell , 15(10), 2399–2407. doi:10.1105/tpc.014498
- Li M , Shinano T , Tadano T 1997: Distribution of exudates of lupin roots in the rhizosphere under phosphorus deficient conditions. Soil Sci Plant Nutr., 43, 237–245. doi:10.1080/00380768.1997.10414731
- Liu YG , Whitter RF 1995: Thermal asymmetric interlaced PCR: automatable amplification and sequencing of insert end fragment from P1 and YAC clones for chromosome walking. Genomics , 25(3), 674–681. doi:10.1016/0888-7543(95)80010-J
- Rausch C , Bucher M 2002: Molecular mechanisms of phosphate transport in plants. Planta , 216(1), 23–37. doi:10.1007/s00425-002-0921-3
- Rengel Z 2002: Genetic control of root exudation. Plant and Soil , 245, 59–70. doi:10.1023/A:1020646011229
- Santi S , Schmidt W 2009: Dissecting iron deficiency-induced proton extrusion in Arabidopsis roots. New Phytol., 183(4), 1072–1084. doi:10.1111/j.1469-8137.2009.02908.x
- Ticconi CA , Abel S 2004: Short on phosphate: plant surveillance and countermeasures. Trends Plant Sci., 9(11), 548–555. doi:10.1016/j.tplants.2004.09.003
- Vance CP , Uhde‐Stone C , Allan DL 2003: Phosphorus acquisition and use: critical adaptations by plants for securing a nonrenewable resource. New Phytologist , 157, 423–447. doi:10.1046/j.1469-8137.2003.00695.x
- Wang L , Li Z , Qian W et al. 2011: The Arabidopsis purple acid phosphatase AtPAP10 is predominantly associated with the root surface and plays an important role in plant tolerance to phosphate limitation. Plant Physiol., 157(3), 1283–1299. doi:10.1104/pp.111.183723
- Watt M , Evans JR 1999: Proteoid roots. Physiology and development. Plant Physiol., 121(2), 317–323. doi:10.1104/pp.121.2.317
- Yan F , Zhu Y , Müller C , Zörb C , Schubert S 2002 : Adaptation of H+-pumping and plasma membrane H+-ATPase activity in proteoid roots of white lupin under phosphate deficiency. Plant Physiol., 129(1), 50–63. doi:10.1104/pp.010869
- Zhang FS 1992: Root exudates and their role in plant nutrition (in Chinese). Acta Agriculturae Universitatis Pekinensis , 18, 353–356.
- Zhang J , J X X , Kong YZ , Ji ZD , Wang XC , An FY , Li C , Sun JQ , Zhang SZ , Yang XH 2005: Generation of chemical-inducible activation tagging T-DNA insertion lines of Arabidopsis thaliana (in Chinese). Yi Chuan Xue Bao , 32(10), 1082–1088.
- Zhang Y , Xu S , Ding P et al. 2010: Control of salicylic acid synthesis and systemic acquired resistance by two members of a plant-specific family of transcription factors. Proc. Natl. Acad. Sci. USA., 107(42), 18220–18225. doi:10.1073/pnas.1005225107