
Abstract
Calcium (Ca) deficiency symptoms in plants often occur in agriculture; however, little is known about the mechanisms for adaptation to low-Ca conditions. To understand the mechanisms, we screened for Arabidopsis thaliana (L.) Heynh mutants sensitive to low Ca. Here, we describe one of the mutants, lcs1-1, isolated from the screen. The relative shoot growth of the mutant was reduced under the low-Ca conditions compared with the wild-type plants. Genetic mapping and genome resequencing revealed that lcs1-1 has one nonsynonymous mutation in the region of the chromosome responsible for the phenotype. The mutation is in Pleiotropic Regulatory Locus 1 (PRL1). An allelism test between lcs1-1 and a T-DNA inserted allele of prl1 demonstrates that the causal gene of lcs1-1 is PRL1. It has been reported that PRL1 is involved in sugar metabolism; however, the involvement of PRL1 in low-Ca tolerance has not been reported. Our results suggest a new insight connecting sugar metabolism with a mechanism for low-Ca tolerance in plants.
INTRODUCTION
Calcium (Ca) deficiency is one of the physiological disorders widely observed in agriculture (White and Broadley Citation2003). Typical Ca deficiency symptoms include blossom end rot (BER) in tomato (Solanum lycopersicum L.) and green pepper (Capsicum annuum L.), and tip burn in cabbage (Brassica oleracea L.) and Chinese cabbage (Brassica rapa L.) (White and Broadley Citation2003). These disorders deprive crops of their commercial value.
Ca is absorbed from roots and transported to shoots along the transpiration stream (White and Broadley Citation2003). Fully expanded leaves have a high transpiration rate which carries more Ca, while young expanding tissues have a low transpiration rate which carries less Ca. In addition, Ca is hardly retranslocated from old to young tissues. Consequently, Ca accumulation is generally higher in old tissues than in newly developed tissues (White and Broadley Citation2003). For this reason, Ca deficiency symptoms often occur in the tip region of fruit or new leaves. Several environmental factors affect the occurrence of Ca deficiency symptoms even in the presence of high Ca in soil. For example, high humidity can reduce the rate of transpiration, which is required for Ca distribution. Ca deficiency symptoms are also caused by low Ca availability in soil due to the competition with other cations such as magnesium (Mg; Walker et al. Citation1955).
Several genes have been reported to affect Ca distribution in plants. The Ca2+/H+ antiporter, CAX1, is one of the main determinants for the Ca concentration of shoot in Arabidopsis thaliana (L.) Heynh. (Conn et al. Citation2011). Transgenic tobacco (Nicotiana tabacum L.) and tomato constitutively expressing CAX1 displayed Ca-deficiency symptoms under the normal Ca condition (Hirschi Citation1999; De Freitas et al. Citation2011). The cax1 mutant of A. thaliana shows low-Ca tolerant phenotypes (Cheng et al. Citation2003). These studies establish the importance of CAX1 in Ca homeostasis. In addition to CAX1, Mechano-sensitive channels (MCAs), putative Ca channel, are shown to be essential for maintaining Ca concentration in plants and growth under a low Ca:Mg ratio (Yamanaka et al. Citation2010).
In addition to genes involved in Ca transport, genes involved in Ca utilization are also involved in low-Ca tolerance. For example, pectin methylesterase, essential for the formation of pectin-Ca crosslinks, is a determinant of the occurrence of BER in tomato fruit (De Freitas et al. Citation2012).
Although several genes have been identified, it is most likely that other genes are also involved in low-Ca tolerance. Here we show the identification of a novel gene involved in low-Ca tolerance through the identification of the causal gene of a low-Ca-sensitive mutant. This gene is known as a key gene in sugar response.
MATERIALS AND METHODS
Plant growth condition
Arabidopsis thaliana (L.) Heynh accession Col-0 obtained from laboratory stock was used for the physiological experiments. Plants were grown at 22°C under a 16-h light/8-h dark cycle. Ethyl methanesulfonate (EMS)-mutagenized seeds (Col-0) from Lehle Seeds (Round Rock, TX, USA). were sterilized and sown on a medium containing 2 mM magnesium sulfate, 2 mM potassium dihydrogen phosphate, 6 mM potassium nitrate, 1 mM ammonium chloride, 2 mM calcium chloride, 4 mM sodium nitrate, 8.6 µM iron(II) sulfate, 10.3 µM manganese(II) sulfate, 30 µM boric acid, 1 µM zinc sulfate, 1 µM copper(II) sulfate, 130 nM cobalt(II) chloride, 24 nM hexaammonium heptamolybdate, 1% [weight/volume (w/v)] sucrose (SIGMA ALDRICH®, catalog no. 84097-250G, St. Louis, USA) solidified with 1.5% (w/v) agar (NACALAI TESQUE, INC, catalog no. 01056-15, Kyoto, Japan). pH was adjusted to 5.5 by 0.5 mM K2HPO4. Hereafter, this medium is referred to as “Yamagami medium”. CaCl2 was used to modify the Ca concentration in the medium. The sowed seeds were kept at 4°C for 2–3 d for moist-cold stratification. For RNA extraction, plants were grown with Yamagami medium containing 2 mM Ca for 1 week, then transferred to a plate containing 2 or 0.2 mM Ca and grown for another 1 week. For Ca determination, plants were grown with Yamagami medium containing 2 mM Ca for 4 weeks.
Next generation sequencing
Genome re-sequencing was performed according to a previous method (Tabata et al. Citation2013).
Plant genotyping
For the allelism test, the genotype of lcs1-1 were confirmed at the PRL1 locus by derived cleaved amplified polymorphic sequence marker (Neff et al. Citation1998) using following primer pairs and HaeIII: 5ʹ-TTGGAATTTTTGATTTGATAGGTT-3ʹ and 5ʹ-CCTGCAGACAGAGTCTCGGC-3ʹ.
The T-DNA insertion mutants of PRL1(AT4G15900) and PRL2(AT3G16650), prl1-2 (SALK_008466) and prl2-2 (SALK_075970) (Németh et al. Citation1998; Weihmann et al. Citation2012), were obtained from the Arabidopsis Biological Resource Center (ABRC) at Ohio State University (Columbus, OH, USA). The genotypes of the prl1-2 plants were confirmed by polymerase chain reaction (PCR) using the following primer pairs for the wild type and prl1-2 alleles, respectively:
5ʹ-GACCTTCAAATGCTCTTTCCCTC-3ʹ (PRL1 specific, reverse orientation) and 5ʹ-CTGCTTCTACAATCGCCAAAG-3ʹ (PRL1 specific, forward orientation); 5ʹ-GACCTTCAAATGCTCTTTCCCTC-3ʹ (PRL1 specific, reverse orientation; same as the above) and 5ʹ-ATTTTGCCGATTTCGGAAC-3ʹ (the T-DNA left border specific).
The genotypes of the prl2-2 plants were confirmed by PCR using the following primer pairs for the wild type and prl2-2 alleles, respectively: 5ʹ-CAGGTTCAACGTCTCTGAAGC-3ʹ (PRL2 specific, reverse orientation) and 5ʹ-TCGATACAAGCGAATAAACCC-3ʹ (PRL2 specific, forward orientation); 5ʹ-CAGGTTCAACGTCTCTGAAGC-3ʹ (PRL2 specific, reverse orientation; same as the above) and 5ʹ-ATTTTGCCGATTTCGGAAC-3ʹ (the T-DNA left border specific).
RNA isolation and quantitative reverse transcription PCR
Shoots were excised and were immediately frozen in liquid nitrogen. RNA was extracted using a NucleoSpin® RNA Plant kit (Takara Bio Inc, Otsu, Japan) following the manufacturer’s protocol. Total RNA was reverse transcribed using PrimeScript™ RT Master Mix (Perfect Real Time; Takara Bio Inc, Otsu, Japan) and quantitative PCR was conducted by SYBR® Premix Ex Taq™ II (Takara Bio Inc, Otsu, Japan). The expression levels of PRL1 were normalized by that of EF1α (AT5G60390). Primers used in this experiment are as follows: for PRL1, 5ʹ-CTGGGACCTTGAGCAGAATAAG-3ʹ (forward orientation) and 5ʹ-GTCATGTCCTGAGAGTGCAAAA-3ʹ (reverse orientation); for EF1α, 5ʹ-CCTTGGTGTCAAGCAGATGA-3ʹ (forward orientation) and 5ʹ-TGAAGACACCTCCTTGATGATT-3ʹ (reverse orientation).
Determination of Ca concentration
About 10–20 mg of shoot samples were excised and washed in deionized water, then dried at 60°C for 2 d. After measurement of dry weight, samples were digested with 0.5 mL of 13 M nitric acid (Wako Pure Chemical, Osaka, Japan) for 1.5 h at 120°C. Then, 0.5 mL of hydrogen peroxide was added and pellets were digested for 1.5 h at 120°C. After the complete evaporation of hydrogen peroxide, the pellets were dissolved in 0.08 M nitric acid containing 2 ppb indium. Element concentrations were determined by inductively coupled plasma mass spectrometry (ICP-MS; SPQ9700, Hitachi High Technologies, Tokyo, Japan).
RESULTS AND DISCUSSION
Isolation of lcs1-1 mutant
In our screening of EMS-mutagenized seeds, we selected plants with reduced growth under 0.2 mM Ca relative to the growth under 2 mM Ca, and referred to them as low-calcium-sensitive (lcs) mutants. We obtained more than 20 lcs lines (Yamagami et al. unpublished data).
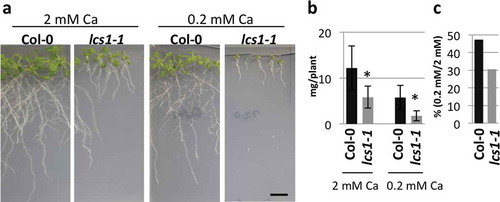
One of the isolated lines, lcs1-1, showed a small shoot phenotype under the low-Ca condition (0.2 mM Ca; ). The shoot fresh weight of lcs1-1 is less than that of Col-0 irrespective of Ca concentrations in media (). The ratio of fresh weight under the low-Ca to that under the normal condition (2 mM Ca) is smaller in lcs1-1 than that of Col-0 (), indicating that lcs1-1 is a low-Ca sensitive mutant. The leaf size of lcs1-1 was smaller than that of Col-0 irrespective of Ca concentration in media (). The leaf number of lcs1-1 is also lower than that of Col-0 under both the normal and the low-Ca conditions (Fig. S1, in the Online Supplementary Material). Primary roots of lcs1-1 are shorter than those of the wild type (). The number of lateral roots of lcs1-1 is less than that of Col-0 under the low-Ca but not under the normal condition ().
Figure 1 Low-calcium (Ca) sensitivity of lcs1-1. (a) Phenotypes of Col-0 and lcs1-1 under 2 mM and 0.2 mM Ca. Plants were grown on the medium for 2 weeks. Scale bar = 1 cm. (b) Shoot fresh weight of Col-0 and lcs1-1. Plants were grown under 2 mM or 0.2 mM Ca for 2 weeks. Bars represent mean ± standard deviation (SD; n = 7 for Col-0 and 4 for lcs1-1 under 2 mM Ca; 14 for Col-0 and 8 for lcs1-1 under 0.2 mM Ca). Asterisks indicate a significant difference between Col-0 and lcs1-1 by Student’s t-test (p < 0.05). (c) Ratio of shoot fresh weight measured in (b). Mean values in (b) are used for the calculation of the ratio.
Identification of the causal gene of lcs1-1
To identify the causal gene of lcs1-1, genetic mapping was performed using the F2 population between lcs1-1 (Col-0 background) and Ler with simple sequence length polymorphism (SSLP) markers (). The result of the mapping revealed that the causal gene of lcs1-1 is located between 8.7 and 9.1 Mbp on chromosome 4 ().
Figure 2 Identification of the causal gene of lcs1-1. (a) Position of causal gene on chromosome 4 and the exon-intron structures of Pleiotropic Regulatory Locus 1 (PRL1) gene. Simple sequence length polymorphism markers are indicated in arrows. Recombinant F2 individuals per total F2 individuals examined are shown under each marker. Insertion site of T-DNA in SALK_008466/prl1-2 and nonsynonymous mutation of lcs1-1/prl1-10 are shown. Filled boxes, gray boxes and thick bars indicate exons encoding a protein, untranslated regions and introns, respectively. (c) Phylogenetic tree of PRL1 homologs. Homologs of PRL1 are searched by SALAD database v. 3 (Mihara et al. Citation2009). The tree was constructed by Unweighted Pair Group Method with Arithmetic mean methods based on amino acid sequences. YPL: Saccharomyces cerevisiae, GSVIVP: Vitis vinifera, Sm: Selaginella moellendorffi, Pp: Physcomitrella patens, Sb: Sorghum bicolor, Cr: Chlamydomonas reinhardti, Ot: Ostreococcus trauri.
To find mutations in lcs1-1, its genome was resequenced (Tabata et al. Citation2013). In the mapped region, only one nonsynonymous point mutation was detected and it was in AT4G15900, Pleiotropic Regulatory Locus 1 (PRL1; ). The mutation causes amino acid substation, Gly279 to Arg. Homologs of PRL1 are present in all eukaryotes examined (), and Gly279 is conserved among plants, Saccharomyces cerevisiae, and Schizosaccharomyces pombe but not in Homo sapiens L. or Caenorhabditis elegans Maupas (Németh et al. Citation1998).
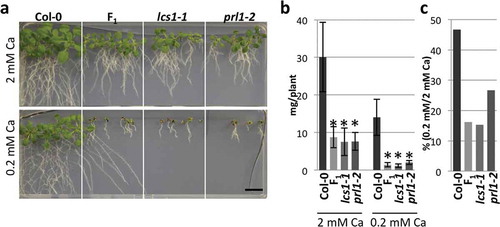
To demonstrate that the causal gene of lcs1-1 is PRL1, we obtained one T-DNA insertion line (prl1-2/SALK_008466, Németh et al. Citation1998) and examined its low-Ca sensitivity. Similar to lcs1-1, the relative shoot growth of prl1-2 was reduced under low-Ca conditions compared with Col-0 (–). Further, we performed an allelism test between lcs1-1 and prl1-2. F1 plants of these lines could not complement the low-Ca sensitivity of parental lines, indicating that the causal gene of lcs1-1 is PRL1 (–). Hereafter, lcs1-1 is referred as prl1-10.
Figure 3 Low-calcium (Ca) sensitivity of lcs1-1 and prl1-2. (a) Phenotypes of Col-0, lcs1-1, prl1-2 and F1 plants between lcs1-1 and prl1-2 under 2 mM and 0.2 mM Ca. Plants were grown on the medium for 2 weeks. Scale bar = 1 cm. (b) Shoot fresh weight of Col-0, lcs1-1, prl1-2 and F1 plants. Bars represent mean ± standard deviation (SD; n = 4 for Col-0, 6 for F1, 5 for lcs1-1 and 5 for prl1-2 under 2 mM Ca; 6 for Col-0, 6 for F1, 4 for lcs1-1 and 3 for prl1-2 under 0.2 mM Ca). Asterisks indicate a significant difference between Col-0 and mutants by Dunnett’s test (p < 0.05). (c) Ratio of shoot fresh weight of Col-0, lcs1-1, prl1-2 and F1 plants between under 2 mM and 0.2 mM Ca. Mean values in (b) are used for the calculation of the ratio.
To examine whether the low-Ca sensitivity of prl1-10 is caused by the reduction of Ca accumulation in the mutants, the Ca concentrations in shoots were determined. There was no significant difference between mutants and Col-0 (Fig. S2), suggesting that PRL1 is not involved in Ca transport under the normal Ca condition. We acknowledge that the possibility that prl1 mutants have defects in Ca accumulation cannot be excluded because we could not obtain data on Ca concentration in prl1 mutants under the low-Ca condition because their growth was too poor for the analysis. Furthermore, PRL1 mRNA accumulation in shoots was not affected by the low-Ca treatment (Fig. S3).
In the A. thaliana genome, there is one homolog of PRL1, PRL2 (AT3G16650; ). To investigate the role of PRL2 for low-Ca tolerance, we obtained a T-DNA line of PRL2 (SALK_075970/prl2-2; Weihmann et al. Citation2012). prl2-2 did not show low-Ca sensitivity (Fig. S4), indicating that PRL2 is not required for low-Ca tolerance, in contrast to the case of PRL1.
Possible mechanism for low-Ca tolerance mediated by PRL1
prl1 was previously isolated as a mutant hypersensitive to glucose and sucrose, and it has been shown that prl1 mutants accumulate high amounts of glucose and sucrose (Németh et al. Citation1998). The high accumulation of sugar is caused by excess accumulation of SNF1-like protein kinase (AKIN10; Bhalerao et al. Citation1999), a negative regulator of sugar catabolism (Halford and Hardie Citation1998). It is suggested that AKIN10 is degraded through the ubiquitin-proteasome pathway mediated by PRL1 (Lee et al. Citation2008). It is possible that disruption of PRL1 leads to excess accumulation of glucose and sucrose. It has been known that glucose and sucrose are substrates of the synthesis of cell wall components, such as cellulose or callose (Wolf et al. Citation2012). Considering that the cell wall is one of the main storage areas for Ca in plants (Marschner Citation1995), it is possible that the sensitivity of prl1 to low Ca is caused by the change of sugar homeostasis, which is likely to affect cell wall composition. In other words, it is possible that PRL1 has an essential role for the adaptation to low-Ca conditions through the maintenance of the cell wall by its contribution to sugar metabolism. This hypothesis is supported by the mutant analysis of mur4, a cell wall mutant deficient in arabinose (Li et al. Citation2007). The mur4 prl1 double mutant displayed a recovery from the sugar sensitivity of a single mur4 mutant, suggesting that sugar accumulation by prl1 mutation could affect cell walls.
In the present study, we established an important role for PRL1 in low-Ca tolerance. Further analysis will validate the above hypothesis and bring new insights into how sugar metabolism mediated by PRL1 links to adaptation to low-Ca circumstances in plants.
SUPPLEMENTARY MATERIAL
The supplementary material for this article is available online from: http://dx.doi.org/10.1080/00380768.2015.1086277.
TSSP_A_1086277_Supplementary_material.pdf
Download PDF (442.3 KB)ACKNOWLEDGMENTS
We thank ABRC for providing us with plant materials. We appreciate Emiko Yokota for her excellent technical assistance. We thank Zhihang Feng and Takahiro Hasegawa for critical reading of the manuscript. This work was supported in part by grants from the Japan Society for the Promotion of Science (Grant-in-Aid for Scientific Research numbers 25221202 and 25114506) to T.F.
REFERENCES
- Bhalerao R, Salchert K, Bako L, Okresz L, Szabadoz L, Muranaka T, Machida Y, Schell J, Koncz C 1999: Regulatory interaction of PRL1 WD protein with Arabidopsis SNF1-like protein kinases. Proc. Natl. Acad. Sci. USA, 96(9), 5322–5327. doi:10.1073/pnas.96.9.5322
- Cheng NH, Pittman JK, Barkla BJ, Shigaki T, Hirschi KD 2003: The Arabidopsis cax1 mutant exhibits impaired ion homeostasis, development, and hormonal responses and reveals interplay among vacuolar transporters. Plant Cell, 15(2), 347–364. doi:10.1105/tpc. 007385
- Conn SJ, Gilliham M, Athman A, et al. 2011: Cell-specific vacuolar calcium storage mediated by CAX1 regulates apoplastic calcium concentration, gas exchange, and plant productivity in Arabidopsis. Plant Cell, 23(1), 240–257. doi:10.1105/tpc.109.072769
- De Freitas ST, Handa AK, Wu Q, Park S, Mitcham EJ 2012: Role of pectin methylesterases in cellular calcium distribution and blossom-end rot development in tomato fruit. Plant J., 71(5), 824–835. doi:10.1111/j.1365-313X.2012.05034.x
- De Freitas ST, Padda M, Wu Q, Park S, Mitcham EJ 2011: Dynamic alternations in cellular and molecular components during blossom-end rot development in tomatoes expressing sCAX1, a constitutively active Ca2+/H+ antiporter from Arabidopsis. Plant Physiol., 156(2), 844–855. doi:10.1104/pp.111.175208
- Halford NG, Hardie DG 1998: SNF1-related protein kinases: global regulators of carbon metabolism in plants? Plant Mol. Biol., 37(5), 735–748. doi:10.1023/A:1006024231305
- Hirschi KD 1999: Expression of Arabidopsis CAX1 in tobacco: altered calcium homeostasis and increased stress sensitivity. Plant Cell, 11(11), 2113–2122. doi:10.1105/tpc.11.11.2113
- Lee JH, Terzaghi W, Guasmroli G, Charron JBF, Yoon HJ, Chen H, He YJ, Xiong Y, Deng XW 2008: Characterization of Arabidopsis and rice DWD proteins and their roles as substrate receptors for CUL4-RING E3 ubiquitin ligases. Plant Cell, 20(1), 152–167. doi:10.1105/tpc.107.055418
- Li Y, Smith C, Corke F, Zheng L, Merali Z, Ryden P, Derbyshire P, Waldron K, Bevan MW 2007: Signaling from an altered cell wall to the nucleus mediates sugar-responsive growth and development in Arabidopsis thaliana. Plant Cell, 19(8), 2500–2515. doi:10.1105/tpc.106.049965
- Marschner H 1995: Mineral Nutrition of Higher Plants, 2nd ed., pp. 285–299. Academic Press, London.
- Mihara M, Itoh T, Izawa T 2009: SALAD database: a motif-based database of protein annotations for plant comparative genomics. Nucleic Acids Res. doi:10.1093/nar/gkp831
- Neff MM, Neff JD, Chory J, Pepper AE 1998: dCAPS, a simple technique for the genetic analysis of single nucleotide polymorphisms: experimental applications in Arabidopsis thaliana genetics. Plant J., 14(3), 387–392. doi:10.1046/j.1365-313X.1998.00124.x
- Németh K, Salchert K, Putnoky P, et al. 1998: Pleiotropic control of glucose and hormone responses by PRL1, a nuclear WD protein, in Arabidopsis. Genes Dev., 12, 3059–3073. doi:10.1101/gad.12.19.3059
- Tabata R, Kamiya T, Shigenobu S, Yamaguchi K, Yamada M, Hasebe M, Fujiwara T, Sawa S 2013: Identification of an EMS-induced causal mutation in a gene required for boron-mediated root development by low-coverage genome re-sequencing in Arabidopsis. Plant Signal Behav., 8(1), e22534. doi:10.4161/psb.22534
- Walker RB, Walker HM, Ashworth PR 1955: Calcium-magnesium nutrition with special reference to serpentine soils. Plant Physiol., 30(3), 214–221. doi:10.1104/pp.30.3.214
- Weihmann T, Palma K, Nitta Y, Li X 2012: PLEIOTROPIC REGULATORY LOCUS 2 exhibits unequal genetic redundancy with its homolog PRL1. Plant Cell. Physiol., 53(9), 1617–1626. doi:10.1093/pcp/pcs103
- White PJ, Broadley MR 2003: Calcium in plants. Ann. Bot., 92(4), 487–511. doi:10.1093/aob/mcg164
- Wolf S, Hématy K, Höfte H 2012: Growth control and cell wall signaling in plants. Annu. Rev. Plant Biol., 63, 381–407. doi:10.1146/annurev-arplant-042811-105449
- Yamanaka T, Nakagawa Y, Mori K, et al. 2010: MCA1 and MCA2 that mediate Ca2+ uptake have distinct and overlapping roles in Arabidopsis. Plant Physiol., 152(3), 1284–1296. doi:10.1104/pp.109.147371