
Abstract
Vivianite is a hydrated ferrous phosphate mineral that can form in reducing environments, and it was recently identified on aged paddy rice (Oryza sativa, L., cultivar Hitomebore) roots. However, the formation and dissolution of vivianite appear highly susceptible to the soil redox potential. We examined the effect of water management on the vivianite content of rice roots in three experimental micro (1 m2) paddy fields. The vivianite content of the roots was estimated using a method based on the alteration of vivianite after heating at 105°C for 48 h. This alteration steeply lowers the dissolution of phosphate from the roots in a mixed acid solution of 0.1 mol L−1 of hydrochloric acid (HCl) and 1 mol L−1 of acetic acid (CH3COOH). Efficiency of the method was confirmed regarding heating temperature and duration of heating. Using this method, we found that water management significantly influenced the vivianite content of the rice roots. The vivianite content of the rice roots was highest, i.e., 2.3 g phosphorus (P) kg−1 expressed by its estimated P content, when the paddy field was continuously flooded from May to until early September. After flooding stopped, the soil was gradually oxidized, leading to a decrease in vivianite content. In the micro plot exposed to midseason drainage, the vivianite content increased to the level of the continuously flooded plot after reflooding, and finally decreased after flooding was stopped in late August. The plots exposed to midseason drainage followed by intermittent irrigation presented the lowest vivianite contents among the three experimental paddy fields. These results confirm that increases and decreases in the vivianite contents of paddy-rice roots strongly depend on water management.
INTRODUCTION
Changes in redox conditions are known to influence phosphorus (P) dynamics in the soil environment (Kirk Citation2004; Reddy et al. Citation2005). Reducing conditions that develop in flooded soils, in particular in the plow-layer soil of paddy fields, are considered to enhance P supply from soil to the rice (Oryza Sativa, L.) plant. In Japan, rice seedlings are usually transplanted to the puddled soil in May. Following transplantation, the soil is then continuously flooded until late June/mid-July. This first half of the flooded period is characterized by fast growth of the rice roots and the development of anoxic conditions in the plow-layer soil. Only the top 1–2 cm of the uppermost soil maintains oxidizing conditions. From late June to mid-July, midseason drainage is a common practice to avoid the detrimental effects of soil over-reduction and to increase soil strength in preparation for rice harvest in the fall. Water is supplied again during the heading and ripening stages, and flooding is ceased at the end of August. In September, the plow layer soil is drained and it gradually oxidizes again.
Indices of biologically available P, such as Truog P or Bray No. 2 P, and dissolved P levels in soil water have also been reported to increase under reducing conditions (Shiga Citation1973; Kyuma Citation2004). Previous research suggested that vivianite, Fe(II)3(PO4)2 · 8H2O, might be responsible for these observations (Konno and Kobo Citation1970; Iimura Citation2005). Heiberg et al. (Citation2012) also considered vivianite to explain P behavior in soils under reduced conditions. Vivianite is thought to thermodynamically form under reducing conditions and to dissolve after soil oxidation (Lindsay Citation1979); therefore, vivianite content is most likely affected by the changing redox conditions of paddy soils from flooding to drainage.
Using an optical microscope, Wada et al. (Citation1977) described a vivianite-like material of rice roots. More recently, Nanzyo et al. (Citation2010, Citation2013) confirmed the presence of vivianite crystals on aged rice roots under reducing conditions by X-ray microdiffraction, scanning electron microscopy (SEM) and energy dispersive X-ray (EDX) analysis. Vivianite was present as crystal aggregates both within and on the surface of aged rice roots after air-drying the samples. The crystals remained attached to the rice roots, even after the soil was washed off, and are visible under an optical microscope with 30 or 40× magnification. However, after drainage and rice harvest, vivianite crystals were little observed (Nanzyo et al. Citation2013).
A quantitative method is required to elucidate the effect of water management on the vivianite content, which may have an important relation to available P in the paddy field soil. Nanzyo et al. (Citation2013) reported a method using alteration of vivianite with heating at 105°C. However, the temperature is considerably lower than that described as a major differential thermal response ranging from 65 to 315°C attributable to an endothermal loss of structural water and oxidation of ferrous ion (Fe2+) (Rodgers and Henderson Citation1986). Thus, it is necessary to examine whether the heating treatment at 105°C is practically effective.
In the present study, we aimed to (1) test in detail the method previously developed to estimate vivianite content of rice roots and (2) determine the effect of water management on the vivianite content of paddy-rice roots.
MATERIALS AND METHODS
Examinations to quantitate vivianite of rice roots
We tested in detail the method described by Nanzyo et al. (Citation2013) using synthetic vivianite (Editorial Board of Encyclopaedia Chimica Citation1964), based on the fact that vivianite is altered with heating at 105°C for 48 h and its P solubility in a mixed acid solution of 0.1 mol L−1 hydrochloric acid (HCl) and 1 mol L−1 acetic acid (AcOH) decreases. With this heating treatment, vivianite crystal is altered to noncrystalline iron phosphate with brown color (Nanzyo et al. Citation2013).
In order to examine the alteration of chemical structure of vivianite, we determined the weight loss of a vivianite sample through incremental heating from room temperature to 800°C. At each heating step (50, 80, 105, 150, 200, 300, 400, 500, 600 and 800°C), constant temperature was maintained for at least 23 h after the temperature reached a target value.
In order to find the optimal heating duration, 11 mg of synthetic vivianite were heated at 105°C for 0, 3, 6, 12, 24 and 48 h. Unground and ground samples were prepared using an agate mortar to examine the effect of particle size on the solubility of vivianite in the mixed acid solution. Then, 40 mL of the mixed acid solution was added to the heated vivianite and kept at room temperature for 5 h; this mixture was stirred by hand occasionally. The amount of dissolved P was determined by the molybdenum blue method as described by Murphy and Riley (Citation1962). Heating for 48 h provided adequately stable results. Following a similar protocol, 11 mg of vivianite was heated at 20, 50, 80, 105 and 150°C for 48 h, followed by mixed acid extraction and determination of the P dissolved to find the optimal heating temperature.
Rice cultivation in model rice paddy fields
Three micro paddy fields (1 m2) were built in the Sendai experimental agricultural field of the Graduate School of Agricultural Science, Tohoku University, Japan. The plow-layer soil was transported to the site from a farmer’s paddy field, which is Gley lowland soil according to the Cultivated Soil Classification Committee (Citation1995), and Udifluvent according to United States Department of Agriculture (USDA) soil taxonomy (Soil Survey Staff Citation2006). The air-dried fine-earth fraction of this soil showed the following properties: Truog and Bray No. 2 P levels (Editorial Boards of Methods for Soil Environment Analysis Citation1997) were 51 and 378 mg P kg−1, respectively; oxalate-extractable aluminum (Al) and iron (Fe) contents were 1.2 and 8.6 g kg−1, respectively; the percentage of P retention determined following Blakemore et al. (Citation1981) was 38; total carbon and nitrogen (N) contents were 23 and 2.2 g kg−1, respectively; ammonium acetate-extractable calcium (Ca), magnesium (Mg), potassium (K) and sodium (Na) contents were 6.9, 1.5, 0.76 and 0.65 cmolc kg−1, respectively; cation exchange capacity determined by the ammonium acetate method was 23.6 cmolc kg−1; and pH(H2O) with a soil:solution ratio of 1:2.5 was 5.1.
After puddling following ordinary practices in Japan, 8 g m−2 of N (as coated urea), potassium oxide (K2O) (as potassium sulfate), and phosphorus (V) oxide (P2O5) (as superphosphate) were applied as bands. Rice seedlings (Oryza sativa, L., cultivar Hitomebore) were transplanted on May 21, 2010 (). Tap water was supplied for irrigation, and all of the micro plots were flooded until July 14 (54 days after transplanting, DAT). One micro plot was continuously flooded until September 9 (111 DAT) without midseason drainage. This plot was named “continuous flooding (CF).” Two micro plots were exposed to midseason drainage from July 14 to August 1 (72 DAT). From those two micro plots, following midseason drainage, one of the plots was continuously flooded again until September 9. This plot was named “midseason drainage and flooding (MF).” The other micro plot was exposed to intermittent irrigation, keeping oxidizing conditions after the midseason drainage. This plot was named “midseason drainage and intermittent irrigation (MI).” The redox potential (Eh) was measured at a depth of 5 cm using platinum electrodes. The modified Bray No. 2 P (MBP) values were also determined from 1 g of wet soil. Soil weight was also measured following P extraction after washing and oven-drying the soil, and MBP values were corrected in relation to the soil:solution ratio (1:20) as shown in the results.
Two soil cuboids (approximately 15 cm wide × 20 cm long × 12 cm deep) including rice roots were sampled () on July 7 (47 DAT), August 4 (75 DAT), September 2 (104 DAT), October 6 (138 DAT) and November 4 (167 DAT). Rice roots were readily separated from the soil using tap water from a shower head and air-dried. A fraction of the cleaned rice roots were observed under an optical microscope. The roots were also photographed using SEM (Hitachi SU8000) operated at 15 kV, after applying a vacuum evaporated carbon coating to identify the vivianite crystals. EDX analysis was used to examine the elemental composition of the vivianite crystals. The remaining roots with vivianite particles were cut into small pieces, and their vivianite content was determined following the above-described method.
Figure 1 Dates of water management change and rice (Oryza sativa, L.) root sampling.
RESULTS AND DISCUSSION
Conditions to quantitate vivianite of rice roots
The effect of heating vivianite at 105°C was evaluated by measuring weight loss using synthetic vivianite. As shown in , weight continued to decrease until the temperature reached approximately 500°C. Theoretical weight loss for the conversion of vivianite to iron (III) oxide (Fe2O3) and P2O5 or ferric (III) phosphate (FePO4) and Fe2O3 is calculated to be 23.94%. At 500°C, the sample had lost 24.22% of its weight, suggesting that all vivianite had completely converted to oxides. Vivianite is converted into an X-ray-amorphous phase at 105°C (Nanzyo et al. Citation2013); however, the measured weight loss was only 14.10%. Although the weight loss of vivianite at 105°C is less than that of complete conversion to oxides, the decrease in P dissolution in the mixed acid solution after heating at 105°C gave adequately effective results to estimate the vivianite content of the roots. The results were interpreted as follows.
After heating synthetic vivianite for 0–48 h at 105°C, the color of the vivianite crystals gradually changed from blue to brown. The amount of dissolved P in the mixed acid solution also decreased with time and temperature of heating (). After heating for 48 h at 105°C, dissolved P from the unground sample decreased to 4% (1.59 g P kg−1) compared to the vivianite content before heating (36.0 g P kg−1), although the dissolved P from the ground sample (31.2 g P kg−1) tended to decrease steeply and showed slightly high values at 24 (2.22 g P kg−1) and 48 h (2.01 g P kg−1) in . The effect of grinding may vary with grinding intensity (Nanzyo et al. Citation2013). The amount of dissolved P did not change with increasing temperature from 105°C to 150°C, suggesting that heating at 105°C was appropriate to estimate the vivianite content. The P content in vivianite was calculated as the difference between P dissolved in the mixed acid solution before heating and P dissolved in the solution after heating, divided by a factor of [1 − 0.04]. The difference was divided by [1 − 0.04] because 4% of the heated synthetic vivianite was dissolved in the mixed acid solution.
Figure 2 Weight loss of synthetic vivianite with heating. Note that error bars are present but are not larger than the symbols used in the plot.
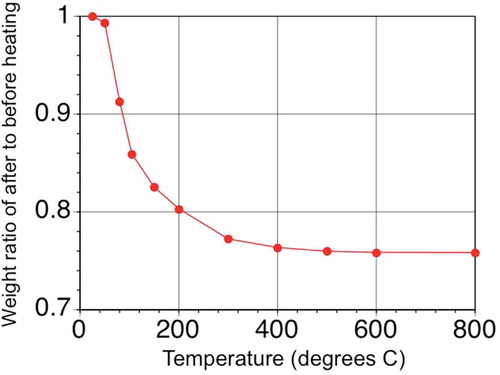
Figure 3 Changes in the amount of extractable phosphorus (P) in 0.1 mol L−1 hydrochloric acid (HCl) and 1 mol L−1 acetic acid (AcOH) from unground and ground synthetic vivianite with time (0, 3, 6, 12, 24 and 48 h) at 105°C (a) and heating temperature (20, 50, 80, 105, and 150°C) for 48 h (b). The error bars represent the absolute deviation from the mean (n = 2).
As shown in , alteration of vivianite by heating is evident from the steep decrease in P solubility in the mixed acid solution. However, the alteration appears slow and it took about 24 h or longer to reach the minimum of P solubility (). According to Rothe et al. (Citation2014), synthetic vivianite lost its characteristic X-ray diffraction pattern upon heating at 60°C for 24 h. On the other hand, Rodgers and Henderson (Citation1986) reported that no appreciable structural change was shown by X-ray diffraction up to 150°C using differential thermal analysis (DTA) at a heating rate of 10°C min−1. One of the reasons for the latter observation may be the rapid heating rate, common to DTA, while alteration of vivianite is slow. In the case that the heating rate is 10°C min−1, it takes only 13 min to raise the temperature from 20 to 150°C, while suggests that vivianite alteration at 105°C did not finish in 3 h.
Rice growth and Eh values
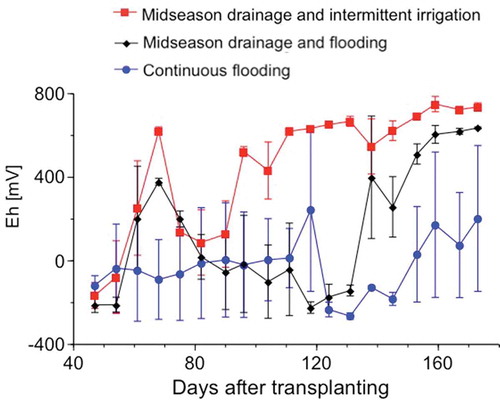
Rice plants grew normally, and no significant difference in growth rate was observed among the three micro plots. Differences in water management are shown to have an effect on the measured Eh values, yet often presenting large error bars (). After 47 DAT, Eh values reached −100 to −200 mV in all micro plots, suggesting that the plowed soil layers were almost fully reduced as in ordinary paddy fields (Yagi Citation1997). In MF and MI micro plots, the values rose to +400 to +600 mV following midseason drainage. After the midseason drainage, the Eh values remained constant in the MI plot with intermittent irrigation and decreased again in the MF micro plot with flooding and reduction. After final drainage on September 9 (111 DAT), the Eh values measured in the MF plot increased again. The rise in the Eh values of the CF micro plot was slower than that of the MF plot, possibly because water drained slowly as a result of the lack of midseason drainage.
Figure 4 Changes in soil redox potential values (Eh) with days after transplanting. The error bars show the absolute deviation from the mean (n = 2).
Changes in MBP values
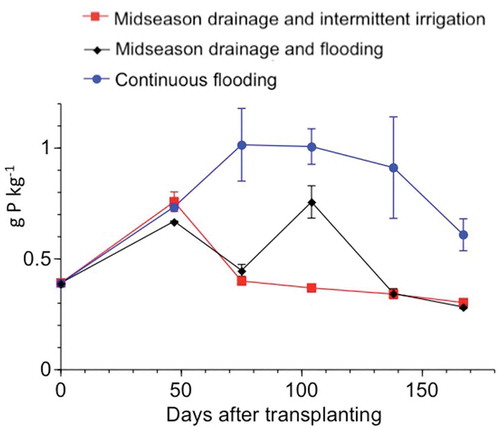
Water management influenced the MBP values measured in the three micro plots (). Because of continuous flooding and reduction of the soil, the values increased to 0.65–0.8 g P kg−1 (47 DAT) in all of the three micro plots. In the CF micro plot, the MBP values remained high until September 2 (104 DAT). In the MF and MI micro plots, the MBP values were low on August 4 (75 DAT) due to the oxidative effect of midseason drainage. On September 2 (104 DAT), an increase in the MBP value was observed in the MF micro plot, and this was related to the low Eh values linked to reducing conditions (). The MBP values in all micro plots tended to decrease after drainage, although the decrease in the MBP value in the CF micro plot was slower than that in the MF and MI plots (), as also reflected through the slow increase in Eh values ().
Figure 5 Changes in modified Bray No. 2 phosphorus (P) values in relation to the number of days after transplanting. The error bars represent the absolute deviation from the mean (n = 2).
Observation of vivianite crystals on rice roots
The observed morphological properties of vivianite crystals resembled those reported by Nanzyo et al. (Citation2010, Citation2013). shows the crystal aggregates formed on thin rice roots from the CF micro plot that were sampled on September 2 (104 DAT). They presented a vivid blue color after air-drying, under an optical microscope. The vivianite crystals were more frequently found on the thin roots than on the thick primary roots (). The abundance of vivianite crystals also varied among roots, possibly because of the age of the roots or because of the localized application of the P fertilizer. Vivianite forms predominantly in and on aged roots because the aboveground sections of the plants provide oxygen to young functioning roots, and they present an iron plaque (Kimura et al. Citation1984). Application of fertilizers in bands (Akahane et al. Citation2006) potentially also influences the location and appearance of vivianite crystals. shows a few roots full of vivianite, most likely because they were at the position where P was applied.
Figure 6 Optical microscope image of rice (Oryza sativa, L.) roots from the micro paddy field (a) with continuous flooding sampled on September 2, 2010 [104 days after transplanting (DAT)], and (b) with midseason drainage and intermittent irrigation on November 4, 2010 (167 DAT).
![Figure 6 Optical microscope image of rice (Oryza sativa, L.) roots from the micro paddy field (a) with continuous flooding sampled on September 2, 2010 [104 days after transplanting (DAT)], and (b) with midseason drainage and intermittent irrigation on November 4, 2010 (167 DAT).](/cms/asset/5eb86e22-feaf-4bf4-a42c-41828482cb7a/tssp_a_1089787_f0006_c.jpg)
shows the SEM image of vivianite crystal aggregates with EDX spectra () of the selected areas i and ii in . The principal elements of the crystal aggregates were Fe and P (–i), and they presented the characteristic atomic ratio of vivianite (Fe/P = 1.5; Harris Citation2002). In contrast, signals from these elements were very weak in the area of rice roots without the crystal aggregates (–ii).
Figure 7 (a) Scanning electron microscope image of vivianite crystals on a rice (Oryza sativa, L.) root, and (b) energy-dispersive X-ray analyses of the selected areas of (i) the dotted square and (ii) the dashed square of Fig. 7a. O: oxygen; P: phosphorus; Fe: iron.
Changes in vivianite content of rice roots
Differential water management also affected the vivianite content on rice roots (). The highest vivianite content was present in the CF micro plot, and tended to increase up to early September when flooding was stopped. Following drainage, the vivianite content decreased again with the oxidation of the plow-layer soil. A slow decrease in the vivianite content of the CF micro plot was detected in September and October, possibly related to slow drainage and slow oxidation due to the lack of midseason drainage. In the MF micro plot, the vivianite content increased to almost the same level as the CF micro plot at 104 DAT (). In the MI plot, the vivianite content was the lowest among the three micro plots. The Eh value in the MI plot with intermittent irrigation tended to be high after the midseason drainage compared with other micro plots (). These observations indicate that vivianite formation is strongly affected by the water management and redox conditions of the plow-layer soil in paddy fields.
Figure 8 Changes in the vivianite content of rice (Oryza sativa, L.) roots in relation to the number of days after transplanting. The error bars represent the absolute deviation from the mean (n = 2). P: phosphorus.
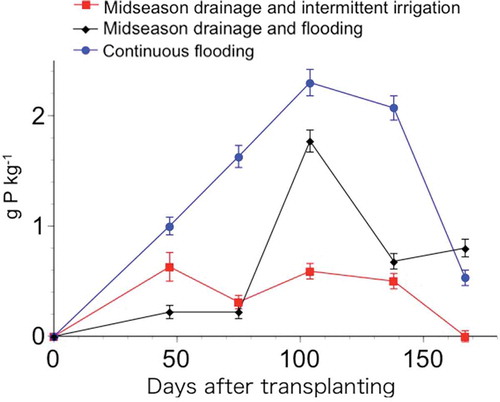
The observed changes in the vivianite content on the rice roots with water management () followed the changes measured for Eh () and MBP values (), suggesting a close interplay among these parameters. According to Lindsay (Citation1979), vivianite dissolution is facilitated by a decrease in ferrous iron and the generation of P sorption sites by the precipitation of ferrihydrite, hydrated iron oxide. Further experimental data would be needed to elucidate the formation and dissolution of vivianite in paddy field bulk soils, as well as the effect of localized P application.
CONCLUSIONS
We here provided experimental evidence on the effectiveness of the method used to estimate the vivianite content of rice roots. Using this method, the vivianite content of rice roots was shown to be significantly susceptible to water management of paddy fields including flooding, midseason drainage, reflooding after the midseason drainage, and drainage at the ripening stage. Vivianite is formed under reducing conditions and dissolves with gradual oxidation of the plow-layer soil in the paddy fields. Vivianite crystals of the rice roots can be observed when the rice roots are sampled from the reduced soil and readily separated from the soil. Changes in the vivianite content of the rice roots were also in relation to those in the MBP values of the plow layer soil.
ACKNOWLEDGMENTS
The authors wish to thank Ms. K. Ito for her assistance in operating the SEM and the EDX apparatus. This work was supported by KAKENHI No. 22658102.
References
- Akahane I, Nanzyo M, Takahashi T, Sekiguchi O, Saigusa M 2006: Spatial distribution of phosphorus in the Ap horizon soils of paddy rice fields after rice harvest – Effect of machinery localized fertilizer application at transplanting of rice seedlings. Jpn. J. Soil Sci. Plant Nutr., 77, 171–177.
- Blakemore LC, Searle PL, Daly BK 1981: Soil Bureau laboratory methods. A method for chemical analysis of soils. N.Z. Soil Bur. Sci. Pep., 10A, revised 1981, A8.1-A8.4, A5.9-A5.10.
- Cultivated soil classification committee 1995: Classification of cultivated soils in Japan third approximation. Miscellaneous publication of the National Institute of Agro-Environmental Sciences, 17 (in Japanese).
- Editorial board of Encyclopaedia Chimica 1964: Iron(II) (Ortho)Phosphate. Encyclopaedia Chimica, 9, pp. 809. Kyoritsu Shuppan, Tokyo (in Japanese).
- Editorial boards of methods for soil environment analysis 1997: Methods for Soil Environment Analysis, 427 pp. Hakuyusha, Tokyo (in Japanese).
- Harris WG 2002: Phosphate Minerals. In Soil Mineralogy with Environmental Applications, SSSA Book Series: 7, Eds. Dixon, JB, Schulze, DG, pp. 637–665. SSSA, Madison, WI.
- Heiberg L, Bender KC, Kjaergaard C, Jensen HS, Hansen HCB 2012: Vivianite precipitation and phosphate sorption following iron reduction in anoxic soils. J. Environ. Qual, 41, 938–949. doi:10.2134/jeq2011.0067
- Iimura K 2005: Cause of the high solubility of phosphorus in submerged paddy soils in comparison to upland soils. Jpn. J. Soil Sci. Plant Nutr., 76, 199–200 (in Japanese).
- Kimura M, Wada H, Takai Y 1984: Studies on the rhizosphere of paddy rice. VIII. Precipitation of ferric hydroxide, manganese oxide, and ferrous sulfide around rice roots. Jpn. J. Soil Sci. Plant Nutr., 55, 332–337 (in Japanese with English summary).
- Kirk G 2004: The Biogeochemistry of Submerged Soils. John Wiley & Sons, New York.
- Konno T, Kobo K 1970: Studies on the transformation of the materials in paddy soils under leaching conditions (Part 2): The behavior of phosphates in paddy soils. Jpn. J. Soil Sci. Plant Nutr., 41, 225–229 (in Japanese with English summary).
- Kyuma K 2004: Paddy Soil Science, pp. 169–178. Kyoto University Press, Kyoto, Japan.
- Lindsay WL 1979: Chemical Equilibria in Soils, pp. 163–209. John Wiley & Sons, New York.
- Murphy J, Riley JP 1962: A modified single solution method for the determination of phosphate in natural waters. Anal. Chim. Acta, 27, 31–36. doi:10.1016/S0003-2670(00)88444-5
- Nanzyo M, Onodera H, Hasegawa E, Ito K, Kanno H 2013: Formation and dissolution of vivianite in paddy field soil. Soil Sci. Soc. Am. J., 77, 1452–1459. doi:10.2136/sssaj2012.0437n
- Nanzyo M, Yaginuma H, Sasaki K, Ito K, Aikawa Y, Kanno H, Takahashi T 2010: Identification of vivianite formed on the root of paddy rice grown in pots. Soil Sci. Plant Nutr., 56, 376–381. doi:10.1111/j.1747-0765.2010.00463.x
- Reddy KM, Wetzel RG, Kadlec RH 2005: Biogeochemistry of phosphorus in wetlands. In Phosphorus: agriculture and the Environment, Eds. Sims, JT, Sharpley, AN, pp. 263–316. ASA-CSSA-SSSA, Madison, WI.
- Rodgers KA, Henderson GS 1986: The thermochemistry of some iron phosphate minerals: vivianite, metavivianite, baraćite, ludlamite and vivianite/metavivianite admixtures. Thermochimica. Acta., 104, 1–12. doi:10.1016/0040-6031(86)85179-6
- Rothe M, Frederichs T, Eder M, Kleeberg A, Hupfer M 2014: Evidence for vivianite formation and its contribution to long-term phosphorus retention in a recent lake sediment: a novel analytical approach. Biogeoscience, 11, 5169–5180. doi:10.5194/bg-11-5169-2014
- Shiga H 1973: Effect of phosphorus fertility of soils and phosphate application on rice culture in cool region. Part 1. Measurement of phosphorus supplying ability of paddy soils. Res. Bull. Hokkaido Natl. Agric. Exp. Stn., 105, 31–49 (in Japanese with English summary).
- Soil Survey Staff 2006: Keys to Soil Taxonomy, 10th edn. ( USDA-NRCS, 2006) Washington, DC.
- Wada H, Miyashita K, Takai Y 1977: Studies on the decomposition process of plant residures in the paddy field. Jpn. J. Soil Sci. Plant Nutr., 48, 166–170 (in Japanese).
- Yagi K 1997: Methane emissions from paddy fields. Bull. Natl. Inst. Agro- Environ. Sci., 14, 96–210.