
ABSTRACT
Reducing ammonia (NH3) volatilization is a practical way to increase nitrogen (N) fertilizer use efficiency (NUE). In this field study, soil was amended once with either cotton (Gossypium hirsutum L.) straw (6 t ha−1) or its biochar (3.7 t ha−1) unfertilized (0 kg N ha−1) or fertilized (450 kg N ha−1), and then soil inorganic N concentration and distribution, NH3 volatilization, cotton yield and NUE were measured during the next two growing seasons. In unfertilized plots, NH3 volatilization losses in the straw-amended and biochar-amended treatments were 38–40% and 42–46%, respectively, less than that in control (i.e., unamended soil) during the two growing seasons. In the fertilized plots, NH3 volatilization losses in the straw-amended and biochar-amended treatments were 30–39% and 43–54%, respectively, less than that in the control. Straw amendment increased inorganic N concentrations, cotton yield, cotton N uptake and NUE during the first cropping season after application, but not during the second. In contrast, biochar increased cotton N uptake and NUE during both the first and the second cropping seasons after application. Furthermore, the effects of biochar on cotton N uptake and NUE were greater in the second year than in the first year. These results indicate that cotton straw and cotton straw biochar can both reduce NH3 volatilization and also increase cotton yield, N uptake and NUE. In addition, the positive effects of one application of cotton straw biochar were more long-lasting than those of cotton straw.
1. Introduction
Nitrogen (N) is an essential plant nutrient and one of the main factors limiting crop productivity. In order to help feed the world’s growing population, N fertilizer use has increased, from 11.6 Tg in 1961 to 100.5 Tg in 2008 (Turner et al. Citation2012). China is the world’s largest producer and consumer of N fertilizer (Wang et al. Citation2011). China has successfully achieved food self-sufficiency for its rapidly growing population (Ma et al. Citation2013); however, soil N losses have become serious in recent decades due to over-fertilization and low N use efficiency (Wang et al. Citation2011). The N use efficiency in China’s farmland ranged from 11 to 49% during 1982–2005 (compared with > 50% in developed countries). Between 29 and 62% of the total N input was lost to the environment (Duan et al. Citation2014). Losses of N from farmland systems occur via leaching, runoff, ammonia (NH3) volatilization, and N2O emission. Lin et al. (Citation2011) reported that in China, 5–34% of fertilizer N was lost via NH3 volatilization, and 6–18% was lost due to NO3 leaching.
The return of crop residue to the soil can increase soil organic carbon (C) (Campbell et al. Citation1991), N mineralization potential (Tu et al. Citation2006), crop yield (Patra et al. Citation1993) and N uptake (Patra et al. Citation1993). Crop residue return can also affect ammonium-nitrogen (NH4-N) concentrations (Qiu et al. Citation2012) which, in turn, directly influence NH3 volatilization (Rochette et al. Citation2009; Taghizadeh-Toosi et al. Citation2012a; Chen et al. Citation2013). However, the effect of straw amendment on NH3 volatilization remains controversial. Some research indicates that straw amendment reduces NH3 volatilization, primarily by decreasing soil NH4-N concentrations (Shahandeh et al. Citation1992; Dong et al. Citation2009). However, Wang et al. (Citation2012) reported that NH3 volatilization in a paddy field was 34.8% higher in a wheat (Triticum aestivum L.) straw-amended treatment than in an unamended treatment.
Biochar is a highly stable, porous material, with a large surface area and high adsorption capacity (Singh et al. Citation2012). Biochar application can affect soil C and N transformations (Clough and Condron Citation2010; Woolf et al. Citation2010), including nitrification rate (Taghizadeh-Toosi et al. Citation2012b). Biochar adsorbs both NH4-N (Lehmann et al. Citation2002) and nitrate-nitrogen (NO3-N) (Mizuta et al. Citation2004); therefore, biochar application to soil can reduce N leaching. Most research indicates that biochar can reduce NH3 volatilization (Steiner et al. Citation2010; Taghizadeh-Toosi et al. Citation2012a). However, Chen et al. (Citation2013) observed that biochar promoted NH3 volatilization at soil pH of 5 and 9. Some research indicates that the adsorption of inorganic N by biochar may reduce N availability to plants (Lehmann et al. Citation2003). However, other studies suggest that biochar promotes crop N uptake by retaining inorganic N in the surface soil (Steiner et al. Citation2007). The effect of biochar on crop yield has been studied widely; however, few studies have considered the effects of biochar for more than 1 year. There is also conflicting information about the immediate effect and the residual effect of biochar on yield. Some researchers report that crop yields increased every year after biochar application (Vaccari et al. Citation2011; Zhang et al. Citation2012). In contrast, Sun et al. (Citation2014) and Tammeorg et al. (Citation2014) observed that biochar has no effect or even negative effects on crop yield. Major et al. (Citation2010) reported that biochar had no effect on maize (Zea mays L.) growth in the first year after application, whereas maize yield significantly increased in the second year.
Inorganic N adsorbed by biochar can continuously desorb and become available for crop uptake. Furthermore, the N adsorption capacity of biochar is greater than that of straw. Therefore, we hypothesized that (1) biochar can reduce NH3 volatilization and promote cotton (Gossypium hirsutum L.) N uptake, and (2) these beneficial effects of biochar amendment will be greater than those of straw amendment. Our objective was to learn more about what happens to soil N dynamics and crop growth during the first 2 years after amendment with cotton biochar. The information obtained from this study could be used to identify an economical and environmentally friendly means of managing cotton residue.
2. Materials and methods
2.1. Site description
This field experiment was conducted during the 2013 and 2014 cotton growing seasons at an agricultural experiment station near Shihezi University, Xinjiang Province, China (44°18′N, 86°02′E). Shihezi is a large (457 km2) oasis in northwest Xinjiang Province. About two thirds of the region’s cultivated land is used for cotton production. The region is classified as a temperate arid zone with a continental climate. The daily mean temperature and rainfall during the 2013 and 2014 cotton growing seasons are shown in .
Figure 1. Daily mean temperatures and rainfall during the cotton (Gossypium hirsutum L.) growing season in 2013 and 2014.
The soil at the site is an alluvial, gray desert soil according to the Chinese classification system, and a Calcareous Fluvisol according to the Food and Agriculture Organization-United Nations Educational, Scientific and Cultural Organization (FAO-UNESCO) classification system. The soil texture is loam. Some chemical properties of the soil at the beginning of the study were as follows: pH 7.98, 5.46 g kg−1 organic C, 0.89 g kg−1 total N, 36.8 mg kg−1 available N, 27.4 mg kg−1 available phosphorus (P), 284 mg kg−1 available potassium (K), 1.72 mg kg−1 NH4-N, and 6.87 mg kg−1 NO3-N.
2.2. Cotton straw and biochar production
Cotton straw was collected from a local field. The straw contained 385 g kg−1 organic C, 1.6 g kg−1 total N and 6.00 g kg−1 total K. The biochar was produced by cotton straw at a pyrolysis temperature of 450°C in a low-oxygen environment for 6 h (the yield efficiency of biochar form cotton straw is 37.5% on a bone-dry weight basis). The biochar had high concentrations of total C (625 g kg−1) and total K (8.60 g kg−1), but low concentrations of total N (0.89 g kg−1). The cotton straw and biochar were dried in an oven at 75°C and then separately passed through a 2-mm sieve.
2.3. Experimental design
The study consisted of a 3 × 2 factorial design with three soil treatments and two N application rates. The three soil treatments were (1) no amendment (CK), (2) cotton straw amendment (ST, 6 t ha−1), and (3) biochar amendment (BC, 3.7 t ha−1). The amount of C applied in the straw treatment was equivalent to that in the biochar treatment. The two N application rates were 0 and 450 kg N ha−1 (N0 and N450, respectively). In order to study the immediate effect of cotton straw and biochar the first year after application and the residual effect the second year on NH3 volatilization and cotton yield, cotton straw and biochar were applied only once before planting in 2013. The cotton straw and biochar were spread onto their respective plots and then mixed into the 0–20 cm depth with a spade. A similar experimental design was used to study the effect of a single biochar application on soil for 4 years in Columbia (Major et al. Citation2010).
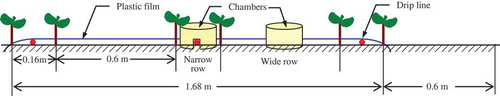
The six treatments were replicated 3 times in a factorial randomized complete block design. In each plot, there were two 1.68 m × 15 m beds, with a 0.6-m separation distance (). Six rows of cotton plants were planted in each bed, with a row space of 0.16 m (narrow row) or 0.60 m (wide row) and the soil surface was covered with plastic film. The plastic film was held in place by burying the edges with soil. The drip irrigation lines were installed in a narrow row under the plastic film. Cotton (cv. Xinluzao No. 52) was sown through holes in the plastic film mulch on 10 April 2013 and on 26 April 2014. The cotton plants were sown at 0.1-m intervals within each row to obtain a population of 263,000 plants ha−1. This planting pattern is commonly used for drip irrigated cotton in the region. Water was applied by drip irrigation at a rate of 2.5 L h−1 per emitter. The emitters were 0.4 m apart. A flow meter was installed in each plot to control the irrigation amount. The plots were all drip-irrigated with 30 mm of water at sowing to improve germination and seedling establishment. The plots were irrigated 9 times between June and August. A total of 450 mm of irrigation water was applied during each growing season. These irrigation practices are similar to those used by local farmers. The plots were all irrigated on the same dates and with equal amounts of water. In the N450 treatment, 90 kg N ha−1 (urea) was applied at sowing. The remaining 360 kg N ha−1 was dissolved in a tank and applied through the drip irrigation system in five equal amounts at the second, third, fourth, fifth and sixth irrigation events in both 2013 and 2014 after planting. All of the plots were fertilized with 105 kg phosphorus pentoxide (P2O5) ha−1 and 60 kg potassium oxide (K2O) ha−1 before sowing.
Figure 2. Layout of the experimental plot (narrow row and wide row) and the location of the sampling chambers.
2.4. Sampling and analysis
2.4.1. Ammonia volatilization
Changes in NH3 volatilization across the growing season were measured by collecting gas samples 15 times between sowing and harvest. The samples were collected more frequently immediately after fertilization and then less frequently later on. Specifically, samples were collected every 7 d for 6 weeks after the initial N application at sowing. Samples were then collected every 14 d from weeks 7 to 10 after sowing. Fertigation was conducted every 7 d during the next 5 weeks (beginning of week 11 to week 15). The NH3 volatilization samples were collected every 7 d during this period and then every 14 d for 4 weeks. Temporal changes in NH3 volatilization after fertigation were determined by collecting gas samples each day during the third, fourth and fifth fertigation cycles.
Ammonia volatilization was measured using a closed chamber technique. Each chamber had an evaporating dish containing 20 ml 0.1 M sulfuric acid (H2SO4). The trap was positioned 7 cm above the soil surface in an iron frame. A polyvinyl chloride tube (15 cm diameter, 10 cm high, sealed at one end) was placed over each trap. There were two chambers at each sampling point. One chamber was placed in the center of a narrow row (directly over the drip irrigation emitter). The other chamber was placed in the center of a wide row (). The plastic film mulch had been removed from the soil surface. The open end of the tube was inserted to about 2 cm below the soil surface. Three groups of collection chambers were used in each plot. The NH4-N in the trap solution was analyzed using an Auto-Discrete Analyzer System (Smartchem 140, AMS Company, Italy). The data of the narrow row and wide row were averaged to calculate the rate of NH3 volatilization and the data were added to calculate the amount of NH3 volatilization (Li et al. Citation2015; Chirinda et al. Citation2011).
2.4.2. Soil
Soil samples were collected 15 times during each cotton growing season according to the NH3 volatilization sampling schedule. Soil samples were collected from the 0–20 and 20–40 cm depths at three locations (narrow row, inter-cotton and wide row) per plot using a stainless steel auger (5-cm diameter). Three samples were collected from each of the locations and then combined to form one composite sample per location per plot. The fresh soil samples were put into a plastic valve bag and taken to the laboratory immediately. Each soil sample was divided into two subsamples. One subsample was immediately analyzed to determine soil water content, NH4-N concentration and NO3-N concentration. The other subsample was air-dried at room temperature and passed through a 1-mm sieve. The pH of this sample was determined with a DMP-2 mV/pH meter using a soil/water ratio of 1:2.5 (weight/volume). Soil water content was determined gravimetrically by drying at 105°C. The NH4-N and NO3-N concentrations were determined after extracting 5 g of soil (dry weight equivalent) with 50 ml of 2 M potassium chloride (KCl) solution in Falcon tubes (Chen et al. Citation2013). NH4-N and NO3-N concentrations in the extracts were measured using an Auto-Discrete Analyzer System (Smartchem 140, AMS Company, Italy).
2.4.3. Plants
Above-ground biomass was measured when the cotton plants reached the boll stage (20 August 2013 and 10 August 2014). The cotton plants were collected from a 22.8-m2 area in each plot that was reserved for measuring biomass. The plots were cut off at the soil surface and then separated into leaves, stems and bolls. The samples were dried in an oven at 75°C, weighed, ground to pass through a 1-mm sieve, and then digested with concentrated sulfuric acid-hydrogen peroxide (H2SO4-H2O2) before elemental analysis. Nitrogen concentrations were measured using an Auto-Kjeldal system (B-339, Buchi Labortechnik AG, Switzerland). Each measurement was made in triplicate. Seed cotton yield was determined by harvesting a 22.8-m2 area (2 beds × 2.28 m wide × 5 m long) in each plot that had not been disturbed by soil or plant sampling. The seed cotton was harvested by hand on 20 September in 2013 and 16 September in 2014, and then weighed.
2.4.4. Nitrogen fertilizer use efficiency
Nitrogen fertilizer use efficiency (NUE) was calculated as follows:
NUE = [Total N uptake of cotton shoots in the N fertilized plot (kg ha−1) – Total N uptake of cotton shoots in the unfertilized plot (kg ha−1)] /[Total N applied (kg)]
2.5. Data analyses
The data were analyzed using SPSS software v. 21.0 with a two-way analysis of variance (ANOVA) at a significance level of 0.05. The soil treatments and N application rate were the independent variables. Multiple comparison analyses were conducted to examine the effects of soil treatment and N application rate. The means of the main effects were separated by least significant difference (LSD) (p < 0.05).
3. Results
3.1. Soil pH
Soil pH in the N0 plots remained steady during both the 2013 and 2014 growing seasons (). In comparison, soil pH declined with each successive fertigation in the N450 plots in both growing seasons. There was no significant difference in soil pH among the CK, ST and BC treatments.
Figure 3. Soil pH in the 0–20 cm depth as affected by soil treatment and nitrogen (N) application in (a) 2013 and (b) 2014. ‘ ![]()
3.2. NH4-N concentration
Soil amendment and N application significantly affected NH4-N concentration (). In the N0 plots, there was no significant difference in soil NH4-N concentration among ST, BC and CK either in 2013 or in 2014. However, in the N450 plots, soil NH4-N concentrations were significantly greater in BC than in either ST or CK. Soil NH4-N concentrations tended to be greater in ST than in CK; however, the differences were not significant.
Figure 4. Soil ammonium-nitrogen (NH4-N) concentrations in the 0–20 and 20–40 cm depths as affected by soil treatment and nitrogen (N) application in (a) 2013 and (b) 2014. ‘ ![]()
3.3. NO3-N concentration
Soil NO3-N concentrations were significantly affected by soil amendment (). In the N0 plots, there was no significant difference in soil NO3-N concentration among ST, BC, and CK either in 2013 or in 2014. In the N450 plots, NO3-N concentrations in the 0–20 cm depth were significantly greater in ST and BC than in CK in both growing seasons. There was no significant difference in soil NO3-N concentration between BC and ST in the N450 plots in 2013. However, in 2014, soil NO3-N concentrations were significantly greater in BC than in ST.
Figure 5. Soil nitrate-nitrogen (NO3-N) concentrations in the 0–20 and 20–40 cm depths as affected by soil treatment and nitrogen (N) application in (a) 2013 and (b) 2014. ‘ ![]()
3.4. Ammonia volatilization rate
Soil treatment had significant effects on NH3 volatilization rate (). Ammonia volatilization rate generally decreased in the order CK > ST > BC in 2013 and in 2014 in both the N0 and N450 plots. Averaged across N0 and N450 plots, NH3 volatilization rates in ST and BC were, respectively, 35~37% and 43~56% less than that in CK in 2013. In 2014, NH3 volatilization rates in ST and BC were, respectively, 35~42% and 47~50% less than that in CK. The mean NH3 volatilization rates were 158% greater in the N450 plots than in the N0 plots in 2013 and 120% greater in 2014.
Figure 6. Temporal changes in ammonia (NH3) volatilization rate during the (a) 2013 and (b) 2014 growing season as affected by soil treatment and nitrogen (N) application. ‘ ![]()
Temporal changes in NH3 volatilization after fertigation () were measured during the third, fourth and fifth fertigation cycles in 2013 (i.e., the first growing season after amendment with cotton straw or its biochar). These sample dates were chosen because factors affecting soil N transformation (e.g., microbial populations and enzyme activities) would have stabilized by this time in the growing season. In the N0 plots, there was no obvious peak in NH3 volatilization after irrigation. In the N450 plots, NH3 volatilization was greatest on the second day after fertigation in both CK and BC; the NH3 volatilization of ST also was greatest on the second day after the second and third fertigation, but was greatest on the first day after the first fertigation. Furthermore, NH3 volatilization during the first 2 d after fertigation accounted for an average of 54% of the total volatilization during each 7-d fertigation cycle in the N450 plots.
Figure 7. Temporal changes in ammonia (NH3) volatilization rate during the first 7 d after the (a) third, (b) fourth and (c) fifth irrigation or fertigation in 2013. Error bars represent the standard error (SE; n = 3). Abbreviations: N0, no N fertilizer; N450, 450 kg N ha−1; CK, no amendment; ST, cotton (Gossypium hirsutum L.) straw amendment; BC, biochar amendment.
3.5. Ammonia volatilization
Soil treatment, N application and their interaction effects on total NH3 volatilization are summarized in . Total NH3 volatilization was significantly greater in CK than in ST and BC in both years and in both N0 and N450 plots. Total NH3 volatilization was significantly greater in ST than in BC in the N450 plots, but not in the N0 plots. Nitrogen application significantly increased NH3 volatilization. In the N450 plots, NH3 volatilization in BC was 54% less than that in CK and 25% less than that in ST in 2013. In 2014, NH3 volatilization in BC was 43% less than that in CK and 18% less than that in ST.
Figure 8. Total ammonia (NH3) volatilization during the 2013 and 2014 growing seasons as affected by soil treatment and nitrogen (N) application. Error bars represent standard error (SE; n = 3). Within the same year, bars with different letters are significantly different at P < 0.05. Abbreviations: N0, no N fertilizer; N450, 450 kg N ha−1; CK, no amendment; ST, cotton (Gossypium hirsutum L.) straw amendment; BC, biochar amendment.
3.6. N uptake
In 2013, total N uptake decreased in the order ST, BC > CK in the N0 plots and in the order BC > ST > CK in the N450 plots (). In 2014, total N uptake decreased in the order BC > ST, CK in the N0 treatments and in the order BC > ST > CK in the N450 treatments.
Table 1. Cotton nitrogen (N) uptake as affected by soil treatment and N application in 2013 and 2014. Abbreviations: N0, 0 kg N ha−1; N450, 450 kg N ha−1; CK, no amendment; ST, cotton (Gossypium hirsutum L.) straw amendment; BC, biochar amendment.
3.7. Yield
Cotton yields in 2013 were significantly affected by soil treatment and N application; however, the interaction effects were not significant (). In 2013, seed cotton yield was greatest in ST. Yields were not significantly different in the BC and CK treatments. In 2014, seed cotton yield was significantly greatest in BC, followed by ST and then CK. Boll number was closely related to the differences in yield. In 2013, boll numbers in ST were 12.5% greater than those in BC and 9.3% greater than those in CK. In 2014, boll numbers in BC were 6.4% greater than those in ST and 17.6% greater than those in CK. Application of N fertilizer increased seed cotton yield by an average of 80% in 2013 and 107% in 2014. Boll numbers were 56 to 64% greater in the N450 plots than in the N0 plots. Similarly, boll weights were 10 to 33% greater in the N450 plots than in the N0 plots.
Table 2. Cotton yield as affected by soil treatment and nitrogen (N) application in 2013 and 2014. Abbreviations: N0, 0 kg N ha−1; N450, 450 kg N ha−1; CK, no amendment; ST, cotton (Gossypium hirsutum L.) straw amendment; BC, biochar amendment.
3.8. Nitrogen fertilizer use efficiency
The effects of soil treatment on N fertilizer use efficiency are summarized in . In 2013, NUE in BC was 16% greater than that in ST and 43% greater than that in CK. The NUE in ST was 24% greater than that in CK. In 2014, NUE in BC was 13% greater than that in ST and CK. The difference in NUE between ST and CK was not significant.
Figure 9. Nitrogen fertilizer use efficiency (NUE) in 2013 and 2014 as affected by soil treatment and nitrogen (N) application. Error bars represent standard error (SE; n = 3). Within the same year, bars with different letters are significantly different at P < 0.05. Abbreviations: CK, no amendment; ST, cotton (Gossypium hirsutum L.) straw amendment; BC, biochar amendment.
4. Discussion
Soil pH is one of the main factors affecting NH3 volatilization. Soil pH in the N450 plot declined with successive fertigation because of the nitrification of NH4-N which mineralized from urea (Thomson et al. Citation1993). Soil NH4-N concentration directly influences NH3 volatilization (Rochette et al. Citation2009; Taghizadeh-Toosi et al. Citation2012b; Chen et al. Citation2013). Soil NH4-N concentrations significantly increased after fertigation in 2013 and 2014 (). Soil NH3 volatilization did not increase rapidly after the first fertigation (70–77 d after planting) in 2013 (), possibly because soil inorganic N concentrations were quite low before the first fertigation. Most of the N would be held by the soil ( and ) and taken up by the cotton after the first fertigation. Relatively little N would be lost via NH3 volatilization. Our research showed that NH3 volatilization was less in ST and BC than in the CK, even though NH4-N concentration was greater in BC than in CK. Several researchers have reported that biochar application significantly reduced NH3 volatilization (Steiner et al. Citation2010; Taghizadeh-Toosi et al. Citation2012a). Because of its huge surface area and strong cation exchange capacity, biochar adsorbs NH4-N and NH3 (Knowles et al. Citation2011). Dong et al. (Citation2009) suggested that straw application reduced NH3 volatilization by enhancing nitrification. Straw incorporation also increases soil total porosity and aggregate formation (Zhang et al. Citation2014). These changes improve soil aeration, which in turn promotes nitrification (). Thus, NH3 volatilization was less in ST than in CK, even though only a small proportion of cotton straw would have still been in the soil in 2014. Eghball et al. (Citation2003) also showed that 4 years after the last organic fertilizer application, the residual effects still exist.
In this study, NH3 volatilization rates were highest during the first 2 d after fertigation (). Our result is similar to that of Rochette et al. (Citation2009), who reported that NH3 volatilization reached a maximum within 3 h after urea application and remained high for the next 48 h. It is possible that fluctuating moisture conditions in this drip-irrigated soil had a priming effect on NH3 volatilization. In addition, the urea was applied as a solution through the drip irrigation system. This may have facilitated the rapid mineralization of the urea. Our research showed that NH3 volatilization was significantly less in BC than in ST.
Nitrogen uptake and yield was significantly greater in ST than in CK in the first year after cotton straw application ( and ). This is probably because ST increased soil inorganic N compared with CK ( and ). Several researchers have reported that straw application increased N uptake (Takahashi et al. Citation2003) and crop yield (Tan et al. Citation2007). In the second year, there was no significant difference in yield between ST and CK. This was due to the fact that most of the straw probably decomposed during the first year of the study. Many studies have shown that biochar application can increase net primary crop production, grain yield (Chan et al. Citation2008; Chan and Xu Citation2009; Alburquerque et al. Citation2013), and N uptake (Chan et al. Citation2007, Citation2008) by increasing soil inorganic N and organic carbon concentrations. However, only a small number of these studies measured the effects of biochar for two or more years. Steiner et al. (Citation2007) reported that the cumulative yield of rice (Oryza sativa L.) and sorghum (Sorghum bicolor L.) increased about 75% during four harvests over 2 years. Major et al. (Citation2010) reported that biochar application had no significant effect on maize yield in the first year after application, but increased maize yields during the next 3 years by 28–140%. This indicates that the benefits of biochar application to soil can increase over time. Our study showed that in 2 years after application, BC significantly increased N uptake compared with CK (). BC also improved the open boll number of each cotton plant to increase cotton yield in the second year, but there was no significant difference between BC and CK in the first year (). This was probably because BC promoted cotton growing and delayed boll opening by increasing N uptake, which made the chilling injury of BC more serious than other treatments in the air temperature-dropping process at the boll stage (123–129 d after planting) during the first year (). So the number of open bolls decreased at harvest in BC, which led to the yield of cotton decreasing. Saarnio et al. (Citation2013) showed that biochar significantly increased plant N uptake during the first year after application; however, there was no significant difference in harvested biomass between the BC and CK treatments.
NUE increased in the order CK < ST < BC in the first year after cotton straw and biochar were applied to soil (). In the second year after application, BC, but not ST, significantly increased NUE compared with CK. The improvement in NUE can be mainly attributed to increased inorganic N concentrations in the 0–40 cm depth ( and ). Lehmann et al. (Citation2002) and Asai et al. (Citation2009) also observed that biochar application significantly increased NUE in soil by increasing soil inorganic N concentration. Straw application also can improve soil available N content (Dharani et al. Citation1992), which is beneficial to NUE.
5. Conclusions
Cotton N uptake and NH3 volatilization were closely associated with inorganic N concentration. As expected, biochar increased NH4-N and NO3-N concentrations in soil. Cotton straw and its biochar reduced NH3 volatilization. Cotton straw biochar reduced NH3 volatilization by 43–54% and increased cotton N uptake by 25–93%. Furthermore, the beneficial effects of biochar amendment were greater than those of straw amendment, especially in the second year after application.
Acknowledgments
This work was funded by the National Natural Science Foundation of China (31160415) and the Innovative Research Foundation for Excellent Young Scientists of Xinjiang Production and Construction Corps, China (2014CD002).
Supplemental data
Supplemental data for this article can be accessed here.
References
- Alburquerque JJ, Salazar P, Barron S, Torrent J, Campillo MC, Gallardo A, Villar R 2013: Enhanced wheat yield by biochar addition under different mineral fertilization levels. Agron. Sustain. Dev., 33, 475–484. doi:10.1007/s13593-012-0128-3
- Asai H, Samson BK, Stephan HM, Songyikhangsuthor K, Kiyono Y, Inoue Y, Shiraiwa T, Horie T 2009: Biochar amendment techniques for upland rice production in Northern Laos 1: soil physical propreties, leaf SPAD and grain yield. Field Crop. Res., 111, 81–84. doi:10.1016/j.fcr.2008.10.008
- Campbell CA, Lafon GP, Zentner RP, Biederbeck VO 1991: Influence of fertilizer and straw baling on soil organic matter in a thin black chernozem in western Canada. Soil Biol. Biochem., 23, 443–446. doi:10.1016/0038-0717(91)90007-7
- Chan KL, Xu ZH 2009: Biochar: nutrient properties and their enhancement. Earthscan, Book Chapter, 5, 67–84.
- Chan KY, Zwieten LV, Meszaros I, Downie A, Joseph S 2007: Agronomic values of greenwaste biochar as a soil amendment. Aust. J. Soil Res., 45, 629–634. doi:10.1071/SR07109
- Chan KY, Zwieten LV, Meszaros I, Downie A, Joseph S 2008: Using poultry litter biochars as soil amendments. Aust. J. Soil Res., 46, 437–444. doi:10.1071/SR08036
- Chen CR, Phillips IR, Condron LM, Goloran J, Xu ZH, Chan KY 2013: Impacts of greenwaste biochar on NH3 volatilization from bauxite processing residue sand. Plant Soil, 367, 301–312. doi:10.1007/s11104-012-1468-0
- Chirinda N, Kracher D, Laegdsmand M, Porter JR, Olesen JE, Petersen BM, Doltra J, Kiese R, Butterbach-bahl K 2011: Simulating soil N2O emission and heterotrophic CO2 respiration in arable systems using FASSET and MoBiLE-DNDC. Plant Soil, 343, 139–160. doi:10.1007/s11104-010-0596-7
- Clough TJ, Condron LM 2010: Biochar and the nitrogen cycle: introduction. J. Environ. Qual., 39, 1218–1223. doi:10.2134/jeq2010.0204
- Dharani DP, Sukhpal CB, Ajay M 1992: Effect of plant residues on the size of microbial biomass and nitrogen mineralization in soil incorporation of cowpea and wheat straw. Soil Sci. Plant Nutr., 38, 1–6. doi:10.1080/00380768.1992.10416945
- Dong WX, Hu CS, Zhang YM, Cui JF 2009: Ammonia volatilization from urea incorporation with wheat and maize straw on a loamy soil in China. The Proceedings of the International Plant Nutrition Colloquium XVI.
- Duan YH, Shi XJ, Li SL, Sun XF, He XH 2014: Nitrogen use efficiency as affected by phosphorus and potassium in long-term rice and wheat experiments. J. Integr. Agr., 13, 588–596. doi:10.1016/S2095-3119(13)60716-9
- Eghball B, Ginting D, Gilley JE 2003: Residual effects of manure and compost applications on corn production and soil properties. Agron. J., 96, 442–447. doi:10.2134/agronj2004.0442
- Knowles OA, Robinson BH, Contangelo A, Clucas L 2011: Biochar for the mitigation of nitrate leaching from soil amended with biosolids. Sci. Total Environ., 409, 3206–3210. doi:10.1016/j.scitotenv.2011.05.011
- Lehmann J, Silva J, Steiner C, Nehls T 2003: Nutrient availability and leaching in an archaeological Anthrosol and a Ferralsol of the Central Amazon basin: fertilizer, manure and charcoal amendments. Plant Soil, 249, 343–357. doi:10.1023/A:1022833116184
- Lehmann J, Silva JJ, Rondon M 2002: Slash-and-char - a feasible alternative for soil fertility management in the central Amazon? Proc. 17th World Congr. Soil Sci., 13, 1–12.
- Li YK, Li B, Guo WZ, Wu XP 2015: Effects of nitrogen application on soil nitrification and denitrification rates and N2O emissions in Greenhouse. J. Agr. Sci. Tech., 17, 519–530.
- Lin L, Hu KL, Li GD, Wang HY 2011: Evaluation of nitrogen loss way in summer maize system under different fertilizer N managements. Environ. Sci., 32, 2617–2624. in Chinese.
- Ma L, Zhang WF, Ma WQ, Velthof GL, Oenema O, Zhang FS 2013: An analysis of developments and challenges in nutrient management in China. J. Environ. Qual., 42, 951–961. doi:10.2134/jeq2012.0459
- Major J, Rondon M, Molina D, Riha SJ, Lehmann J 2010: Maize yield and nutrition during 4 years after biochar application to a Colombian savanna oxisol. Plant Soil, 333, 117–128. doi:10.1007/s11104-010-0327-0
- Mizuta K, Matsumoto T, Hatate Y, Nishihara K, Nakanishi T 2004: Removal of nitratenitrogen from drinking water using bamboo powder charcoal. Bioresource Technol., 95, 255–257. doi:10.1016/j.biortech.2004.02.015
- Patra DD, Muni R, Singh DV 1993: Influence of straw mulching on fertilizer nitrogen use efficiency, moisture conservation and herb and essential oil yield in Japanese mint (Mentha arvensis L.). Nutr. Cycl. Agroecosys., 34, 135–139.
- Qiu SJ, Peng PQ, Li L, He P, Liu Q, Wu JS, Christie P, Ju XT 2012: Effects of applied urea and straw on various nitrogen fractions in two Chinese paddy soils with differing clay mineralogy. Biol. Fert. Soils, 48, 161–172. doi:10.1007/s00374-011-0613-x
- Rochette P, Angers DA, Chantigny MH, Macdonald JD, Gasser MO, Bertrand N 2009: Reducing NH3 volatilization in a no-till soil by incorporating urea and pig slurry in shallow bands. Nutr. Cycl. Agroecosys., 84, 71–80. doi:10.1007/s10705-008-9227-6
- Saarnio S, Heimonen K, Kettunen R 2013: Biochar addition indirectly affects N2O emissions via soil soil moisture and plant N uptake. Soil Biol. Biochem., 58, 99–106. doi:10.1016/j.soilbio.2012.10.035
- Shahandeh H, Cabrera ML, Sumner ME 1992: Ammonia volatilization from urea, ammonium sulfate and NutraSweet sludge in bare and straw-covered soils. Commun. Soil Sci. Plan., 23, 775–786. doi:10.1080/00103629209368627
- Singh BP, Cowie AL, Smernik RJ 2012: Biochar carbon stability in a clayey soil as a function of feedstock and pyrolysis temperature. Environ. Sci. Technol., 21, 11770–11778. doi:10.1021/es302545b
- Steiner C, Das KC, Melear N, Lakly D 2010: Reducing nitrogen loss during poultry litter composting using biochar. J. Environ. Qual., 39, 1236–1242. doi:10.2134/jeq2009.0337
- Steiner C, Teixeira WG, Lehmann J, Nehls T, Macedo JLV, Blum WEH, Zech W 2007: Long term effects of manure, charcoal, and mineral fertilization on crop production and fertility on a highly weathered Central Amazonian upland soil. Plant Soil, 291, 275–290. doi:10.1007/s11104-007-9193-9
- Sun ZC, Bruun EW, Arthur E, Jonge LW, Moldrup P, Hauggaard-Nielsen H, Elsgaard L 2014: Effect of biochar on aerobic processes, enzyme activity, and crop yield in two sandy loam soils. Biol. Fertil. Soils, 50, 1087–1097. doi:10.1007/s00374-014-0928-5
- Taghizadeh-Toosi A, Clough TJ, Sherlock RR, Condron LM 2012a: A wood based low-temperature biochar captures captures NH3-N generated from ruminant urine-N, retaining its bioavailability. Plant Soil, 353, 73–84. doi:10.1007/s11104-011-1010-9
- Taghizadeh-Toosi A, Clough TJ, Sherlock RR, Condron LM 2012b: Biochar adsorbed NH3 is bioavailable. Plant Soil, 350, 57–69. doi:10.1007/s11104-011-0870-3
- Takahashi S, Uenosono S, Ono S 2003: Short- and long-term effects of rice straw application on nitrogen uptake by crops and nitrogen mineralization under flooded and upland conditions. Plant Soil, 251, 291–301. doi:10.1023/A:1023006304935
- Tammeorg P, Simojoki A, Makela P, Stoddard FL, Alakukku L, Helenius J 2014: Biochar application to a fertile sandy clay loam in boreal conditions: effects on soil properties and yield formation of wheat, turnip rape and faba bean. Plant Soil, 374, 89–107. doi:10.1007/s11104-013-1851-5
- Tan DS, Jin JY, Huang SW, Li ST, He P 2007: Effect of long-term application of K fertilizer and wheat straw to soil on crop yield and soil K under different planting systems. Agr. Sci. China, 6, 200–207. doi:10.1016/S1671-2927(07)60035-2
- Thomson CJ, Marschner H, Romheld V 1993: Effect of nitrogen fertilizer form on pH of the bulk soil and rhizosphehe, and on the growth, phosphorus, and micronutrient uptake of bean. J. Plant Nutr., 16, 493–506. doi:10.1080/01904169309364548
- Tu C, Ristaino JB, Hu SJ 2006: Soil microbial biomass and activity in organic tomato farming system: effects of organic inputs and straw mulching. Soil Biol. Biochem., 38, 247–255. doi:10.1016/j.soilbio.2005.05.002
- Turner DA, Edis RE, Chen D, Freney JR, Denmead OT 2012: Ammonia volatilization from nitrogen fertilizers applied to cereals in two cropping areas of southern Australia. Nutr. Cycl. Agroecosys., 93, 113–126. doi:10.1007/s10705-012-9504-2
- Vaccari FP, Baronti S, Lugato E, Genesio L, Castaldi S, Fornasier F, Miglietta F 2011: Biochar as a strategy to sequester carbon and increase yield in durum wheat. Eur. J. Agron., 34, 231–238. doi:10.1016/j.eja.2011.01.006
- Wang J, Wang DJ, Zhang G, Wang C 2012: Effect of wheat straw application on NH3 volatilization from urea applied to a paddy field. Nutr. Cycl. Agroecosys., 94, 73–84. doi:10.1007/s10705-012-9527-8
- Wang X, Cai D, Hoogmoedc WB, Oenema O 2011: Regional distribution of nitrogen fertilizer use and N-saving potential for improvement of food production and nitrogen use efficiency in China. J. Sci. Food Ag., 91, 2013–2023. doi:10.1002/jsfa.4413
- Woolf D, Amonette JE, Stree-Perrott FA, Lehmann J, Joseph S 2010: Sustainable biochar to mitigate global climate change. Nat. Commun., 1, 1–9. doi:10.1038/ncomms1053
- Zhang AF, Bian RJ, Pan GX et al. 2012: Effects of biochar amendment on soil quality, crop yield and greenhouse gas emission in a Chinese rice paddy: A field study of 2 consecutive rice growing cycles. Field Crops Res., 127, 153–160. doi:10.1016/j.fcr.2011.11.020
- Zhang P, Wei T, Jia ZK, Han QF, Ren XL 2014: Soil aggregate and crop yield changes with different rates of straw incorporation in semiarid areas of northwest China. Geoderma, 230-231, 41–49. doi:10.1016/j.geoderma.2014.04.007