
ABSTRACT
We evaluated the effect of long-term application of organic matter on soil organic carbon (SOC), and physico-chemical properties of different types of Andosols in the cool temperate zone. In 2012, a soil survey was conducted in 34 fields in Toya, Hokkaido, Japan, using reference data collected from 2001 to 2003 in the same fields. The region contains three groups of soil series (K1, K2 and HO), with soils of K1 (Vitric Andosols) being strongly affected by newly (1769–2000) erupted volcanic ash compared with K2 and HO (Silandic Andosols). The mean application rate of organic matter was 1.45 ± 1.27 Mg carbon (C) ha−1 yr−1. Mean SOC contents in 2001–2003 and 2012 were 26.5 ± 8.1 and 25.7 ± 5.7 g C kg−1, respectively, and mean SOC stocks were 39.6 ± 10.2 and 37.9 ± 7.4 Mg C ha−1 0.15 m−1, respectively. There were no significant differences in either SOC content or stock. However, the rate of change in SOC between 2001–2003 and 2012 (ΔSOC) was significantly higher in K1 than in K2, and SOC decreased significantly in K2. There was a significant negative correlation between initial SOC and rate of ΔSOC: rate of ΔSOC content (g C kg−1 yr−1) = −0.046 × Initial SOC content (g C kg−1) + 1.12 and rate of ΔSOC stock (Mg C ha−1 0.15 m−1 yr−1) = −0.052 × Initial SOC stock (Mg C ha−1 0.15 m−1) + 2.09. The thresholds of initial SOC content and stock (intercept at the x-axis) were calculated as 24.3 g C kg−1 and 36.1 Mg C ha−1 0.15 m−1, respectively. These values were higher than those obtained in previous studies conducted in croplands probably because of the specific features of Andosols. ΔSOC content was significantly negatively correlated with Δbulk density, Δavailable phosporus and base saturation, but positively correlated with Δtotal porosity, Δphosphate absorption coefficient and cation exchange capacity. These findings indicate that application of organic matter increases SOC and improves soil fertility when the initial SOC is lower than the threshold, and highlight the difficulties in maintaining or accumulating SOC in Andosols because of the high SOC.
1. Introduction
The amount of carbon (C) stored in the top 1 m of soil (1500 Pg C) is approximately 3 times that stored in the aboveground biomass, and twice that present as carbon dioxide (CO2) in the atmosphere (Jobbágy and Jackson Citation2000; Janzen Citation2004). Therefore, changes in soil organic carbon (SOC) stock have a considerable influence on atmospheric CO2 concentrations. The IPCC (Citation2013) estimated a 33% contribution of land-use change to anthropogenic global carbon emissions (180 Gt C was emitted from 1750 to 2011). Although the change in SOC stock is likely to be one of the causes of these C emissions, the exact rate remains unclear. Bellamy et al. (Citation2005) reported that in all land use in England and Wales, SOC was lost at a mean rate of 0.6% yr−1 (relative to the existing soil carbon content) from 1973 to 2003. They also found a significant linear relationship between the rate of change in SOC and the initial SOC content (1973), indicating that the losses occurred in soils with SOC greater than a threshold level. Moreover, several researchers have reported a decrease in SOC in temperate and cool temperate zones, such as England and Wales, South Norway, France, Finland, and South Germany (Lark et al. Citation2006; Riley and Bakkegard Citation2006; Saby et al. Citation2008; Capriel Citation2013; Heikkinen et al. Citation2013). Significant negative correlations between initial SOC content and the rate of change in SOC content have also been reported in similar zones in South Norway, South Belgium, France, the Netherlands, and South Germany (Riley and Bakkegard Citation2006; Goidts and van Wesemael Citation2007; Saby et al. Citation2008; Hanegraaf et al. Citation2009; Capriel Citation2013). These studies provided no information on soil types; moreover, there have been no studies that have focused on SOC in volcanic soils such as Andosols.
Although Andosols cover only approximately 0.84% of the world’s land surface (Soil Survey Staff Citation1999), they, including ancient to recent, cover more than 50% of the total upland crop field area in Japan. Moreover, Andosols often have high organic carbon content, mainly due to the formation of short-range ordered minerals and aluminum (Al)/iron (Fe)–humus complexes (Shoji et al. Citation1993; Takahashi and Dahlgren 2016). Therefore, changes in the SOC of Andosols contribute significantly to calculations of CO2 emission from soils (Shirato et al. Citation2004).
Soil organic matter (SOM) is a major binding agent that stabilizes soil aggregates, whereas soil aggregates protect organic matter and act as an important reservoir of C and other mineral nutrients (Elliott Citation1986; Beare et al. Citation1994). SOM therefore affects the physico-chemical properties of soil (Matson et al. Citation1997; Bot and Benites Citation2005). Increases in SOM lower bulk density (BD) but improve aggregation, hydraulic conductivity, water-holding capacity, and total porosity (Celik et al. Citation2004; Papadopoulos et al. Citation2009; Celik et al. Citation2010; Liu et al. Citation2011). In addition, the cation exchange capacity (CEC) of soil is highly correlated with SOC content (Gruba and Mulder Citation2015).
In cropland, C sequestration is influenced by field management practices (Jobbágy and Jackson Citation2000; Jastrow et al. Citation2007). Management systems relying on chemical fertilizers have increased agricultural productivity, but their application may induce a decline in SOC and the leaching of environmental pollutants – for example, by soil erosion and nitrogen (N) leaching – to the aquasphere because of the lack of C input and excess amounts of N input to soils (Mäder et al. Citation2002; Pimentel et al. Citation2005). The application of organic matter is expected to increase SOC by means of the direct input of a C source, and mitigate environmental pollution by the stabilization of soil aggregates and the reduction of chemical fertilizer application rates. Many studies have indicated a positive relationship between the amounts of C incorporated into soil and an increase in SOC content (Hao et al. Citation2003; Kundu et al. Citation2007; Naveed et al. Citation2014).
Andosols are noted for their good physical properties, including low BD, high porosity, high water-holding capacity, good drainage and aeration, and good tilth and friability (Shoji et al. Citation1993; McDaniel et al. Citation2012; Takahashi and Dahlgren Citation2016). Consequently, Andosols have been widely used for cultivation in Japan. However, the low BD results in low weight-bearing capacity and renders Andosols highly susceptible to wind erosion (McDaniel et al. Citation2012). Moreover, phosphorus (P) deficiency caused by a high phosphate absorption coefficient (PAC) (Shoji et al. Citation1993; Takeda et al. Citation2009) is a major constraint on crop production in Andosols. Organic matter application has been expected to minimize the effect of wind erosion by facilitating aggregate stability (Bronick and Lal Citation2005; Arthur et al. Citation2013) and to improve P availability by enhancing organic P mineralization (Tsuji et al. Citation2006; Takeda et al. Citation2009).
Management practices that influence SOC concentration may also affect soil BD. However, most previous studies have evaluated SOC stock using SOC content and soil BD associated with a specific soil depth (fixed-depth method) (Mikha et al. Citation2013; Lee et al. Citation2009), without considering changes in soil mass caused by changing BD. Consequently, changes in soil BD and its effect on unequal soil mass associated with a fixed depth have a confounding effect on the estimation of SOC mass (Mikha et al. Citation2013), illustrating the importance of reporting soil C using an equivalent soil mass (ESM) method (Ellert and Bettany Citation1995).
It is important to evaluate the effect of long-term application of organic matter in Andosols, not only from the perspective of C sequestration but also from that of soil fertility improvement. Therefore, we conducted the present study in Toya, Hokkaido, Japan, where Andosols of different ages are distributed in the same area, and practices that encourage the efficient use of organic matter have been developed from the late 1990s.
This study had the following aims: first, to estimate the changes in SOC content and stock associated with long-term application of organic matter in upland fields of Andosols in the cool temperate zone by using an ESM method; second, to evaluate the effects of long-term applications of organic matter on soil physico-chemical properties; and, third, to identify the factors that control SOC sequestration.
2. Materials and methods
2.1 Study site
The study was conducted in Toya, Central Hokkaido, Japan (42 ̊65ʹN, 140 ̊80ʹE), located on the north side of Lake Toya (). The site is characterized by a humid continental climate with cold winters and cool summers but without an apparent wet or dry season. The long-term (30 years) average annual precipitation and air temperature were 1179 mm and 7.5°C, respectively, with a mean monthly temperature ranging from 24.5°C in August to −4.2°C in January.
Figure 1. Distribution of the soil series and location of the study fields.
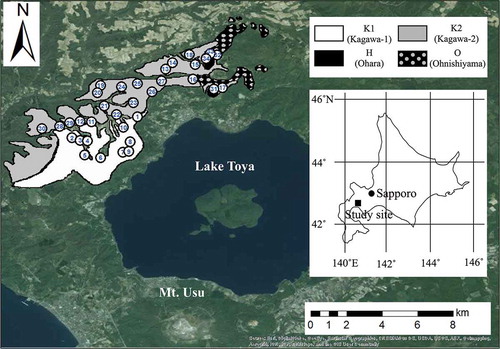
The soil was classified as an Andosol (IUSS working Group WRB. 2015), and the parent materials were derived from Toya Caldera. Subsoils in the study area were derived from Mt. Yotei (Ya), and surface soils from Mt. Usu (Ua and Ub) (Miyabuchi et al. Citation2014). Eruptive activity at Usu Volcano resumed in 1663, and since then seven eruptions have been recorded, in 1769, 1822, 1853, 1910, 1943–1945, 1977–1978 and 2000 (Miyabuchi et al. Citation2014). Ua was derived from the volcanic ash produced by an eruption after 1769. Ub originated from the volcanic ash produced by the eruption in 1663. Four major soil series are distributed in this area (). Kagawa-1 (K1) was more affected by Ua and Ub than the other three soil series, since the K1 soil series is closer to Mt. Usu (). K1 is consequently an immature soil, which has low SOC content and soil physico-chemical fertilities (). Kagawa-2 (K2), Ohara (H) and Ohnishiyama (O) have thin Ua and Ub horizons. The soil series of H and O have high SOC content in whole profiles and are regarded as being of a similar soil series (). The K1 soil series is classified as a Vitric Andosol [IUSS Working Group WRB (2015); Typic Udivitrands (Soil Survey Staff Citation2014)], whereas the K2, H and O soil series are classified as Silandic Andosols [IUSS Working Group WRB (2015); Typic Hapludands or Hydric Hapludands (Soil Survey Staff Citation2014)].
Table 1. Representative soil profile of each soil series of the study area in 2001–2003.
Major crops such as corn (Zea mays L.), sugar beet (Beta vulgaris ssp. vulgaris var. altissima), potato (Solanum tuberosum L.), red bean (Vigna angularis (Willd.) Ohwi & H.Ohashi), radish (Raphanus sativus L. var. longipinnatus L.H. Bailey), carrot (Daucus carota subsp. sativus (Hoffm.) Arcang.), and burdock (Arctium lappa L.) are rotationally cultivated in this area.
2.2 Soil sampling
From 2001 to 2003, soil profiling surveys and physico-chemical property analyses were conducted in 34 upland fields [12 fields from K1, 18 fields from K2, two fields from H, and two fields from O ()] with one replicate by the Hokkaido Central Agricultural Experiment Station. The average depth of the Ap horizon of the 34 fields was 0.23 ± 0.04 m (ranging from 0.15 to 0.32 m) in 2001–2003, and no changes have been reported since that time. Three replicates of both composite and undisturbed samples (100 mL) were taken from the top 0.15 m (the minimum depth of the Ap horizon) of the soils in the same fields in May 2012 to evaluate the effect of organic matter application on C stock change in the Ap horizon. As the H and O are regarded as similar soil series, these soil series are treated as one group (HO) in this study.
2.3 Sample preparation and analysis
2.3.1 Sample preparation
To measure the chemical properties of soil samples, composite samples were air dried and passed through a 2-mm mesh sieve that removed stones, roots and other plant residues. Samples for C content estimation were sifted further using a 0.5-mm mesh. Samples were stocked in the laboratory until measurements of soil chemical properties could be conducted.
2.3.2 Soil physical properties
The same methods in 2001–2003 and 2012 were employed to determine the soil physical properties. Total porosity was measured using a three-phase meter (DIK-1110; Daiki Rika, Saitama, Japan). The cores were then oven dried at 105°C for 48 h to measure water content and BD. The saturated hydraulic conductivity was measured using both constant head and falling head methods, based on Darcy’s law. Soil texture was determined using the pipette method.
2.3.3 Soil organic carbon (SOC) content
The wet oxidation method using potassium dichromate (K2Cr2O7) was used to determine SOC content in 2001–2003. This method has been reported to give, on average, 6–7% lower SOC concentrations for mineral soil than the dry combustion method (Sippola Citation1982). Hence, 15 surface soil samples collected in 2012 were analyzed with both this method and the dry combustion method using an NC analyzer (NC-900; Sumika Chemical Analysis Service, Ltd., Osaka, Japan), to account for discrepancies between the methodologies. We accordingly obtained the following regression equation:
Using this equation, we modified the values measured using the oxidation method in 2001–2003.
2.3.4 Soil chemical properties
Soil pH, available phosphorus (P), phosphate absorption coefficient (PAC), cation exchange capacity (CEC), exchangeable base cations, and available nitrogen (N) were measured using the same methods in 2001–2003 and 2012.
Soil pH in 1:5 soil:water suspensions was measured using a pH meter (F-8 pH meter; Horiva, Japan). Available P was measured using the Truog method. Soil samples were extracted with 0.001 M H2SO4, and the concentration of P2O5 was determined with the ascorbic acid reduction method using a spectrophotometer (UV mini-1240; Shimadzu, Kyoto, Japan). PAC was measured using the ammonium phosphate method. The soil sample was extracted for 24 h with 13.44 mg phosphorus pentoxide (P2O5) mL−1 ammonium phosphate solution, and the concentration of P2O5 was determined using the vanadomolybdate acid method using a spectrophotometer (UV mini-1240; Shimadzu, Kyoto, Japan). CEC and exchangeable base cations were measured using the batch method. Exchangeable potassium (K+), sodium (Na+), calcium (Ca2+) and magnesium (Mg2+) were extracted with 1 M ammonium acetate (pH 7). Concentrations of K+ and Na+ were measured using flame photometry (Z5010; Hitachi, Tokyo, Japan), and concentrations of Ca2+ and Mg2+ were measured using atomic absorption spectrophotometry (Z5010; Hitachi, Tokyo, Japan). To determine CEC, the residual soil, after the extraction of exchangeable cations, was extracted further with 1 M potassium chloride (KCl), and the concentration of ammonium nitrogen (NH4+-N) was measured using the formol titration method. Base saturation (BS) was determined as the proportion of exchangeable basic cations to CEC. Thermal extraction methods are used to assess the availability of nitrogen in soil (Curtin et al. Citation2006; Chantigny et al. Citation2010), and in this study, available N was measured using a simplified thermal extraction estimation method (Sakaguchi et al. Citation2010).
2.4 Management practice
Application of organic matter was conducted in all 34 fields in the area because of the practice developed in the late 1990s that encourages sustainable agriculture with proper fertilization, based on soil analyses, and the effective use of organic matter. Information on management practices was collected using questionnaires given to farmers. Application rates of manure, green manure, and combined organic and synthetic fertilizer during the period between 2001–2003 and 2012 were collected. In this study, combined organic and synthetic fertilizer was defined as the sum of chemical fertilizer, organic fertilizers such as dried bacterial cells and defatted rice bran, and a mixture of chemical and organic fertilizers.
2.5 Manure sampling and analysis
Manures in this region are produced intensively on several livestock farms, and farmers purchase these manures from the farms. According to the result of the questionnaire for the farmers, we chose representative farmers who used each of the different types of manure (fields no. 9, 10, 28, 29 and 31). Manure samples were collected with five replicates in October 2012. Manure samples were well homogenized, and their chemical properties were analyzed in the laboratory. Fresh samples of manure were air-dried and passed through a 1-mm mesh to determine total carbon (TC), total nitrogen (TN), P2O5 and potassium oxide (K2O) contents. TC and TN were measured using the dry combustion method (NC-900; Sumika Chemical Analysis Service, Ltd., Osaka, Japan). The P2O5 and K2O contents were measured using the wet oxidation method with concentrated sulfuric acid (H2SO4). Concentrations of P2O5, K+ and Mg2+ were determined with the vanadomolybdate acid method using spectrophotometry (UV mini-1240; Shimadzu, Kyoto, Japan), flame photometry and atomic absorption spectrophotometry (Z5010; Hitachi, Tokyo, Japan), respectively. Each of these analyses was replicated 3 times.
2.6 Calculations
2.6.1 Carbon stock
The SOC stock (Mg C ha−1) in 0–0.15 m of the soil in 2012 was calculated using the following equations:
where M2012 represents the soil mass (Mg ha−1 0.15 m−1), ρb2012 is the soil bulk density (Mg m−3) in 2012, 0.15 is the soil sampling depth (m) in 2012 and 104 is a factor to adjust units.
where Cstock2012 represents the SOC stock in 2012 (Mg C ha−1 0.15 m−1), Cconc2012 is the SOC content (g C kg−1) in 2012 and 10–3 is a factor to adjust units.
SOC stock in 2001–2003 (Cstock2001-03) was calculated using the ESM method (Ellert and Bettany Citation1995; Mikha et al. Citation2013). This method is generally recommended for comparing soil C stocks (Palm et al. Citation2014) because it minimizes the error associated with the possible changes in soil BD between the two sampling times. The soil mass in 2001–2003 was adjusted to that in 2012, and Cstock2001-03 was calculated as follows:
where Cconc2001-03 is SOC content (g C kg−1) in 2001–2003, and 10–3 is a factor to adjust units.
2.6.2 Change of SOC and soil physico-chemical properties
The amount of change in SOC stock (ΔCstock, Mg C ha−1 0.15 m−1) was estimated as follows:
The SOC stock change rate (ΔCstockrate, Mg C ha−1 yr−1) was calculated as follows:
where T is the interval (years) between the two soil sampling times.
The same calculation procedure was used to obtain the rate of change in SOC content and other soil physico-chemical properties.
2.6.3 Application rate of organic matter
Annual average C application rates of manure, green manure, organic fertilizer (Corg, Mg C ha−1 yr−1), N, P and K were calculated as follows:
where R is the application rate of fresh organic matter (Mg ha−1 period−1), DMC is the dry mater content of applied organic matter (kg kg−1), TC is the total carbon content of dry organic matter (g C kg−1), 100 is a factor to adjust units and Y is the number of years.
Heiotsu (Avena sativa L.) was used as a green manure, and both succeeding crop green manure and fallow green manure were used in the study site. The Hokkaido Agricultural Department (Citation2004) have cited values for the fresh and dry matter weight and nutrient contents of green manures. The application rate of C in combined organic and synthetic fertilizer was calculated from the application rate of N and the CN ratio of organic matter (Shiga et al. Citation1985; Noguchi Citation2001). Dried bacterial cells, feather meal, defatted rice bran, rapeseed meal, soybean meal, fish meal, meat-and-bone meal, hair meal, and dried cow dung were applied, the CN ratios of which were 4.1, 3.1, 10.5, 5.7, 4.3, 3.6, 4.2, 4.9 and 15.5, respectively.
2.7 Statistical analysis
Statistical analyses were performed using R (R Development Core Team 2014; version 3.1.0). The differences in manure, green manure, and fertilizer application rates among the soil series were determined using a one-way factorial analysis of variance (ANOVA) and the Tukey–Kramer test. The difference in soil physico-chemical properties among the fields and in the different years was determined using a two-way ANOVA and the Tukey–Kramer test. When interactions between the fields and the years were observed, the difference between the years for each of the 34 fields was analyzed using a paired t-test. The difference in soil physico-chemical properties among the soil series was analyzed using a one-way ANOVA and the Tukey–Kramer test. The difference between the two regression equations was analyzed using an analysis of covariance (ANCOVA).
3. Results
3.1 Management practice
shows the annual average application rates of fresh weight, C, N, P2O5 and K2O of manure, green manure, and combined organic and synthetic fertilizer in the study fields. Manure was used in 24 fields and was spread once every 2 to 5 years from April to May and/or September to October. Green manure was used in 26 fields and was grown as the succeeding crop green manure, once every 2–5 years, after the harvest of cultivated crops, or cultivated as a fallow green manure. Combined organic and synthetic fertilizer were applied to 33 fields. The annual average fresh weight of applied manure, green manure, and combined organic and synthetic fertilizer was 6.8 ± 7.8, 8.3 ± 6.1 and 1.4 ± 0.5 Mg ha−1 yr−1, respectively, and there was no significant difference between the soil series. The annual average input of C in K1, K2 and HO was 1.71 ± 1.22, 1.33 ± 1.42 and 1.21 ± 0.67 Mg C ha−1 yr−1, respectively. The application rate for K1 was relatively higher compared with that for K2 and HO. However, there were no significant differences among the soil series. The annual average input of N, P2O5 and K2O was 209 ± 112 Kg N ha−1 yr−1, 274 ± 168 kg P2O5 ha−1 yr−1 and 224 ± 100 kg K2O ha−1 yr−1, respectively, and there were no significant differences among the soil series. The composition ratio of manure, green manure and other organic matters was 65, 32 and 3% in C, 32, 10 and 58% in N; 26, 4 and 70% in P2O5; and 32, 19 and 49% in K2O, respectively.
Table 2. Annual average application rate of manure, green manure, and combined organic and synthetic fertilizer in study fields.
3.2 SOC content and SOC stock
The results of the two-way ANOVA showed significant differences in SOC content (P < 0.01) between the fields (). Significant interactions between the fields and the years were also observed (P < 0.01), and the trend of increasing and decreasing SOC content differed in each field. Paired t-tests showed that SOC content increased, decreased and was unchanged in 18, 32 and 50% of the fields, respectively. There were significant differences in SOC stock (P < 0.01) between the fields, but not in the different years (). Significant interactions between the fields and the years were observed (P < 0.01). SOC stock increased, decreased and was unchanged in 10, 35 and 55% of the fields, respectively. In the K2 soil series, SOC content and SOC stock decreased significantly. In the HO soil series, those showed a similar tendency, but in the K1 soil series, there was a tendency to increase (). The rates of ΔSOC content (0.24 ± 0.61, −0.27 ± 0.38 and −0.33 ± 0.48 g C kg−1 yr−1, for K1, K2 and HO, respectively) and ΔSOC stock (0.44 ± 0.88, −0.44 ± 0.59 and −0.50 ± 0.70 Mg C ha−1 0.15 m−1 yr−1 for K1, K2 and HO, respectively), were significantly different in the soil series, and ΔSOC content and ΔSOC stock were significantly higher in the K1 soil series in comparison with the K2 soil series. ΔSOC content and ΔSOC stock increased with increasing rates of manure C application; however, the correlations were not significant (). SOC content and SOC stock were negatively correlated with sand content and were positively correlated with silt content in 2001–2003 and 2012 (P < 0.01 and P < 0.01 for sand and P < 0.01 and P < 0.01 for silt in 2001–2003, and P < 0.01 and P = 0.05 for sand and P < 0.01 and P < 0.01 for silt in 2012; ). However, soil texture had no effect on the rates of ΔSOC content and ΔSOC stock. There was a significantly negative correlation between initial SOC content (in 2001–2003) and the rates of ΔSOC content (P < 0.01) ()) and between initial SOC stock (in 2001–2003) and the rate of ΔSOC stock (P < 0.01) ()).
Table 3. Comparison of soil organic carbon (SOC) content and stock between 2001–2003 and 2012.
Table 4. Changes in soil organic carbon (SOC) content, SOC stock and physico-chemical properties in 2001–2003 and 2012 for three soil series.
Table 5. Pearson’s correlation matrix of carbon (C) application rates and changes in soil physico-chemical properties.
Figure 2. Relationship between soil texture and soil organic carbon (SOC). Present: 2012. Past, 2001–2003.
Figure 3. Relationship between: (a) initial soil organic carbon (SOC) content and rate of ΔSOC content; (b) initial SOC stock and rate of ΔSOC stock.
3.3 Soil physical properties
Results of the two-way ANOVA showed that there were significant differences in BD and total porosity (P < 0.01) in the different fields and in both 2001–2003 and 2012, that hydraulic conductivity was significantly different between the years (P < 0.01) and there was no interaction between the fields and the years in terms of physical properties (). BD decreased significantly in the K1 and K2 soil series, and there was a tendency of decrease of BD in the HO soil series (P = 0.1) (). The K1 soil series showed a tendency of increase of total porosity (P = 0.07); no significant changes were observed in the K2 and HO soil series. A significantly negative correlation between SOC content and BD (P < 0.01), and positive correlations between SOC content and total porosity (P < 0.01), were found in both 2001–2003 and 2012 (). Similarly, we observed a significantly negative correlation between ΔSOC content and ΔBD (P < 0.05), and a positive correlation between ΔSOC content and Δtotal porosity (P < 0.05) ().
Table 6. Comparison of soil physical properties between 2001–2003 and 2012.
Table 7. Pearson’s correlation matrix of soil physicochemical properties in both 2001–2003 and 2012.
3.4 Soil chemical properties
pH, available N, PAC and available P were significantly different in each field and in both 2001–2003 and 2012 (P < 0.01), and significant interactions between the fields and the years were also observed (P < 0.01) (). Paired t-test results showed that pH increased, decreased and remained unchanged in 52, 27 and 21% of the fields, respectively. Available N increased, decreased and remained unchanged in 12, 53 and 35% of the fields, respectively. PAC increased, decreased and remained unchanged in 54, 9 and 29% of the fields, respectively, whereas available P increased, decreased and remained unchanged in 9, 29 and 62% of the fields, respectively. The trend of change for pH, available N, PAC and available P differed among the soil series (). pH increased significantly only in the K1 soil series, and a significantly higher ΔpH was observed in the K1 soil series than the K2 and HO soil series. The available N decreased significantly in the K1 and K2 soil series, but no change was observed in the HO soil series, and the Δavailable N was significantly lower in the K1 soil series than the K2 soil series. PAC increased significantly in the K1 and K2 soil series, but a significant decrease in available P was observed only in the K1 soil series. PAC increased significantly in the K1 and K2 series, but a significant decrease in available P was observed only in the K1 soil series. ΔPAC (787 ± 479, 193 ± 341 and 46 ± 272 mg P2O5 100 mg−1, for K1, K2 and HO, respectively) was significantly higher in the K1 soil series than the K2 and HO soil series, while Δavailable P (−19.5 ± 19.7, −5.1 ± 9.7 and −1.7 ± 2.5 mg P2O5 kg−1, for K1, K2 and HO, respectively) was significantly lower in the K1 soil series than the K2 and HO soil series. Changes in PAC and available P between 2001–2003 and 2012 were significantly positively and negatively correlated with ΔSOC content (P < 0.01), respectively, and there was a significant negative relationship between Δavailable P content and ΔPAC (P < 0.01) ().
Table 8. Comparison of soil chemical properties between 2001–2003 and 2012.
Exchangeable K+ and Mg2+, base saturation and CEC were significantly different in each field and in 2001–2003 and 2012 (P < 0.01), but exchangeable Ca2+ was significantly different only between the fields (P < 0.01). However, there was a significant interaction between the fields and the years for all the properties (P < 0.01) (). Exchangeable K+ increased, decreased and was unchanged in 73, 3 and 24% of the fields, respectively; exchangeable Ca2+ increased, decreased and was unchanged in 18, 23 and 59% of the fields, respectively; and exchangeable Mg2+ increased, decreased and was unchanged in 44, 9 and 47% of the fields, respectively. Base saturation increased, decreased and was unchanged in 3, 32 and 65% of the fields, respectively. CEC increased, decreased and was unchanged in 59, 3 and 38% of the fields, respectively. Among the soil series, there were no differences in the trend of change in exchangeable base cations and CEC. (). A significant increase in exchangeable Mg2+ was observed only in the K1 soil series, and the Δexchangeable Mg2+ was significantly higher in the K1 soil series in comparison with the K2 soil series. There was a strong positive correlation between CEC and SOC content in both 2001–2003 and 2012 (P < 0.01) (), and a significant positive relationship between ΔSOC content and ΔCEC (P < 0.01) ().
Table 9. Comparison between exchangeable cations, base saturation and CEC in 2001–2003 and 2012.
Figure 4. Relationship between soil organic carbon (SOC) content and cation exchange capacity (CEC). Present: 2012. Past: 2001–2003.
4. Discussion
4.1 Possible causes of changes in SOC and soil physico-chemical properties
From 2001–2003 to 2012, we observed changes in SOC content and SOC stock, and several soil physico-chemical properties, such as significant improvement of soil physical properties (), and significant increases in PAC () and CEC (). In the K1 soil series in particular, significant increases in SOC content and stock were observed in several fields (), and a significant increase in PAC and significant decrease in available P were also observed (). These changes can be attributed to the long-term application of organic matter and mixing with subsurface soil. The Ya horizon with high SOC content, PAC and CEC, and low BD appeared only at a depth of below 0.77, 0.57 and 0.48 m in K1, K2 and HO (the average value of H and O) soil series, respectively, and it was much deeper than the depth of plowing (). Additionally, the subsurface horizon of K1 is a mixture of Ua and Ub or Ub horizons, which has soil physico-chemical properties similar to the surface horizon (). We accordingly judged that long-term application of organic matter is the main cause of the changes in SOC and soil physico-chemical properties.
4.2 SOC content and SOC stock
The changes in SOC stock reflect the C balance in a field [the difference between C input (net primary production and organic matter application) and C output (organic matter decomposition, harvest and erosion)]. Improved agricultural practices that could lead to reduced carbon losses, or even increased SOC stock, are highly desirable (West and Post 2002; Lal et al. Citation2004). In this study, the changes in both SOC content and SOC stock were not significant but decreased slightly during the study period (). This result indicated that organic matter application basically maintained the SOC content and SOC stock in this study area. Organic matter application is generally expected to increase SOC (Hao et al. Citation2003; Kundu et al. Citation2007; Naveed et al. Citation2014). Several studies have indicated a positive relationship between the amounts of C incorporated into the soil and SOC content (Hao et al. Citation2003; Kundu et al. Citation2007; Naveed et al. Citation2014). In this study, there were weak positive trends of increase in ΔSOC content and ΔSOC stock with increases in the application of manure C ().
Clay particles protect and stabilize SOM (Six et al. Citation2002; Bronick and Lal Citation2005), but in this study, there was no significant correlation between SOC and clay content. However, there was a significant positive correlation between silt content and SOC (). This result may indicate that the SOC accumulates in fine pores inside aggregates formed by the orientation of silt particles rather than via chemical bonding with clay minerals. Heikkinen et al. (Citation2013) reported that the cultivation of annual crops decreased SOC in coarse-textured soils more than in fine-textured soils. However, we could not detect a direct effect of texture on changes in SOC.
shows a comparison of the regression equations between initial SOC content and rate of ΔSOC content obtained in previous studies in England and Wales (Bellamy et al. Citation2005), South Norway (Riley and Bakkegard Citation2006), the Netherlands (Hanegraaf et al. Citation2009) and South Germany (Capriel Citation2013). All of these studies were conducted in temperate or cool temperate zones, and the soil types were undisclosed. The threshold level of initial SOC content ranged from 0.35 to 63.7 g C kg−1. Because all of these studies were undertaken in temperate or cool temperate zones, and the mean annual temperature (ranging from 5.6 to 9.7°C) and the annual precipitation (ranging from 620 to 798 mm) are not so different among the studies, we could not determine the effect of climate on the threshold. The threshold level in grassland or grassland and maize rotation (ranging from 22.3 to 63.7 g C kg−1) appears to be higher than it is in cropland (15.8 and 17.2 g C kg−1), with the exception of 0.35 g C kg−1 in the grassland and maize rotation in the Netherlands (Hanegraaf et al. Citation2009). Agricultural practices such as tillage enhance SOM decomposition through the destruction of soil aggregate and an increase in aerobic conditions (Balesdent et al. Citation2000; Grandy and Robertson Citation2006). Moreover, the export of C through the harvesting of crops also causes a reduction of SOC in cropland in comparison with other land uses such as natural forest or grassland (Gelaw et al. Citation2014; Wang et al. Citation2016). The threshold level that we obtained in this study (24.3 g C kg−1) was higher than those in croplands in South Norway (Riley and Bakkegard Citation2006) and South Germany (Capriel Citation2013) (15.8 and 17.2 g C kg−1, respectively). This may be attributable to the specific feature of Andosols in this study area, which accumulate SOC by the formation of short-range-ordered minerals and Al/Fe–humus complexes (Shoji et al. Citation1993; Takahashi and Dahlgren 2016).
Table 10. Comparison of regression equation between initial soil organic carbon (SOC) content and rate of ΔSOC content.
Similar to previous studies, a significant negative relationship between initial SOC content (in 2001–2003) and the rate of ΔSOC content ()) and the rate of ΔSOC stock ()) were observed (Bellamy et al. Citation2005; Lark et al. Citation2006; Riley and Bakkegard Citation2006; Goidts and van Wesemael Citation2007; Saby et al. Citation2008; Hanegraaf et al. Citation2009; Capriel Citation2013). From the regression equations, the threshold level of initial SOC was estimated as 24.3 (g C kg−1) in SOC content and 36.1 (Mg C ha−1 0.15 m−1) in SOC stock.
We observed various trends in ΔSOC content and ΔSOC stock in different soil series (). There was no significant difference between the soil series with regards to the total application rate of C via organic matter (). Therefore, difference of initial SOC content might be a reason for the different trend of ΔSOC content and ΔSOC stock, because there was a significant relationship between initial SOC and ΔSOC content and stock (). Positive ΔSOC content and stock were found in the K1 soil series where the initial SOC content and SOC stock (19.0 ± 8.2 g C kg−1 for SOC content; 28.9 ± 9.5 Mg C ha−1 0.15 m−1 for SOC stock) were lower than the threshold SOC (24.3 g C kg−1 and 36.1 Mg C ha−1 0.15 m−1, for SOC content and SOC stock, respectively). However, in fields in the K2 and HO soil series, where initial SOC content and SOC stock were higher than the threshold values (30.5 ± 3.9 and 31.2 ± 5.6 g C kg−1 for SOC content, respectively, and 43.8 ± 6.9, 45.1 ± 6.3 Mg C ha−1 0.15 m−1 for SOC stock, respectively), we observed negative ΔSOC content and stock. These results indicate the strong effect of organic matter application on C sequestration in immature soils of K1, and indicate the difficulties in maintaining or accumulating SOC in fields where SOC is higher than the threshold level.
4.3 Soil physical properties
Similar to the findings of previous studies (Hati et al. Citation2007; Papadopoulos et al. Citation2009; Chen et al. Citation2010), the long-term application of organic matter significantly increased total porosity but decreased BD without significant interactions between fields and years. Bronick and Lal (Citation2005) showed that organic amendment such as manure has a dilution effect that results in the lower BD and higher porosity of mineral soil. The mixing of organic materials, which have low BD and high macroporosity, with denser mineral fractions of soils leads to this reduction (Celik et al. Citation2004; Arthur et al. Citation2013; Naveed et al. Citation2014). The strong negative relationship between Δtotal porosity and ΔBD () indicated that an increase in total porosity due to the long-term application of organic matter decreases BD. Additionally, research has shown that SOM is a major binding agent that stabilizes soil aggregates. An increase in SOM content results in a greater total porosity and lower BD in soil (Hati et al. Citation2007; Papadopoulos et al. Citation2009; Hemmat et al. Citation2010). As reported by Haynes and Naidu (Citation1998), based on data including 21 soil types, seven waste types and eight crop types, Khaleel et al. (Citation1981) calculated a highly significant linear regression (R2 = 0.69) between increases in SOC (as a result of waste applications) and the percentage reduction in soil BD. This phenomenon is a result of improved aggregation of individual soil particles and decreased BD concomitant with a high SOC content (Hati et al. Citation2007; Papadopoulos et al. Citation2009). In this study, we detected significant negative correlations between SOC content and BD () and between ΔSOC content and ΔBD (). Significant positive correlations between SOC content and total porosity (), and between ΔSOC content and Δtotal porosity, were also observed (). BD decreased and total porosity increased in most fields where the SOC content increased ( and ). Among soil series, there were no significant differences in ΔBD and Δtotal porosity. However, an increasing trend in total porosity (P = 0.07) was observed only in the K1 soil series. The majority of the fields where SOC content increased significantly are located in the K1 soil series (), and a large decrease in BD and increase in total porosity were also observed in the same fields (e.g. fields no. 7 and 9, in ). These results indicate that long-term application of organic matter improves total porosity and decreases BD directly by the dilution effect of mixing of organic materials in all fields and indirectly by the increasing the SOC content in fields that had low initial SOC contents, particularly in the K1 soil series.
Saturated hydraulic conductivity showed significant differences between 2001–2003 and 2013 in all soil series. Saturated hydraulic conductivity is primarily determined by the continuities of macro-pores in soil. Therefore, increases in saturated hydraulic conductivity may be caused by the improved aggregation and increased total porosity of the soil, which results from the application of organic matter (Castellini and Ventrella Citation2012).
4.4 Soil chemical properties
4.4.1 pH
The application of organic matter resulted in a significant increase in soil pH (). This is consistent with the findings of Whalen et al. (2000) and Hati et al. (Citation2008), who reported that cattle manure could increase the pH of soil. Continuous applications of inorganic fertilizers alone reduce soil pH (Hati et al. Citation2008; Tripathi et al. Citation2014) mainly because most of these fertilizers supply nitrogen as NH4 +, and then release H+ ions via oxidation. There was a significant positive correlation between soil pH and base saturation (), probably because organic matter contains substantial amounts of base cations (). When these amendments are incorporated into the soil, the base cations replace exchangeable Al3+ and H+ at negatively charged sites in the soil and enhance the neutralization of soil exchangeable acidity (Masud et al. Citation2014). The application of organic matter can therefore reduce the application rate of chemical fertilizers, and act as a buffer against a marked reduction in soil pH caused by the deactivation of A13+ and concomitant release of cations with its decomposition.
4.4.2 PAC and available P
Unlike previous studies, in which the application of organic matter increased available P via the decomposition of large inputs of P2O5 (Singh et al. Citation2007; Liu et al. Citation2010; Li et al. Citation2012), PAC increased and available P decreased significantly in the present study (). We observed significant negative relationships between Δavailable P and ΔSOC content or ΔPAC (), and the following regression equations were obtained: Δavailable P (mg P2O5 kg−1) = – 16.9 × ΔSOC content (g C kg−1) – 65.0 (R2 = 0.34; P < 0.01) and Δavailable P (mg P2O5 kg−1) = – 0.25 × ΔPAC (mg P2O5 100 g−1) – 45.1 (R2 = 0.60; P < 0.01). These results indicate that available P decreases with increasing SOC content and PAC. There was also a significant positive relationship between ΔPAC and ΔSOC content (). These results indicate that changes in SOC content, caused by the long-term application of organic matter to the soil, are closely related to changes in PAC. The PAC increased significantly in the K1 and K2 soil series, whereas a significant decrease in available P was observed only in the K1 soil series, and the ΔPAC in the K1 soil series was significantly larger than that in the K2 and HO soil series (). These results indicate that the increase in PAC in K1 was of sufficient magnitude to decrease available P.
The efficiency of applied P is typically low in Andosols rich in allophones and active Al (Lukito et al. Citation1998; Wickramatilake et al. 2010; Takahashi and Dahlgren 2016). Furthermore, the application of organic matter is expected to improve P availability by enhancing organic P mineralization (Tsuji et al. Citation2006; Takeda et al. Citation2009). However, K1 had a relatively low initial PAC (1061 ± 389 mg P2O5 100 g−1 in 2001–2003), because this area is covered mainly by immature soil derived from Ua. Under such conditions, the long-term application of organic matter increased PAC because organic matter absorbs P. However, available P was higher than the critical level of the lower limit [100 mg P2O5 kg−1 (Hokkaido Agricultural Department Citation2015)] in all but one of the fields (field no. 14; ) in 2012.
4.4.3 CEC and exchangeable cations
As expected, the application of organic matter increased exchangeable cations and CEC in all soil series ( and ; Hao and Chang Citation2002; Aranda et al. Citation2015). Edmeades (Citation2003) reviewed the results from 14 field trials (six fields in the USA, five in England, and one each in Canada, Ireland and Denmark), comparing the long-term (20–120 years) effects of fertilizers and manures on crop production and soil properties. He found that manured soils had higher K+, Ca2+ and Mg2+ contents in their topsoils than fertilized soils. Increases in exchangeable cations are probably attributable to the continuous supply of high concentrations of K+ and Mg2+ from organic matter as it decomposes (Liu et al. Citation2010).
Soil CEC is important in plant nutrient uptake and ion movement and is highly correlated with the organic carbon and clay content of soil (Hemmat et al. Citation2010; Gruba and Mulder Citation2015). In all soil series in the present study, CEC was mainly associated with SOC, as suggested by the intercept (8.97 cmolc kg−1 in 2001–2003 and 9.97 cmolc kg−1 in 2012) of the linear relationship between SOC content and CEC (). We also found a significantly positive relationship between ΔSOC content and ΔCEC (). These findings indicate that the majority of CEC is determined by SOM and that changes in CEC are closely related to changes in SOC content (Hemmat et al. Citation2010).
Significant correlations between SOC content and CEC were observed in both 2001–2003 and 2012 (). The results of the ANCOVA showed that there was a significant difference in the slope (0.35 cmolc of CEC per g SOC in 2001–2003 and 0.50 cmolc CEC per g SOC in 2012; P < 0.05) between the two regression equations, but no significant difference in the intercept (8.97 cmolc kg−1 in 2001–2003 and 9.97 cmolc kg−1 in 2012). These results indicate that the contribution of the permanent charge of clay minerals for CEC did not change and there was a 43% increase in CEC per g SOC, which was attributable to changes in the quality of SOM because of the application of organic matter.
5. Conclusion
In this study, we evaluated the effects of long-term application of organic matter on the SOC sequestration and physico-chemical properties of soil in upland fields of different types (K1, K2 and HO) of Andosols in the cool temperate zone. In 2001–2003 and 2012, mean SOC content and SOC stock did not change significantly. However, changes in SOC were strongly related to the initial SOC, and most significant increases in SOC were obtained in the fields that had a low initial SOC in the K1 soil series, whereas they decreased significantly in the K2 soil series where the initial SOC was high. On the basis of the regression equation between initial SOC and ΔSOC, the threshold values of the initial SOC content and SOC stock were calculated as 24.3 g C kg−1 and 36.1 Mg C ha−1 0.15 m−1, respectively, and the threshold level of SOC content was higher than that recorded in previous studies in croplands probably because of the specific features of Andosols. Several soil physico-chemical properties, particularly BD, total porosity, saturated hydraulic conductivity and CEC, improved significantly. However, where PAC increased significantly, available P decreased significantly. These changes were closely related to changes in SOC content. These findings indicate that the application of organic matter increases SOC and improves soil fertility when the initial SOC is lower than the threshold, and highlight the difficulties in maintaining or accumulating SOC in Andosol croplands because of the high SOC.
Acknowledgments
The authors are thankful to the staff of the Toya branch of the Japan Agricultural Cooperatives for their work on the field measurements, and to the farmers of Toya region for allowing us to conduct the study on their farms.
Disclosure statement
No potential conflict of interest was reported by the authors.
References
- Aranda V, Macci C, Peruzzi E, Masciandaro G 2015: Biochemical activity and chemical-structural properties of soil organic matter after 17 years of amendments with olive-mill pomace co-compost. J. Environ. Manage. 147, 278–285. doi:10.1016/j.jenvman.2014.08.024
- Arthur E, Schjønning P, Moldrup P, Tuller M, De Jonge LW 2013: Density and permeability of a loess soil: long-term organic matter effect and the response to compressive stress. Geoderma 193–194, 236–245. doi:10.1016/j.geoderma.2012.09.001
- Balesdent J, Chenu C, Balabane M 2000: Relationship of soil organic matter dynamics to physical protection and tillage. Soil Tillage Res. 53, 215–230. doi:10.1016/S0167-1987(99)00107-5
- Beare MH, Hendrix PF, Cabrera ML, Coleman DC 1994: Aggregate-protected and unprotected organic matter pools in conventional- and no-tillage soils. Soil Sci. Soc. Am. J. 58, 787–795. doi:10.2136/sssaj1994.03615995005800030021x
- Bellamy PH, Loveland PJ, Bradley RI, Lark RM, Kirk GJD 2005: Carbon losses from all soils across England and Wales 1978-2003. Nature 437, 245–248. doi:10.1038/nature04038
- Bot A, Benites J 2005: The importance of soil organic matter. FAO Soils Bulletin 80. FAO, Rome.
- Bronick CJ, Lal R 2005: Soil structure and management: a review. Geoderma 124, 3–22. doi:10.1016/j.geoderma.2004.03.005
- Capriel P 2013: Trends in organic carbon and nitrogen contents in agricultural soils in Bavaria (south Germany) between 1986 and 2007. Eur. J. Soil Sci. 64, 445–454. doi:10.1111/ejss.12054
- Castellini M, Ventrella D 2012: Impact of conventional and minimum tillage on soil hydraulic conductivity in typical cropping system in Southern Italy. Soil Tillage Res. 124, 47–56. doi:10.1016/j.still.2012.04.008
- Celik I, Gunal H, Budak M, Akpinar C 2010: Effects of long-term organic and mineral fertilizers on bulk density and penetration resistance in semi-arid Mediterranean soil conditions. Geoderma 160, 236–243. doi:10.1016/j.geoderma.2010.09.028
- Celik I, Ortas I, Kilic S 2004: Effects of compost, mycorrhiza, manure and fertilizer on some physical properties of a Chromoxerert soil. Soil Tillage Res. 78, 59–67. doi:10.1016/j.still.2004.02.012
- Chantigny MH, Curtin D, Beare MH, Greenfield LG 2010: Influence of temperature on water-extractable organic matter and ammonium production in mineral soils. Soil Sci. Soc. Am. J. 74, 517–524. doi:10.2136/sssaj2008.0347
- Chen Y, Zhang X, He H, Xie H, Yan Y, Zhu P, Ren J, Wang L 2010: Carbon and nitrogen pools in different aggregates of a Chinese Mollisol as influenced by long-term fertilization. J. Soils Sediments 10, 1018–1026. doi:10.1007/s11368-009-0123-8
- Curtin D, Wright CE, Beare MH, McCallum FM 2006: Hot water-extractable nitrogen as an indicator of soil nitrogen availability. Soil Sci. Soc. Am. J. 70, 1512–1521. doi:10.2136/sssaj2005.0338
- Edmeades DC 2003: The long-term effects of manures and fertilisers on soil productivity and quality: a review. Nutr. Cycl. Agroecosyst. 66, 165–180. doi:10.1023/A:1023999816690
- Ellert BH, Bettany JR 1995: Calculation of organic matter and nutrients stored in soils under contrasting management regimes. Can. J. Soil Sci. 75, 529–538. doi:10.4141/cjss95-075
- Elliott ET 1986: Aggregate structure and carbon, nitrogen, and phosphorus in native and cultivated soils. Soil Sci. Soc. Am. J. 50, 627–633. doi:10.2136/sssaj1986.03615995005000030017x
- Gelaw AM, Singh BR, Lal R 2014: Soil organic carbon and total nitrogen stocks under different land uses in a semi-arid watershed in Tigray, Northern Ethiopia. Agric. Ecosyst. Environ. 188, 256–263. doi:10.1016/j.agee.2014.02.035
- Goidts E, van Wesemael B 2007: Regional assessment of soil organic carbon changes under agriculture in Southern Belgium (1955-2005). Geoderma 141, 341–354. doi:10.1016/j.geoderma.2007.06.013
- Grandy AS, Robertson GP 2006: Initial cultivation of a temperate-region soil immediately accelerates aggregate turnover and CO2 and N2O fluxes. Glob. Chang. Biol. 12, 1507–1520. doi:10.1111/j.1365-2486.2006.01166.x
- Gruba P, Mulder J 2015: Tree species affect cation exchange capacity (CEC) and cation binding properties of organic matter in acid forest soils. Sci. Total Environ. 511, 655–662. doi:10.1016/j.scitotenv.2015.01.013
- Hanegraaf MC, Hoffland E, Kuikman PJ, Brussaard L 2009: Trends in soil organic matter contents in Dutch grasslands and maize fields on sandy soils. Eur. J. Soil Sci. 60, 213–222. doi:10.1111/j.1365-2389.2008.01115.x
- Hao X, Chang C 2002: Effect of 25 annual cattle manure applications on soluble and exchangeable cations in soil. Soil Sci. 167, 126–134. doi:10.1097/00010694-200202000-00005
- Hao X, Chang C, Travis GR, Zhang F 2003: Soil carbon and nitrogen response to 25 annual cattle manure applications. J. Plant Nutr. Soil Sci. 166, 239–245. doi:10.1002/jpln.200390035
- Hati KM, Swarup A, Dwivedi AK, Misra AK, Bandyopadhyay KK 2007: Changes in soil physical properties and organic carbon status at the topsoil horizon of a vertisol of central India after 28 years of continuous cropping, fertilization and manuring. Agric. Ecosyst. Environ. 119, 127–134. doi:10.1016/j.agee.2006.06.017
- Hati KM, Swarup A, Mishra B, Manna MC, Wanjari RH, Mandal KG, Misra AK 2008: Impact of long-term application of fertilizer, manure and lime under intensive cropping on physical properties and organic carbon content of an Alfisol. Geoderma 148, 173–179. doi:10.1016/j.geoderma.2008.09.015
- Haynes RJ, Naidu R 1998: Influence of lime, fertilizer and manure applications on soil organic matter content and soil physical conditions: A review. Nutr. Cycl. Agroecosyst. 51, 123–137. doi:10.1023/A:1009738307837
- Heikkinen J, Ketoja E, Nuutinen V, Regina K 2013: Declining trend of carbon in Finnish cropland soils in 1974-2009. Glob. Chang. Biol. 19, 1456–1469. doi:10.1111/gcb.12137
- Hemmat A, Aghilinategh N, Rezainejad Y, Sadeghi M 2010: Long-term impacts of municipal solid waste compost, sewage sludge and farmyard manure application on organic carbon, bulk density and consistency limits of a calcareous soil in central Iran. Soil Tillage Res. 108, 43–50. doi:10.1016/j.still.2010.03.007
- Hokkaido Agricultural Department 2004: Hokkaido ryokuhi sakumotsu tou saibai riyou shishin. Hokkaido Agricultural Department, Sapporo. (In Japanese).
- Hokkaido Agricultural Department 2015: Hokkaido Fertilizer Recommendations 2015. Hokkaido Agricultural Department, Sapporo. (in Japanese).
- Intergovernmental panel on climate change (IPCC) 2013: Climate change 2013: the physical science basis. Contribution of working group I to the fifth assessment report of the intergovernmental panel on climate change. Cambridge University Press, Cambridge, United Kingdom and New York, NY, USA. doi:10.1017/CBO9781107415324
- International Union of Soil Sciences (IUSS) Working Group WRB. 2015. World reference base for soil resources 2014, update 2015 International soil classification system for naming soils and creating legends for soil maps. World Soil Resources Reports No. 106. FAO, Rome.
- Janzen HH 2004: Carbon cycling in earth systems a soil science perspective. Agric. Ecosyst. Environ. 104, 399–417. doi:10.1016/j.agee.2004.01.040
- Jastrow JD, Amonette JE, Bailey VL 2007: Mechanisms controlling soil carbon turnover and their potential application for enhancing carbon sequestration. Clim. Change. 80, 5–23. doi:10.1007/s10584-006-9178-3
- Jobbágy EG, Jackson RB 2000: The vertical distribution of soil organic carbon and its relation to climate and vegetation. Ecol. Appl. 10, 423–436. doi:10.1890/10510761(2000)010[0423:TVDOSO]2.0.CO;2
- Khaleel R, Reddy KR, Overcash MR 1981: Changes in soil physical properties due to organic waste applications: a review. J. Environ. Qual. 10, 133–141. doi:10.2134/jeq1981.00472425001000020002x
- Kundu S, Bhattacharyya R, Prakash V, Ghosh BN, Gupta HS 2007: Carbon sequestration and relationship between carbon addition and storage under rainfed soybean-wheat rotation in a sandy loam soil of the Indian Himalayas. Soil Tillage Res. 92, 87–95. doi:10.1016/j.still.2006.01.009
- Lal R, Griffin M, Apt J, Lave L, Morgan MG 2004: Managing soil carbon. Science 304, 393. doi:10.1126/science.1093079
- Lark RM, Bellamy PH, Kirk GJD 2006: Baseline values and change in the soil, and implications for monitoring. Eur. J. Soil Sci. 57, 916–921. doi:10.1111/j.1365-2389.2006.00875.x
- Lee J, Hopmans JW, Rolston DE, Baer SG, Six J 2009: Determining soil carbon stock changes: simple bulk density corrections fail. Agric. Ecosyst. Environ. 134, 251–256. doi:10.1016/j.agee.2009.07.006
- Li XH, Han XZ, Li HB, Song C, Yan J, Liang Y 2012: Soil chemical and biological properties affected by 21-year application of composted manure with chemical fertilizers in a Chinese Mollisol. Can. J. Soil Sci. 92, 419–428. doi:10.4141/cjss2010-046
- Liu EK, Yan CR, Mei XR, He WQ, Bing SH, Ding LP, Liu Q, Liu SA, Fan TL 2010: Long-term effect of chemical fertilizer, straw, and manure on soil chemical and biological properties in northwest China. Geoderma 158, 173–180. doi:10.1016/j.geoderma.2010.04.029
- Liu X, Xiao X, Yang G, Ren T 2011: Water retention curves of soil aggregates as affected by long-term fertilizer management. Soil Sci. 176, 537–542. doi:10.1097/SS.0b013e31822af68d
- Lukito HP, Kouno K, Ando T 1998: Phosphorus requirements of microbial biomass in a regosol and an andosol. Soil Biol. Biochem. 30, 865–872. doi:10.1016/S0038-0717(98)00011-X
- Mäder P, Fliessbach A, Dubois D, Gunst L, Fried P 2002: Soil fertility and biodiversity in organic farming. Science 296, 1694–1697. doi:10.1126/science.1071148
- Masud MM, Li J-Y, Xu R-K 2014: Use of alkaline slag and crop residue biochars to promote base saturation and reduce acidity of an Acidic Ultisol. Pedosphere 24, 791–798. doi:10.1016/S1002-0160(14)60066-7
- Matson PA, Parton WJ, Power AG, Swift MJ 1997: Agricultural intensification and ecosystem properties. Science 277, 504–509. doi:10.1126/science.277.5325.504
- McDaniel PA, Lowe DJ, Arnalds O, Ping C-L 2012: Andisols. In Handbook of Soil Sciences. 2nd Edition. Vol. 1: properties and Processes, Eds. Huang PM, Li Y, Sumner ME, pp. 33.29–33.48. CRC Press (Taylor & Francis), Boca Raton.
- Mikha MM, Benjamin JG, Halvorson AD, Nielsen DC 2013: Soil carbon changes influenced by soil management and calculation method. Open J. Soil Sci. 03, 123–131. doi:10.4236/ojss.2013.32014
- Miyabuchi Y, Okuno M, Torii M, Yoshimoto M, Kobayashi T 2014: Tephrostratigraphy and eruptive history of post-caldera stage of Toya Volcano, Hokkaido, northern Japan. J. Volcanol. Geotherm. Res. 281, 34–52. doi:10.1016/j.jvolgeores.2014.05.019
- Naveed M, Moldrup P, Vogel H-J, Lamandé M, Wildenschild D, Tuller M, De Jonge LW 2014: Impact of long-term fertilization practice on soil structure evolution. Geoderma 217–218, 181–189. doi:10.1016/j.geoderma.2013.12.001
- Noguchi K 2001: Composition of organic fertilizer and soil microorganism. In Nogyou gijutsu taikei, Vols. 7–1, pp. 256–256. Noubunkyo, Tokyo. (in Japanese).
- Palm C, Blanco-Canqui H, DeClerck F, Gatere L, Grace P 2014: Conservation agriculture and ecosystem services: an overview. Agric. Ecosyst. Environ. 187, 87–105. doi:10.1016/j.agee.2013.10.010
- Papadopoulos A, Bird NRA, Whitmore AP, Mooney SJ 2009: Investigating the effects of organic and conventional management on soil aggregate stability using X-ray computed tomography. Eur. J. Soil Sci. 60, 360–368. doi:10.1111/j.1365-2389.2009.01126.x
- Pimentel D, Hepperly P, Hanson J, Douds D, Seidel R 2005: Environmental, energetic, and economic comparisons of organic and conventional farming systems. Bioscience 55, 573–582. doi:10.1641/0006-3568(2005)055[0573:EEAECO]2.0.CO;2
- R Development Core Team 2014: R: A language and environment for statistical computing. R Foundation for Statistical Computing, Vienna, Austria. http://www.R-project.org/ (April, 2017)
- Riley H, Bakkegard M 2006: Declines of soil organic matter content under arable cropping in southeast Norway. Acta Agric. Scand. Sect. B - Plant Soil Sci. 56, 217–223. doi:10.1080/09064710510029141
- Saby NPA, Arrouays D, Antoni V, Lemercier B, Follain S, Walter C, Schvartz C 2008: Changes in soil organic carbon in a mountainous French region, 1990-2004. Soil Use Manag. 24, 254–262. doi:10.1111/j.1475-2743.2008.00159.x
- Sakaguchi M, Sakurai M, Nakatuji T 2010: Rapid analysis of autoclave-extractable nitrogen for assessing soil nitrogen fertility by UV absorptiometry of 1-tryptophan as a standard substance. Jpn. J. Soil Sci. Plant Nutr. 81, 140–143. (in Japanese).
- Shiga H, Ohyama N, Maeda K, Suzuki M 1985: An evaluation of different organic materials based on their decomposition pattern in paddy soils. Res. Bull. Natl. Agric. Res. Cetr. 5, 1–19. (in Japanese with English summary).
- Shirato Y, Hakamata T, Taniyama I 2004: Modified Rothamsted carbon model for andosols and its validation: changing humus decomposition rate constant with pyrophosphate-extractable Al. Soil Sci. Plant Nutr. 50, 149–158. doi:10.1080/00380768.2004.10408463
- Shoji S, Nanzyo M, Dahlgren RA 1993: Volcanic Ash Soils, pp. 48, 155, 162–163, 263. Elsevier, Amsterdam.
- Singh M, Reddy KS, Singh VP, Rupa TR 2007: Phosphorus availability to rice (Oryza sativa L.)–wheat (Triticum estivum L.) in a Vertisol after eight years of inorganic and organic fertilizer additions. Bioresour. Technol. 98, 1474–1481. doi:10.1016/j.biortech.2006.02.045
- Sippola J 1982: A comparison between a dry-combustion method and a rapid wet-combustion method for determining soil organic carbon. Ann. Agric. Fenn. 21, 146–148.
- Six J, Conant RT, Paul EA, Paustian K 2002: Stabilization mechanisms of soil organic matter: implications for C-saturation of soils. Plant Soil 241, 155–176. doi:10.1023/A:1016125726789
- Soil Survey Staff 1999: Soil Taxonomy-A Basic System of Soil Classification for Making and Interpreting Soil Surveys. 2nd Ed. USDA-NRCS Agric. Handb, pp. 436. US Government Printing Office, Washington, DC.
- Soil Survey Staff 2014: Keys to Soil Taxonomy. 12th ed. USDA-Natural Resources Conservation Service, Washington, DC.
- Takahashi T, Dahlgren RA 2016: Nature, properties and function of aluminum-humus complexes in volcanic soils. Geoderma 263, 110–121. doi:10.1016/j.geoderma.2015.08.032
- Takeda M, Nakamoto T, Miyazawa K, Murayama T, Okada H 2009: Phosphorus availability and soil biological activity in an Andosol under compost application and winter cover cropping. Appl. Soil Ecol. 42, 86–95. doi:10.1016/j.apsoil.2009.02.003
- Tripathi R, Nayak AK, Bhattacharyya P, Shukla AK, Shahid M, Raja R, Panda BB, Mohanty S, Kumar A, Thilagam VK 2014: Soil aggregation and distribution of carbon and nitrogen in different fractions after 41years long-term fertilizer experiment in tropical rice–rice system. Geoderma 213, 280–286. doi:10.1016/j.geoderma.2013.08.031
- Tsuji H, Yamamoto H, Matsuo K, Usuki K 2006: The effects of long-term conservation tillage, crop residues and P fertilizer on soil conditions and responses of summer and winter crops on an Andosol in Japan. Soil Tillage Res. 89, 167–176. doi:10.1016/j.still.2005.07.005
- Wang T, Kang F, Cheng X, Han H, Ji W 2016: Soil organic carbon and total nitrogen stocks under different land uses in a hilly ecological restoration area of North China. Soil Tillage Res. 163, 176–184. doi:10.1016/j.still.2016.05.015
- West TO, Post WM 2002: Soil organic carbon sequestration rates by tillage and crop rotation. Soil Sci. Soc. Am. J. 66, 1930–1946. doi:10.2136/sssaj2002.1930
- Whalen JK, Chang C, Clayton GW, Carefoot JP 2000: Cattle manure amendments can increase the pH of acid soils. Soil Sci. Soc. Am. J. 64, 962–966. doi:10.2136/sssaj2000.643962x
- Wickramatilake ARP, Kouno K, Nagaoka T 2010: Compost amendment enhances the biological properties of Andosols and improves phosphorus utilization from added rock phosphate. Soil Sci. Plant Nutr. 56, 607–616. doi:10.1111/j.1747-0765.2010.00493.x