
ABSTRACT
Sandy soils are usually dominant in tropical monsoon regions, due to the high weathering potential associated with high temperatures and precipitation. The organic matter content of sandy soils is low due to low clay content and high microbial activity. Therefore, soil management practices that alter the soil organic carbon (SOC) content may be important for the sustainable management of crop yields. Thus, the present study investigates the distribution of rice yield and SOC content under different land management practices and analyzes the relationship between rice yield and SOC with pertinent management practices (manure and fertilizer applications). The soil horizons from 0- to 40-cm depths were collected in each layer to measure SOC and soil properties at 64 sites. At each sampling site, farmers were given questionnaires and the record book for the standards for good agricultural practices of farm owners were gathered to assimilate information on rice yield and their practices during 2010–2014. The mean rice yield of the whole crop year and SOC were 2.93 Mg ha−1 and 47.09 Mg C ha−1, respectively, in the irrigated areas, and were 2.38 Mg ha−1 and 32.08 Mg C ha−1 in the rain-fed areas. Significantly higher values were obtained in the irrigated areas (p < 0.05). There was a significant positive correlation between rice yield and SOC in both the irrigated areas (R2 = 0.72, p < 0.01) and the rain-fed areas (R2 = 0.85, p < 0.01); however, the slopes of these regression equations were significantly different. In both irrigated and rain-fed areas, manure should be applied every year, with an optimal application rate of N, P, and K fertilizers being selected. The combination of manure, fertilizer, and increasing irrigation facilities the maintenance of SOC levels and substantially increases rice yields.
1. Introduction
In general, carbon dioxide (CO2) may be removed from the atmosphere by capturing it in various systems, such as through soil carbon sequestration (SCS) processes (Saree et al. Citation2012). Soil organic carbon (SOC) is the dominant component of soil organic matter (SOM), which is an important source of carbon for soil processes and a sink for carbon sequestration. Thus, any increase in SOC could significantly increase soil carbon (C) storage and mitigate greenhouse gases (GHGs) that contribute to global warming and climate change (West and Post Citation2002). Rice fields represent high capacity sources of SCS (Pan et al. Citation2004; Lu et al. Citation2009). However, various land management practices, such as tillage, straw management, fertilization, irrigation, and crop rotation, significantly affect GHG emissions (Huang et al. Citation2004; Arunrat et al. Citation2016), SCS (Pan et al. 2009; Bhattacharyya et al. Citation2010), rice production (Parry et al. Citation2004; Wassmann and Dobermann Citation2007), and food security (Nguyen Citation2006).
In Thailand, rice (Oryza sativa L.) cropping is a major land use, and rice fields are distributed throughout most of the northeast region. In general, this region has rain-fed cultivation in the tropical monsoon area, where rice is grown once a year. Jasmine rice is mostly grown under rain-fed conditions in this region. Unfortunately, the soils are often described as universally infertile, with low inherent nutrient contents (Chantanaparb et al. Citation1976). The soil texture is sandy loam, and the SOC content is very low, ranging between 0.26% and 0.80%. The rate of SOC sequestration is very low (around 1.54 kg ha−1 yr−1) compared with other regions (Limtong et al. 2002). Thus, it is necessary to quantify C inputs to the soil, to determine whether they are sufficient to improve SOC over the long term. All of these soil constraints cause stunted growth, and have drastically reduced rice grain yield. In 2014, the average yield for jasmine rice in northeast Thailand is approximately 2.26 Mg ha−1 (OAE, Citation2014), which is the lowest in the country. Various studies have suggested that rice field management with rice cropping under irrigated, anaerobic conditions favors the accumulation of SOM (Zhang and He Citation2004). Moreover, it is thought that SOM decomposes more slowly under anoxic conditions compared to oxic conditions (Sahrawat Citation2004). Thus, it is likely that SOM may increase SOC and crop yields through certain land management practices, such as inputs of organic materials (manures) (Zhang et al. Citation2010) and chemical fertilizer application (Srinivasarao et al. Citation2012).
In humid and tropical regions, several studies have been published on SOC and rice yield. These studies recommend that current nutrient management should involve a combination of manure and chemical fertilizers to improve nutrient efficiency for plant uptake (Zhang et al. Citation2009; Zhao et al. Citation2013) and to increase crop yield (Witt et al. Citation2000; Surekha et al. Citation2003). For instance, in subtropical China, the addition of manure to the soil enabled 18% higher rice yield (Bi et al. Citation2009) than that of chemical fertilizer alone. The highest grain yield of rice was obtained when farmyard manure was applied at 10 Mg ha−1 combined with 120, 60, 45 kg ha−1 for N, P, and K, respectively, of sandy loam soil in India (Satyanaraya et al., 2002). However, these studies were obtained either short- or long-term agricultural experiments, which may be different between scientific experiments and the activities of farmers, in particular in developing countries, such optimal conditions are difficult to achieve (Maat Citation2011). This is because increasing crop productivity and soil health on farmers’ actual management practices are associated with the limitation of socioeconomic factors of farmers’ household (Linh et al. Citation2014). Only a study by Alam et al. (Citation2013) has done well in Bangladesh, who evaluated the best management practices (BMP) integrated with farmers’ crop management techniques in rice for productivity and profitability. Their results showed that 3–28% grain yield increases with BMP resulting in farmers’ net profit increase of US$22 to 120 ha−1. Nevertheless, soil characteristics were not taken into consideration in their study. It can be also affected by the different practices of farmer management, especially SOC have been described as a key indicator in soil fertility management (Loveland and Webb Citation2003). Therefore, the investigation of farmers’ actual practice effect on rice yield and SOC with their practices is limited in tropical monsoon area.
Any management practices should ensure that increasing yields will not destruct the ecology in the future. In order to achieve sustainable management of rice fields in tropical monsoon climates, it is necessary to understand current soil properties and land management practices to develop alternative management practices for maintaining soil quality and increasing in rice yield to ensure food security for the food demands of the growing population. Therefore, our study is the first detailed local analysis of how farmers’ actual management practice factors influence rice yield and SOC. The objectives of this study were to (1) investigate the contents and distribution of rice yield and SOC under different land management practices and (2) analyze the relationship between rice yield and SOC with pertinent management practices, i.e. manure and fertilizer.
2. Materials and methods
2.1. Description of the study area
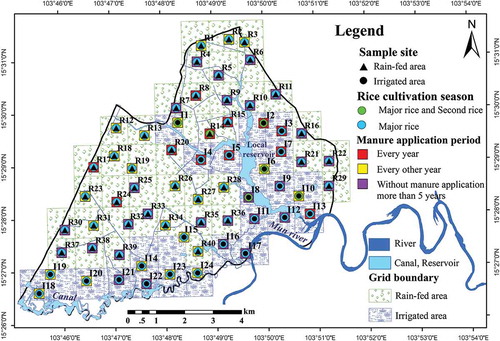
The study area was in Thung Kula Sub-district, Suwannaphum District, and Roi-Et Province, located at 15° 28′ N, 103° 48′ E. Roi-Et soils are formed from washed deposits of sandstone and occur on the lower part of peneplains. The elevation ranges from 100 to 200 m above sea level. The area has a tropical monsoon climate (Köppen ‘Aw’). The major soil type in Roi-Et Province is Ultisol with >60% sand content; low SOC, ranging from 0.40% to 1.29%; and medium acid surface soil of pH 5.0–6.0 (LDD, Citation1991). There are six soil series: (a) Ki (Kula Ronghai series): fine-loamy, mixed, active, isohyperthermic Typic Natraqualfs; (b) Nn (Nakhon Phanom series): fine, kaolinitic, isohyperthermic Aeric Plinthic Paleaquults; (c) Ph (Phan series): fine, kaolinitic, isohyperthermic Typic (Plinthic) Endoaqualfs; (d) Pm (Phimai series): very fine, smectitic, isohyperthermic Ustic Endoaquerts; (e) Sp (San Pa Tong series): coarse-loamy, siliceous, semiactive, isohyperthermic Typic (Kandic) Paleustults; and (f) Tt (Tha Tum): fine, mixed, semiactive, isohyperthermic Aeric (Plinthic) Endoaqualfs (LDD Citation2003) (). In general, the soils are deep and are characterized by different colors; however, the dominant colors are a grayish-brown or light brown sandy loam A horizon overlying a light brown grading to pinkish-gray sandy clay loam or loam kandic B horizon, which, in turn, overlies a light gray or whitish clay loam or clay C horizon. The soils are mottled throughout the profile, with strong brown or yellowish brown or dark brown and some yellowish red or red mottles being common in the subsoil. The reaction is medium acidic over strong to very strongly acidic (LDD Citation2003). The study area was divided into small sub-areas to collect soil samples and determine land management characteristics using a polygonal grid measuring 0.01 × 0.01 degrees in size and covering ~1 × 1 km. The total area was 59.45 ha covering 64 grids overall, consisting of 22.29 ha and 24 grids in irrigated areas and 37.16 ha and 40 grids in rain-fed areas (). This is because rain-fed and irrigated agriculture areas have been used for land performance assessment (George Citation2003) associated with the better nutrient and water management practices to increase crop production (Heng et al. Citation2005). Rice is primarily cultivated during the rainy season, between May and October, while a second rice crop is planted during the dry season, between November and April of the following year (OAE (Office of Agricultural Economics) Citation2014).
Figure 1. Study area and soil series (LDD Citation2003).
Figure 2. Overall land management practice in the study area.
2.2. Questionnaires survey
The data were obtained over a 5-year period (2010–2014). Questionnaires were conducted at each sampling site to record the crop and management practices by farm owners. At 64 sites, 64 farmers were investigated of their crop and land management data. Rice yields and management practice data (i.e. dates of planting and harvesting; rates of application of fertilizers, manure, pesticides, and irrigation; and field operations performed) were collected by our questionnaire survey in 2014 and from the record book for the standards for good agricultural practices (GAP) of farm owners over the 5-year study period (2010–2014), including both rainy and dry seasons. The record books were disseminated to the farmers by the Department of Agricultural Extension, Ministry of Agriculture and Cooperatives, Thailand, to record their agricultural activities and report annually to GAP committee. The record book for GAP is very helpful for this study to obtain the precise data on operational practices. Rice yield data, fertilizer, and manure application rates were averaged over a 5-year cultivation.
2.3. Rice cultivation practice
Based on the weather data from the Roi-Et Meteorological station (16° 03′ N, 103° 04′ E), Thai Meteorological Department during 2004–2014, the monthly average air temperatures during the major rice season (rainy season) and second rice season (dry season) in 2014 reached 28.3°C and 29.3°C, respectively. These temperatures were higher than the averages of the preceding 10 years of 26.4°C and 27.5°C, respectively. Compared with the same period, the annual precipitation during the two rice planting seasons in 2014 was higher than that recorded in the preceding 10 years. The averages for the preceding 10 years were 164 and 73 mm, respectively, while those for 2014 were 223 and 88 mm yr−1, respectively, for the two seasons. However, precipitation is a major limiting factor in rain-fed areas, where most farmers grow rice once a year, representing the major rice crop. Yet, farmers in some irrigated areas are able to grow rice twice a year, including the major and second rice crops. Only Oryza sativa was used in the study area. The main rice varieties recorded in this study were Khao Dawk Mali 105 (KDML 105), RD 6, and Suphanburi 60. KDML105 and RD 6 are strongly photoperiod-sensitive and flower in late October, regardless of sowing time, while Suphanburi 60 is a non-photosensitive rice variety.
The main measures of conventional management in the study area are detailed in the following. First, during the growing period, both major rice crops and second rice crops were cultivated by the broadcast method and harvested by machine. Second, for tillage management, conventional tillage with a depth of 20−30 cm was applied by machine, distinguishing two different situations of wet and dry soil surface conditions. Third, for water management, continuous flooding and shallow flooding were used for irrigated and rain-fed areas, respectively. In irrigated areas, the fields were inundated with 10−15 cm standing water throughout the growing period and drained out or naturally dried 7−10 days before harvesting. In rain-fed areas, the soil was flooded temporarily, depending on rainfall or water pumping when no rain water was available. Fourth, for manure and chemical fertilizer application, cattle manure was often added to the soil as basal fertilizer once a year, usually after harvesting the previous crop or at the beginning of planting the next crop. Three patterns in the periodicity of manure application were detected during our study: every year, every other year, and without manure application for more than 5 years. presents the periodicity patterns of manure application. While the data for this study were gathered during 2010–2014, manure application in 2009 or planned application in 2015 was not considered. Therefore, the manure application in every year means the farmer applied the manure in rice field 5 years continually (2010, 2011, 2012, 2013, and 2014). The manure application in every other year means the farmer applied the manure in rice field in 2010, 2012, and 2014 or in 2011 and 2013. Meanwhile, without manure application for more than 5 years means the farmer did not apply the manure in rice field during 2010–2014. Chemical fertilizer was applied three times in the basal, tillering, and heading stages. The following types of chemical fertilizer were found in the study area: 46-0-0, 16-16-8, 16-20-0, 0-0-60, 15-15-15, and 16-8-8.
2.4. Soil sampling
Soil samples were collected during the dry season after the rice harvest (November, 2014). At each site, the soil horizons from 0- to 40-cm depth were identified by considering specific physical features, namely, color and texture. Three soil samples (replications) of each soil horizon were then collected. A total of 621 soil samples from 64 sites were collected.
2.5. Soil samples analysis
The soil texture (%) (sand, silt, and clay), bulk density, pH, OC, electrical conductivity (EC), cation exchange capacity (CEC), and total nitrogen (TN) were analyzed in the laboratory. The physical and chemical properties of whole soils were determined using the procedures described by the National Soil Survey Center (Citation1996). After a 24-hr drying period in an oven at 105°C, soil bulk density was determined as the dry weight per unit volume of the soil core. Soil texture was determined by a hydrometer, and soil pH was determined in a 1:2.5 soil to water mixture by a pH meter. The EC in saturation paste extracts was measured following the method described by the United States Department of Agriculture (USDA, Citation1954). CEC was determined by the 1N ammonium acetate (NH4OAc) method. TN was measured by the Kjeldahl method. Soil was extracted by the Bray II method, and, subsequently, the available phosphorus content was determined by the molybdate blue method (Bray and Kurtz Citation1945). Extractable K, Ca, and Mg were leached from soil with NH4OAc pH 7.0 and element concentrations were measured by atomic absorption spectrometry (Thomas Citation1996). OC was determined by the method of Walkley and Black (Citation1934). SOC stock was calculated by
where SOC is soil organic carbon stock (Mg C ha−1), BD is soil bulk density (Mg m−3), OC is organic carbon content (%), and D is soil sampling depth (m).
2.6. Statistical analysis
Statistical analyses of the data were performed using SPSS (Version 20.0, USA). Mean and standard deviation values were used to represent rice yield and SOC in different areas. Differences in rice yield and SOC between irrigated and rain-fed areas were analyzed using a t-test and least significant difference test (p < 0.05). Rice yield, SOC, and the main management practice were tested for collinearity. Tolerance (TOL) and the variance inflation factor (VIF) were used as the two important indices for multicollinearity diagnosis. A value of TOL is smaller than 0.1, while a value of VIF is greater than 10; this value indicates the level of serious multicollinearity between independent variables (Bai et al. Citation2010). Simple linear regression analysis was used to find the relationship between two variables by fitting a linear equation. Standardized Major Axis Tests & Routines version 2.0 was performed to compare the significant differences between irrigated and rain-fed areas. Subsequently, stepwise multiple regression analysis was conducted to evaluate the relationships of rice yield with the main management practice. The relationships between different soil properties and SOC were expressed using Pearson’s correlation coefficient.
3. Results
3.1. Farmers’ management practices
For all sites, the field management practices of rice cultivation are shown in and for irrigated and rain-fed areas, respectively. The average manure application rate was 2.23 and 1.15 Mg ha−1 yr−1 for sites in irrigated and rain-fed areas, respectively, and was significantly higher in the irrigated areas compared to the rain-fed areas (p = 0.012). Considering the periods of manure application, in the irrigated areas, the average manure application rate was 3.57, 2.03, and 0 Mg ha−1 yr−1 for every year, every other year, and without more than 5 years application, respectively. Meanwhile, the average manure application rates of 2.30, 2.12, and 0 Mg ha−1 yr−1 were found for every year, every other year, and without more than 5 years application, respectively, for rain-fed areas. There was no significant difference between the irrigated and rain-fed areas when manure application periods were considered. Oo et al. (Citation2010) reported that N, P, and K concentrations in the manure were 1.32%, 0.57%, and 0.93%, respectively, at the experimental field of Khon Kaen University, Thailand. This study used these values to estimate the N, P, and K contents in the manure of each site because their study was conducted in the same region with our study area, which can be assumed that the factors affecting manure characteristics (i.e. animal species, diet, digestibility, housing, and environment) are quite similar. The average amount of N, P, and K applications in manure was 44.06, 19.03, and 31.04 kg ha−1 yr−1 for irrigated areas, and 30.29, 13.08, and 21.33 kg ha−1 yr−1 for rain-fed areas, respectively. The statistical results revealed that the quantity of N, P, and K applications in manure was significantly different between irrigated and rain-fed areas (p < 0.01) ().
Table 1. Main management practices, rice yield, and SOC in irrigated areas (n = 24).
Table 2. Main management practices, rice yield, and SOC in rain-fed areas (n = 40).
Table 3. Comparison of the annual main management practices between irrigated and rain-fed areas (mean ± SD).
The fertilizer application rate across all sites ranged from 150 to 400 kg ha−1 yr−1, with an average of 280 kg ha−1 yr−1. The N application rate ranged from 26.08 to 113.06 kg ha−1 yr−1 across sites, with averages of 88.74 and 76.44 kg ha−1 yr−1 for irrigated and rain-fed areas, respectively. The P and K application rates ranged from 0.00 to 49.04 and 0.00 to 71.04 kg ha−1 yr−1 across sites for irrigated and rain-fed areas, respectively. The average P and K application rates were 31.06 and 24.07 kg ha−1 yr−1 for irrigated areas and 14.45 and 12.04 kg ha−1 yr−1 for rain-fed areas ( and ). A highly significant difference in the fertilizer application rate was obtained between the irrigated and rain-fed areas (p = 0.002), with averages of 320 and 260 kg ha−1 yr−1, respectively. Statistic results showed that the total amount of fertilizer application and N and P application rates were highly significantly different between irrigated and rain-fed areas (p < 0.01); however, there was no significant difference in the K application rate between irrigated and rain-fed areas ().
3.2. Soil characteristics
3.2.1. Soil physical and chemical properties
There were no significant differences in the sand, silt, and clay contents, and finer soil particles (silt + clay) between irrigated and rain-fed areas; however, BD was significantly different (p < 0.05; ). Most of the soils in the study area had a sandy texture. Clay content tended to accumulate in the subsoil layers (10–40 cm), with a simultaneous decrease in sand content. In comparison, silt content was higher in the soil surface layer (0–10 cm), and slightly decreased with increasing depth. The amount of finer soil particles was lower in the soil surface layer, and steadily increased with increasing depth (), ranging from 3.98% to 53.00%, with an average of 27.25%. The sand, silt, and clay contents had ranges of 47.00−96.02%, 0.10−23.90%, and 2.00−32.00%, respectively, and average values of 72.75%, 11.86%, and 15.39%, respectively. BD ranged from 0.71 to 1.78 Mg m−3, and mean values of 1.36 and 1.41 Mg m−3 for irrigated and rain-fed areas, respectively. In each profile, surface soil had slightly lower BD than the subsoil, with this value increasing at a depth between 10 and 40 cm ().
Table 4. Comparison of soil physical and chemical properties between irrigated and rain-fed areas for all soil depths (0–40 cm) (mean ± SD).
Table 5. Average values of soil physical and chemical properties at four different depths, 0–10, 10–20, 20–30, and 30–40 cm from all sites (mean ± SD).
There were significant differences in pH, TN, OC, EC, and CEC, while available P, exchangeable K, Ca, and Mg were not significantly different between irrigated and rain-fed areas (p < 0.05; ). The pH values of the soil ranged from extremely acidic to slightly acidic (pH 3.86−6.66). The mean values of soil pH were 5.03 and 4.96 for irrigated and rain-fed areas, respectively. At all sites, there was higher pH in the surface soil and slightly lower pH in the subsoil. The amount of TN was very low in all soils studied, ranging from 0.01% to 0.086%, with averages of 0.037% and 0.017% for irrigated and rain-fed areas, respectively. A decrease in TN content with increasing depth was observed throughout the study area. The amount of OC in all studied soils was very low, ranging from 0.002% to 3.224%, with averages of 0.93% and 0.61% for irrigated and rain-fed areas, respectively. A decrease in OC content with increasing depth was observed throughout the study area. A range of EC values (0.01–0.17 dS m−1) was observed, with an average of 0.071 dS m−1 in the soils of the study area. Surface soils had a higher value, while the underlying layer had slightly lower values. The average EC values in the soils of irrigated and rain-fed areas were 0.078 and 0.061 dS m−1, respectively. All soils were non-saline. The CEC of the studied soils was very low to moderately low, with values ranging from 2.31 to 7.51 cmolc kg−1. The average value of the CEC for all samples was 4.70 cmolc kg−1, with averages of 4.94 and 4.49 cmolc kg−1 for irrigated and rain-fed areas, respectively. The sandy nature of the soils, with low clay and OM contents, was responsible for the soils in all areas having a low CEC. CEC values increased with depth ().
3.2.2. Relationship among the soil physical and chemical properties with SOC
The distribution of individual BD, sand, and clay contents at all sites did not show any significant correlation with SOC; however, silt content and finer soil particles were significantly related to SOC (r = 0.273 and 0.268, respectively) ().
Table 6. Correlation matrix of soil physical and chemical properties with SOC at all sites (n = 64).
Statistic results showed that the pH, TN, OC, and EC values showed a highly positive correlation with SOC, with r values of 0.455**, 0.950**, 0.962**, and 0.550**, respectively. On the other hand, CEC had a highly negative correlation (r = −0.657**) with SOC in all sites (). All of these results indicate that soils were more fertile in irrigated areas compared to rain-fed areas. Most of the arable soils in the study area had a sandy texture, while an accumulation of clay content was observed in the subsoil layers (10–40 cm), with a simultaneous decrease in sand content.
3.3. Relationships between farmers’ management practices, rice yield, and SOC
To explore potential multicollinearity among the explanatory variables, TOL and VIF were tested. When rice yield was assigned as the dependent variable, the TOL and VIF values for all variables ranged from 0.628 to 0.813 and 1.230 to 1.584, respectively. Ranges of 0.565−0.855 and 1.170−1.771 were found for TOL and VIF values, respectively, when SOC was assigned as the dependent variable. Therefore, multicollinearity was not a serious problem in this study.
Major rice season yields ranged from 1.29 to 4.92 Mg ha−1 yr−1 across sites, with averages of 2.95 and 2.37 Mg ha−1 yr−1 in irrigated and rain-fed areas, respectively. Second rice season yields ranged from 2.11 to 3.24 Mg ha−1 yr−1, with averages of 2.85 and 2.49 Mg ha−1 yr−1 in irrigated and rain-fed areas, respectively. The average yields of KDML105, RD 6, and Suphanburi 60 rice were 2.83, 3.13 and 2.89 Mg ha−1 yr−1 in irrigated areas, respectively, while those were 2.45, 2.15, and 2.49 Mg ha−1 yr−1 in rain-fed areas, respectively ( and ). There was no significant difference in yield potential among KDML105, RD 6, and Suphanburi 60 rice. Although a significant difference between irrigated and rain-fed areas was obtained for major rice season yields (p < 0.05; ), a similar result was not obtained for second rice season yields. This is because a second rice crop was only planted at one site (site R14), resulting in the sample size being too small for rain-fed areas. For the whole crop year, the average rice yield was 2.93 and 2.38 Mg ha−1 yr−1 in irrigated and rain-fed areas, respectively, with a significant difference being found between irrigated and rain-fed areas (p < 0.05; ).
Table 7. Comparison of rice yield and SOC between irrigated and rain-fed areas (mean ± SD).
SOC values ranged from 3.76 to 129.92 Mg C ha−1 in all sites, with averages of 47.09 and 32.08 Mg C ha−1 for irrigated and rain-fed areas, respectively. There was a slight difference in SOC between irrigated and rain-fed areas (p < 0.1; ). There was a significant correlation between rice yield and SOC both in irrigated (R2 = 0.72, p < 0.01) and in rain-fed areas (R2 = 0.85, p < 0.01) (), with the slopes of these regression equations being significantly different. There were also significant relationships between rice yield and the application rates of N, P, and K (), and manure application rate (). Application rates of N, P, and K were positively correlated with rice yield in irrigated areas (R2 = 0.53, 0.40, and 0.21, respectively; p < 0.01) ()) and in rain-fed areas (R2 values of 0.50, 0.49, and 0.17, respectively; p < 0.01) ()). Manure application every year and every other year were positively correlated with rice yield in irrigated areas (R2 = 0.53 and 0.43, p < 0.01, respectively) ()) and in rain-fed areas (R2 = 0.76 and 0.66, p < 0.01, respectively) ()). Although without manure application for more than 5 years was assumed to be no manure application (0 Mg ha−1 yr−1) for the period of this study (,)), rice yield ranged from 1.50 to 3.69 and 1.29 to 2.60 Mg ha−1 yr−1 for irrigated and rain-fed areas, respectively ( and ). There are two reasons for no manure application. Firstly, some farmers do not feed their own cattle animals, so they do not have the manure for application. Secondly, other farmers have less manure in their houses, so they need to store more manure and apply in the soil together once having enough manure. Meanwhile, they neither gather up the manure scattered outdoors nor gather manure from their neighbors. Comparing rice yield and SOC under the period of manure application, the highest rice yield and SOC were found with manure application every year, with average of 4.1 Mg ha−1 and 94.9 Mg C ha−1 for irrigated areas ()), and 3.5 Mg ha−1 and 89.8 Mg C ha−1 for rain-fed areas ()).
Figure 3. Relationship between rice yield and SOC at all sites. The dashed line and solid line were fitted by simple linear regression for irrigated and rain-fed areas, respectively.
Figure 4. Relationship between rice yield and N, P, and K application rates: (A) irrigated areas; (B) rain-fed areas.
Figure 5. Relationship between rice yield and the period of manure application: every year, every other year, and without manure application for more than 5 years: (A) irrigated areas; (B) rain-fed areas.
Figure 6. Comparison of rice yield and SOC between irrigated and rain-fed areas under the period of manure application (men ± SD): (A) irrigated areas; (B) rain-fed areas.
The results of a stepwise multiple regression analysis for SOC and rice yield using manure, N, P, and K fertilizers, taking into consideration the application periods of manure, are shown in . For all sites in irrigated areas, rice yield was significantly correlated with N and P fertilizers, while SOC was significantly correlated with manure. When manure was applied every year, rice yield was significantly correlated with N fertilizer alone, while SOC was significantly correlated with manure alone. When manure application was applied every other year, rice yield was significantly correlated with N and P fertilizers, while SOC was significantly correlated with N fertilizer alone. In cases without manure application for more than 5 years, rice yield was significantly correlated with P fertilizer alone, while SOC was significantly correlated with N, P, and K fertilizers.
Table 8. Multiple regression equations used to predict SOC and rice yield using manure (M), N fertilizer (N), P fertilizer (P), and K fertilizer (K).
For all sites in rain-fed areas, rice yield was significantly correlated with application rates of manure, N and P fertilizers, while SOC was significantly correlated with application rates of manure and N fertilizer. If manure was applied every year, rice yield was significantly correlated with manure application rate only, while SOC was significantly correlated with application rates of manure and N fertilizer. When manure was applied every other year, rice yield and SOC were significantly correlated with N application rate only. If no manure was applied to the field for more than 5 years, rice yield and SOC were significantly correlated with application rates of P.
4. Discussion
4.1. Soil characteristics according to farming practices influencing SOC
SOC content is influenced by various regional factors, such as soil type, texture, topography, land use type, and management practices (Hao and Kravchenko Citation2007; Wang et al. Citation2012). Slightly higher SOC was found in the surface soil compared to the subsoil in this study. This might be due to lower of surface litter in the subsoil (Jobbágy and Jackson Citation2000). Furthermore, the accumulation of manure on the soil surface enriches SOM in the surface layer (Mathew et al. Citation2012). This result clearly showed that SOC accumulates in the surface soil, which is a normal phenomenon in tropical soils (Wong et al. Citation2008; Buol et al. Citation2011). Soil texture is also an important variable affecting SOC levels, because aggregation processes are favored by small particle sizes that provide high surface areas. Many studies (Konen et al. Citation2003; Zhao et al. Citation2006; Zinn et al. Citation2007; Arevalo et al. Citation2009; Gami et al. Citation2009; Schmitter et al. Citation2010; Chen et al. Citation2013) have found that SOC is significantly correlated with clay content. However, this study found no significant relationship between clay content and SOC (), while negative correlation between CEC and SOC was found. This is because the high sand content in soil results generally a low CEC due to the particles having no charge (Islam et al. Citation2014). Moreover, the main clay mineral in sandy soils in Northeast Thailand is kaolinite (Dur et al. Citation2005), a 1:1 clay mineral characterized by low CEC (Wattel-Koekkoek et al. Citation2001). These factors are the possible influencer, resulting in hard notice of the positive correlation between CEC and SOC. A few studies were consistent with our findings. For instant, Laopoolkit et al. (2011) found the relationship between SOC and clay is changing from positive in forest to negative in arable land in Northeast Plateau, Thailand. Islam et al. (Citation2014) found the highly negative correlation between CEC with SOC, Northeast Thailand. They explained that there might be difference in the type of clay mineral in other studies and could be other factors, such as a high salt content and limited rainfall that result in a high CEC but a low SOC. Furthermore, Hassink (Citation1994) mentioned that the relationship between SOC and sandy soil is unclear, probably because differences in individual soil particles do not create much variation to soil textural classes; consequently, particle size distribution might fail to produce a significant relationship with SOC. This issue suggests that adding manure is more important than soil texture for improving SOC. This hypothesis is supported by Smith and Elliott (Citation1990), who reported that the incorporation of organic materials to soil promotes the aggregation of soil particles. Thus, SOC increases or decreases in parallel with increasing or decreasing finer soil particles, respectively. Therefore, the fraction of finer soil particles of a given soil type represents an important predictor of SOC in the soil (Parton et al. Citation1987). Hassink (Citation1996) and Zhao et al. (Citation2006) reported that these trends may be due to the ability of clay and silt particles to absorb organic matter and to protect it from microbial decomposition. A highly significant positive correlation between EC and SOC was obviously seen () because salinization of soil in Northeast Thailand is frequently evident as salt patches in the surface soil during the dry season (Maeght et al. Citation2005). Moreover, the soil samplings in this study were collected in the dry season, and rain-fed areas (dry land) were mostly covered in this study area, resulting in higher EC in the surface soil than the subsoil layers. Iwai et al. (Citation2012) reported that EC increased in the dry season due to the capillary rise of salty groundwater associated with evaporation and low surface cover. On the other hand, EC decreased in the wet season due to desalinization and salt leaching associated with rainfall infiltration. Maeght et al. (Citation2005) found that a combination of flooding, puddling, and drainage reduced the level of salinity by 50% (initial EC > 4 mS cm−1). Soil pH is an important chemical property that is primarily attributed to low rice yield causing low nutrient return by organic materials. They offer many negatively charged sites to bind H+ in an acidic soil, or release H+ in a basic soil. Thus, increasing amount of organic materials in surface soil not only increase and stabilize soil pH in an acidic soil (McCauley et al. Citation2017), it can also increase SOC in sandy soil. This agrees with our result that soil pH had highly positive correlation with SOC () because rice straw and stubble were left in surface soil after harvest. Marschner (Citation2011) stated that acidic soils may limit the use efficiency of N, P, K, Ca, Mg, and Mo, as well as Al and Mn toxicity, which lead to low added nutrients and low crop yields. In the study area, the mean values of soil pH ranged from extremely acidic to slightly acidic in both irrigated and rain-fed areas (). Therefore, improved soil management requires a combination of organic and inorganic inputs, particularly manure that are related to C in the soils. Furthermore, fertilizer is required to improve soil fertility.
4.2. Effects of pertinent management practices on rice yield and SOC
This study clearly showed that manure and fertilizer application increased crop yield and SOC ( and ). Other studies have also observed that a combination of manure and chemical fertilizer enhances soil fertility and crop yield (Whitbread et al. 2003; Rasool et al. 2007), and might also benefit SOC sequestration in soil (Shimizu et al. Citation2015). SOC is higher in paddy soils compared to upland field soils, due to low organic matter decomposition caused by the presence of floodwater in paddy soils (Katoh Citation2003). Neue et al. (Citation1997) and a four-year study (1999–2002) by Yang et al. (Citation2005) concluded that increased SOC content in tropical paddy soils is probably caused by increased organic matter inputs and continuous waterlogging. Our results supported this assumption, showing that both SOC and rice yield are correlated with manure application in both irrigated and rain-fed areas (), with this phenomenon being more pronounced in irrigated areas compared to rain-fed areas (). This result supports the previous study in China, where SOC was found to be higher in paddy soils compared to dry cropland because the anaerobic conditions in flooded soils retain SOC (Pan et al. Citation2004).
In addition, incorporating green manure is useful to provide N, P, K, and other nutrients to soils (Vityakon et al. Citation2000). Banger et al. (Citation2009) observed that a sandy soil amended with farmyard manure had 36.1% higher SOC concentrations at 0–15-cm depth compared to soil without any manure. Buysse et al. (Citation2013) showed that application of fresh farmyard manure (30–60 Mg ha−1) to the soil once every 4 or 3 years causes significant increases in SOC (100 ± 50 kg C ha−1 yr−1) following a long-term experiment initiated in 1959 at a site in the Hesbaye Region of Belgium. Our results were in line with these studies that the sites where manure was applied every year, leading to higher rice yield and SOC than when manure was applied every other year or without manure application for more than 5 years (,)). Thus, enhanced SOC sequestration has a positive effect on rice yield (). Moreover, our results supported the findings of previous studies showing that the combination of chemical and organic fertilization is the most effective management practice for increasing crop yield and SOC sequestration (Bi et al. Citation2009; Yan et al. Citation2013). Lal (Citation2006) computed that every 1 Mg C ha−1 increase in the SOC pool could increase rice production by 10–50 kg ha−1 yr−1.
However, the rice yield in some irrigated areas was lower than that in rain-fed areas, such as at sites I14, I16, I17, I18, I19 I21, I22, I23, and I24. Two possible explanations exist. First, imbalanced chemical fertilizer application with low P and K were detected at sites, without manure application, such as at sites I16, I17, I21, and I22 (). Second, conventional tillage is the common practice of the farmers in this area, and is finished using a machine in a short period of time. This practice may be lead to inappropriate tillage causing soil degradation (Papendick and Parr Citation1997; Bertol et al. Citation2004) and nutrient depletion by water runoff (Bertol et al. Citation2007).
In rain-fed areas, Seng et al. (Citation2004) found that, when there was a temporary loss of water in flooded rice systems, straw incorporation increased P availability and uptake, increased soil pH, reduced Al toxicity, increased rice growth, and led to high crop yields. This phenomenon was also detected in this study at sites R12, R13, R14, R15, and R20. These sites had high manure application rates, water runoff was low, there was a temporary dry period, and high rice yield. However, fluctuations in nutrient availability are frequently reported in sandy soils, which have low SOM content and CEC (Haefele et al. 2006; Boling et al. Citation2008) causing a rapid drop in pH, high Al toxicity, and poor crop responses to fertilizers. This phenomenon occurs because of poor buffering capacities against changes to pH during the drying period (Ragland and Boonpuckdee Citation1988). Thus, the management of OM is essential to maintain CEC (Linquist et al. Citation2007).
4.3. Recommendation for suitable rice cultivation practices
This investigation showed that a combination of manure along with balanced N, P, and K fertilizer application increases SOC because soil organic material can be mineralized towards releasing the nutrient, which subsequently can be taken up by crops to increase crop yields. Thus, SOC is an important factor for determining crop yields. Site-specific management practice recommendations can be implemented as the multiple regression equations in , which indicated the key factors affecting rice yield and SOC. In irrigated area, to sustain rice yield, when manure is available every year or every other year, N and P fertilizers should be practiced because manure application can act as a source of nutrients (Manna et al. Citation2007). In rain-fed area, when manure application is available every year, applying manure alone can obtain the expected rice yield. In case of manure availability every other year, only N fertilizer should be applied. Non-application of application for more than 5 years and only P fertilizer application are not recommended for suitable practices in both irrigated and rain-fed areas that may cause lower crop yields than expected. This study suggests instead that when manure is not applied, N fertilizer application is required to be an essential nutrient for plant growth because fertilizer is readily available for crop uptake. More importantly, optimal N, P, and K fertilizer application rates and rehabilitation of irrigation infrastructure require immediate focus because they are major factors that increase rice yield and SOC.
5. Conclusions
This study recorded significant differences that were found in rice yield and SOC between irrigated and rain-fed areas. There were significant positive correlations between rice yield and manure and fertilizer application rates, but there was no significant correlation between SOC and clay content. To increase the average rice yield and SOC, a combination of high manure and fertilizer application rates should be implemented, representing a sustainably beneficial practice for both areas. The results of our study show that SOC and rice yield may be enhanced through the selection of the optimal N, P, and K fertilizer application rates, in parallel to increasing irrigation in Thailand.
Acknowledgments
This study was financially supported by the Japanese government under the Japan Society for the Promotion of Science (JSPS) RONPAKU (Dissertation PhD) Program. Moreover, the authors’ sincere gratitude is also extended to National Research Council of Thailand (NRCT) for their support to this study. The authors thank the reviewers for providing helpful comments to improve the manuscript.
Additional information
Funding
References
- Alam MM, Karim MDR, Ladha JK 2013: Integrating best management practice for rice with farmers’ crop management techniques: A potential option minimizing rice yield gap. Field. Crops. Res., 144, 61–68. doi:10.1016/j.fcr.2013.01.010
- Arevalo CBM, Bhatti JS, Chang SX, Sidders D 2009: Ecosystem carbon stocks and distribution under different land-uses in north central Alberta, Canada. Forest Ecol Manag, 257, 1776–1785. doi:10.1016/j.foreco.2009.01.034
- Arunrat N, Wang C, Pumijumnong N 2016: Alternative cropping systems for greenhouse gases mitigation in rice field: A case study in Phichit province of Thailand. J. Clean. Prod, 133, 657–671. doi:10.1016/j.jclepro.2016.05.137
- Bai SB, Wang J, Lu GN, Zhou PG, Hou SS, Xu SN 2010: GIS-based logistic regression for land slide susceptibility mapping of the Zhongxian segment in the three Gorges area China. Geomorphology, 115(1–2), 23–31. doi:10.1016/j.geomorph.2009.09.025
- Banger K, Kukal SS, Toor G, Sudhir K, Hanumanthraju TH 2009: Impact of long-term additions of chemical fertilizers and farm yard manure on carbon and nitrogen sequestration under rice-cowpea cropping system in semi-arid tropics. Plant. Soil, 318, 27–35. doi:10.1007/s11104-008-9813-z
- Bertol I, Albuquerque JA, Leite D, Amaral AJ, Zoldan WA Jr 2004: Physical soil properties of conventional tillage and no-tillage, in crop rotation and succession, compared with natural pasture. Rev. Bras Ciénc Solo, 28, 155–163. doi:10.1590/S0100-06832004000100015
- Bertol I, Cogo NP, Schick J, Guadagnin JC, Amaral AJ 2007: Financial aspects of nutrient losses by water erosion in different soil management systems. Rev. Bras Ciénc Solo, 31, 133–142. doi:10.1590/S0100-06832007000100014
- Bhattacharyya R, Prakash V, Kundu S, Srivastva AK, Gupta HS, Mitra S 2010: Long term effects of fertilization on carbon and nitrogen sequestration and aggregate associated carbon and nitrogen in the Indian sub-Himalayas. Nutr. Cycl Agroecosys, 86(1), 1–16. doi:10.1007/s10705-009-9270-y
- Bi LD, Zhang B, Liu GRet al. 2009: Long-term effects of organic amendments on the rice yields for double rice cropping systems in subtropical China. Agric. Ecosyst. Environ, 129, 534–541. doi:10.1016/j.agee.2008.11.007
- Boling AA, Tuong TP, Suganda H, Konboon Y, Harnpichitvitaya D, Bouman BAM, Franco DT 2008: The effect of toposequence position on soil properties, hydrology, and yield of rainfed lowland rice in Southeast Asia. Field Crops. Res., 106, 22–33. doi:10.1016/j.fcr.2007.10.013
- Bray RA, Kurtz LT 1945: Determination of total organic and available form of phosphorus in soil. Soil Sci., 59, 39–45. doi:10.1097/00010694-194501000-00006
- Buol SW, Southard RJ, Graham RC, McDaniel PA 2011: Soil Genesis and Classification. pp. 6thed. John Wiley & Sons, Inc, Essex, UK.
- Buysse P, Roisin C, Aubinet M 2013: Fifty years of contrasted residue management of an agricultural crop: impacts on the soil carbon budget and on soil heterotrophic respiration. Agri. Ecosyst. Environ., 167, 52–59. doi:10.1016/j.agee.2013.01.006
- Chantanaparb N, Cholitkul W, Suwanawong S 1976: Fertility of Thai Paddy Soils. Report on Soil Chemistry and Fertility No. 2. Department of Agriculture, Bangkok.
- Chen H, Li X, Hu F, Shi W 2013: Soil nitrous oxide emissions following crop residue addition: a meta-analysis. Glob. Chang. Biol, 19, 2956–2964. doi:10.1111/gcb.12274
- Dur J, Wiriyakitnateekul W, Lesturgez G, Elsass F, Pernes M, Hartmann C, Tessier D 2005: Clay mineral dissolution following intensive cultivation in a tropical sandy soil. In: Proceedings of Management of Tropical Sandy Soils for Sustainable Agriculture: A holistic approach for sustainable development of problem soils in the tropics. 27th November-2nd December 2005, Khon Kaen, Thailand.
- Gami SK, Duxbury JM, Lauren GJ 2009: Influence of soil texture and cultivation on carbon and nitrogen levels in soils of the eastern Indo-Gangetic Plains. Geoderma, 153(3–4), 304–311. doi:10.1016/j.geoderma.2009.08.003
- George, H., 2003. An overview of land evaluation and land use planning at FAO. Land and Plant Nutrition Management Service (AGLL- FAO). Accessed on 12 September 2015, http://www.fao.org/fileadmin/templates/nr/images/resources/images/landevaluationatfao.doc
- Haefele SM, Naklang K, Harnpichitvitaya D, Jearakongman S, Skulkhu E, Romyen P, Phasopa S, Tabtim S, Suriya-arunroj D, Khunthasuvon S, Kraisorakul D, Youngsuk P, Amarante ST, Wade LJ 2006: Factors affecting rice yield and fertilizer response in rainfed lowlands of northeast Thailand. Field Crops Res. 98, 39–51. doi:10.1016/j.fcr.2005.12.003
- Hao XY, Kravchenko AN 2007: Management practice effects on surface soil total carbon: differences along a textural gradient. Agron. J, 99, 18–26. doi:10.2134/agronj2005.0352
- Hassink J 1994: Effects of soil texture and grassland management on soil organic C and N and rates of C and N mineralization. Soil Biol. Biochem., 26(9), 1221–1231. doi:10.1016/0038-0717(94)90147-3
- Hassink J 1996: Preservation of plant residues in soils differing in unsaturated protective capacity. Soil. Sci. Soc. Am. J, 60, 487–491. doi:10.2136/sssaj1996.03615995006000020021x
- Heng LK, Asseng S, El Mejahed K, Rusan MM, Keerthisinghe G 2005: Optimizing wheat productivity under rainfed environments of West Asia and North Africa using simulation model. In: international Atomic Energy Agency: nutrient and water management practices for increasing crop production in rainfed arid/semi-arid areas. In Proceedings of a coordinated research project, October 2005. IAEA-TECDOC-1468. Vienna.
- Huang Y, Zou JW, Zheng XH, Wang YS, Xu XK 2004: Nitrous oxide emissions as influenced by amendment of plant residues with different C: N ratios. Soil Biol. Biochem., 36, 973–981. doi:10.1016/j.soilbio.2004.02.009
- Islam KK, Anusontpornperm S, Kheoruenromne I, Thanachit S 2014: Relationship between carbon sequestration and physico-chemical properties of soils in salt-affected areas, Northeast Thailand. Kasetsart J. (Nat. Sci.), 48, 560–576.
- Iwai CB, Oo AN, Topark-Ngarm B 2012: Soil property and microbial activity in natural salt affected soils in an alternating wet–dry tropical climate. Geoderma, 189-190, 144–152. doi:10.1016/j.geoderma.2012.05.001
- Jobbágy EG, Jackson RB 2000: The vertical distribution of soil organic carbon and its relation to climate and vegetation. Ecological Appl., 10(2), 423–436. doi:10.2307/2641104
- Katoh T 2003: Carbon accumulation in soils by soil management, mainly by organic matter application-Experimental results in Aichi prefecture. Jpn. J. Soil Sci. Plant Nutr., 73, 193–201.
- Konen ME, Burras CL, Sandor JA 2003: Organic carbon, texture, and quantitative color measurement relationships for cultivated soils in north central Iowa. Soil. Sci. Soc. Am. J, 67, 1823–1830. doi:10.2136/sssaj2003.1823
- Lal R 2006: Enhancing crop yields in the developing countries through restoration of the soil organic carbon pool in agricultural lands. Land Degrad. Develop, 17, 197–209. doi:10.1002/ldr.696
- Land Development Department (LDD) 1991: Distribution of Salt Affected Soil in the Northeast Region 1:100,000 Map. Land Development Department, Ministry of Agriculture and Cooperatives, Thailand.
- Laopoolkit, K. Kheoruenromne, I., Suddhiprakarn, A., 2011. Factors Controlling Carbon Sequestration of Major Upland Soils in Northeast Plateau, Thailand. Thai Journal of Agricultural Science, 44(2): 133–143
- LDD 2003: Characterization of Established Soil Series in the Northeast Region of Thailand Reclassified according to Soil Taxonomy 2003. Land Development Department, Ministry of Agriculture and Cooperatives, Thailand.
- Limtong, P., Anecksamphant, C., Leaungvutivirog, C., Srikhajon, M., 2004. Soil organic carbon and carbon sequestration: The present situation and research needs in Thailand. Land Development Department, Bangkok, Thailand. Accessed on 20 September 2015, https://biblio.uvci.edu.ci/record/11626/files/23-465-476.pdf
- Linh TB, Cornelis W, Elsacker SV, Khoa LV 2014: Socio-economic evaluation on how crop rotations on clayey soils affect rice yield and farmers’ income in the Mekong Delta, Vietnam. Int. J. Environ. Rural Dev., 4(2),62–68.
- Linquist BA, Phengsouvanna V, Sengxua P 2007: Benefits of organic residues and chemical fertilizer to productivity of rain-fed lowland rice and to soil nutrient balances. Nutr. Cycl Agroecosyst, 79, 59–72. doi:10.1007/s10705-007-9095-5
- Loveland P, Webb J 2003: Is there a critical level of organic matter in the agricultural soils of temperate regions? A review. Soil Till Res., 70, 1–18. doi:10.1016/S0167-1987(02)00139-3
- Lu F, Wang X, Han B, Ouyang Z, Duan X, Zheng H, Miao H 2009: Soil carbon sequestrations by nitrogen fertilizer application, straw return and no-tillage in China’s cropland. Glob. Change Biol., 15, 281–305. doi:10.1111/j.1365-2486.2008.01743.x
- Maat H 2011: The history and future of agricultural experiments. NJAS – Wageningen J. Life Sci., 57, 187–195. doi:10.1016/j.njas.2010.11.001
- Maeght JL, Grungerger O, Hammecker C, Sukchan S, Hartmann C, Wiriyakinateekul W 2005: Salinity control by farmers practices in sandy soil. In: Proceedings of Management of Tropical Sandy Soils for Sustainable Agriculture: A holistic approach for sustainable development of problem soils in the tropics. 27th November-2nd December 2005, Khon Kaen, Thailand.
- Manna MC, Swarup A, Wanjari RH, Ravankar HN 2007: Long-term effect of NPK fertilizer and manure on soil fertility and a sorghum-wheat farming system. Aust. J. Exp. Agric., 47, 700–711. doi:10.1071/EA05105
- Marschner H 2011: Marschner’s Mineral Nutrition of Higher Plants, 3rd ed., p. 672, Academic Press, London, UK.
- Mathew RP, Feng Y, Githinji L, Ankumah R, Balkcom KS 2012: Impact of no-tillage and conventional tillage systems on soil microbial communities. Appl. Environ. Soil Sci., 2012, 1–10. doi:10.1155/2012/548620
- McCauley A, Jones C, Olson-Rutz K 2017: Soil pH and Organic Matter. Nutrient Management Module No. 8. Montana State University. USA. Accessed on 30 March 2017 http://landresources.montana.edu/nm/documents/NM8.pdf
- National Soil Survey Center 1996: Soil Survey Laboratory Methods Manual. Soil Survey Investigations Report No. 42 Version 3.0. United States Department of Agriculture Natural Resources Conservation Service. Lincoln, NE. Accessed on 10 May 2014: https://www.nrcs.usda.gov/Internet/FSE_DOCUMENTS/16/nrcs143_019356.pdf
- Neue HU, Gaunt JL, Wang ZP, Becker-Heidmann P, Quijano C 1997: Carbon in tropical wetlands. Geoderma, 79, 163–185. doi:10.1016/S0016-7061(97)00041-4
- Nguyen NV 2006: Global Climate Changes and Rice Food Security. Executive Secretary, International Rice Commission. FAO, Rome, Italy.
- OAE (Office of Agricultural Economics) 2014: Agricultural Statistics of Thailand; 2014. http://www.oae.go.th/download/download_journal/2558/yearbook57.pdf (in Thai); (February, 2015
- Oo AN, Banterng P, Polthanee A, Trelo-Ges V 2010: The effect of different fertilizers management strategies on growth and yield of upland black glutinous rice and soil property. Asian J. Plant Sciences, 9(7), 414–422. doi:10.3923/ajps.2010.414.422
- Pan GX, Li LQ, Wu L, Zhang XH 2004: Storage and sequestration potential of topsoil organic carbon in China’s paddy soil. Glob. Change Biol., 10, 79–92. doi:10.1111/j.1365-2486.2003.00717.x
- Pan GX, Zhou P, Li ZP, Smith P, Li LQ, Qiu DS, Zhang XH, Xu XBShen SY, Chen XM 2009: Combined inorganic/organic fertilization enhances N efficiency and increases rice productivity through organic carbon accumulation in a rice paddy from the Tai Lake region, China. Agric Ecosyst Environ, 131(3–4), 274–80. doi:10.1016/j.agee.2009.01.020
- Papendick RI, Parr JF 1997: No-till farming: the way of the future for a sustainable dryland agriculture. Ann. Arid. Zone, 36, 193–208.
- Parry M, Rosenzweig C, Iglesias A, Liermore M, Fischer G 2004: Effects of climate change on global food production under sres emissions and socio-economic scenarios. Glob. Environ. Change, 14(1), 53–67. doi:10.1016/j.gloenvcha.2003.10.008
- Parton WJ, Schimel DS, Cole CV, Ojima DS 1987: Analysis of factors controlling soil organic levels of grasslands in Great Plains. Soil. Sci. Soc. Am. J, 51, 1173–1179. doi:10.2136/sssaj1987.03615995005100050015x
- Ragland J, Boonpuckdee L 1988: Fertilizer responses in northeast Thailand: 3. Nitrogen useand soil acidity. Thai J. Soils Fert, 10, 67–76.
- Rasool R, Kukal SS, Hira GS 2007: Soil physical fertility and crop performance as affected by long term application of FYM and inorganic fertilizers in rice-wheat system. Soil and Till Res, 96(1–2), 64–72. doi:10.1016/j.still.2007.02.011
- Sahrawat KL 2004: Organic matter accumulation in submerged soils. Adv. Agron., 81, 169–201. doi:10.1016/S0065-2113(03)81004-0
- Saree S, Ponphang-Nga P, Sarobol E, Limtong P, Chidthaisong A 2012: Soil carbon sequestration affected by cropping changes from upland maize to flooded rice cultivation. Sustain. Energy. Environ., 3, 147–152.
- Satyanarayana V, Vera Prasad PV, Murthy VRK, Boote KJ 2002: Influence of integrated use of farmyard manure and inorganic fertilizers on yield and yield components of irrigated low land rice. J of Plant Nutri, 25, 2081–2090. doi:10.1081/PLN-120014062
- Schmitter P, Dercon G, Hilger T, Thi Le Ha T, HuuThanh N, Lam N, Due Vien T, Cadisch G 2010: Sediment induced soil spatial variation in paddy fields of Northwest Vietnam. Geoderma, 155, 298–307. doi:10.1016/j.geoderma.2009.12.014
- Seng V, Bell RW, Willet IR 2004: Amelioration of growth reduction of lowland rice caused by a temporary loss of soil-water saturation. Plant. Soil, 265, 1–16. doi:10.1007/s11104-005-0694-0
- Shimizu M, Limin A, Desyatkin AR, Jin T, Mano M, Ono K, Miyata A, Hata H, Hatano R 2015: Effect of manure application on seasonal carbon fluxes in a temperate managed grassland in Southern Hokkaido, Japan. CATENA, 133, 474–485. doi:10.1016/j.catena.2015.05.011
- Smith JL, Elliott LF 1990: Tillage and Residue management effects on soil organic matter dynamics in semi arid regions. Adv. Soil Sci., 13, 69–87. doi:10.1007/978-1-4613-8982-8_4
- Srinivasarao CH, Venkateswarlu B, Lal R, Singh AK, Vittal KPR, Kundu S, Gajanan GN, Ramachandrappa B 2012: Long-term effects of crop residues and fertility management on carbon sequestration and agronomic productivity of groundnut finger millet rotation on an alfisol in southern India. Int. J. Agri Sustain, 10(3), 1–15. doi:10.1080/14735903.2012.662392
- Surekha K, Kumari APP, Reddy MN, Satyanarayana K, Cruz PCS 2003: Crop residue management to sustain soil fertility and irrigated rice yields. Nutr. Cycl. Agroecosyst, 67, 145–154. doi:10.1023/A:1025543810663
- Thomas GW 1996: Soil pH and soil acidity. In Method of Soil Analysis, Part 3: chemical Methods, Eds. Sparks DL, Page AL, Helmke PA, Loeppert RH, Soltanpour PN, Tabatabai MA, Johnston CT, Sumner ME, pp. 475–490. SSSA Inc., ASA Inc, Madison, WI, USA.
- United States Department of Agriculture (USDA) 1954: Diagnosis and Improvement of Saline and Alkali Soils, Agriculture. Handbook No. 60, U.S. Salinity Laboratory. Government Printing Office, Washington, DC.
- Vityakon P, Meepech S, Cadisch G, Toomsan B 2000: Soil organic matter and nitrogen transformation mediated by plant residues of different qualities in sandy acid upland and paddy soils. Netherlands J. Agri Scie, 48, 75–90. doi:10.1016/S1573-5214(00)80006-8
- Walkley A, Black JA 1934: An examination of the dichormate method for determining soil organic matter and a proposed modification of the chromic acid titration method. Soil Sci., 37, 29–38. doi:10.1097/00010694-193401000-00003
- Wang SF, Wang XK, Ouyang ZY 2012: Effects of land use, climate, topography and soil properties on region soil organic carbon and total nitrogen in the upstream watershed of Miyun reservoir, North China. J. Environ. Sci., 24(3), 387–395. doi:10.1016/S1001-0742(11)60789-4
- Wassmann R, Dobermann A 2007: Climate change adaptation through rice production in regions with high poverty levels. J. ICRISAT Agric. Res., 4(1), 1–24.
- Wattel-Koekkoek EJW, Buurman P, Van der Plicht J, Wattel E, Vallaeys T, Van Breemen N 2001: Amount and composition of clay-associated soil organic matter in a range of kaolinitic and smectitic soils. Geoderma, 99, 27–49. doi:10.1016/S0016-7061(00)00062-8
- West TO, Post WM 2002: Soil organic carbon sequestration rates by tillage and crop rotation: a global data analysis. Soil Sci. Soc. Am. J., 66, 1930–1946. doi:10.3334/CDIAC/tcm.002
- Whitbread A, Blair G, Konboon Y, Lefroy R, Naklang K 2003: Managing crop residues, fertilizers and leaf litters to improve soil C, nutrient balances, and the grain yield of rice and wheat cropping systems in Thailand and Australia. Agric Ecosyst Environ, 100, 251–263. doi:10.1016/S0167-8809(03)00189-0
- Witt C, Cassman KG, Olk DC, Biker U, Liboon SP, Samson MI, Ottow JCG 2000: Crop rotation and residue management effects on carbon sequestration, nitrogen cycling and productivity of irrigated rice systems. Plant. Soil, 225, 263–278. doi:10.1023/A:1026594118145
- Wong VNL, Murphy BW, Koen TB, Greene RSB 2008: Soil organic carbon stocks in saline and sodic landscapes. Soil Res., 46(4), 378–389. doi:10.1111/j.1475-2743.2009.00251.x
- Yan X, Zhou H, Zhu QH, Wang XF, Zhang YZ, Yu XC, Peng X 2013: Carbon sequestration efficiency in paddy soil and upland soil under long-term fertilization in southern China. Soil. Till Res., 130, 42–51. doi:10.1016/j.still.2013.01.013
- Yang C, Yang L, Ouyang Z 2005: Organic carbon and its fractions in paddy soil as affected by different nutrient and water regimes. Geoderma, 124, 133–142. doi:10.1016/j.geoderma.2004.04.008
- Zhang H, Xu M, Zhang F 2009: Long-term effects of manure application on grain yield under different cropping systems and ecological conditions in China. J. Agric. Sci., 147, 31–42. doi:10.1017/S0021859608008265
- Zhang MK, He ZL 2004: Long-term changes in organic carbon and nutrients of an Ultisol under rice cropping in southeast China. Geoderma, 118, 167–179. doi:10.1016/S0016-7061(03)00191-5
- Zhang WJ, Wang XJ, Xu MG, Huang SM, Liu H, Peng C 2010: Soil organic carbon dynamics under long-term fertilizations in arable land of northern China. Biogeosciences, 7, 409–425. doi:10.5194/bg-7-409-2010
- Zhao LP, Sun YJ, Zhang XP, Yang XM, Drury CF 2006: Soil organic carbon in clay and silt sized particles in Chinese mollisols: relationship to the predicted capacity. Geoderma, 132, 315–323. doi:10.1016/j.geoderma.2005.04.026
- Zhao XN, Hu KL, Li KJ, Wang P, Ma YL, Stahr K 2013: Effect of optimal irrigation, different fertilization, and reduced tillage on soil organic carbon storage and crop yields in the North China Plain. J. Plant Nutr. Soil Sci., 176, 89–98. doi:10.1002/jpln.201100353
- Zinn YL, Lal R, Resck DVS 2007: Edaphic controls on soil organic carbon relation in the Brazilian Cerrado: texture and mineralogy. Soil. Sci. Soc. Am. J, 71, 1204–1214. doi:10.2136/sssaj2006.0015