
ABSTRACT
Vietnam is the world’s fifth largest rice producing country. Since methane (CH4), a potent greenhouse gas (GHG), emission from the rice cultivation accounts for 14.6% of the national anthropogenic GHG emission, developing and disseminating mitigation options are the urgent need. Alternate wetting and drying (AWD) is the irrigation technique, in which a paddy field encompasses several soil-drying phases during the growth period, thereby reducing the CH4 emission. However, field trials of the AWD’s feasibility in Central Vietnam are limited so far. We therefore carried out a 3-year experiment in a farmer’s field both in winter–spring season and summer–autumn season. CH4 and nitrous oxide (N2O) emissions were compared among the three treatments of water management: continuous flooding (CF), AWD, and site-specific AWD (AWDS) that changed the degree of soil drying depending on the growth stage. The total water use including irrigation and rainfall was significantly (p < 0.05) reduced by AWD (by 15%) and AWDS (by 14%) compared to CF, but rice grain yield did not differ among the three treatments. The seasonal cumulative CH4 emission was significantly reduced by AWD (26%) and AWDS (26%) compared to CF, whereas the seasonal cumulative N2O emission did not differ among treatments. The resultant global warming potentials (GWPs) of CH4 and N2O under AWD and AWDS were 26% and 29% smaller than that under CF, respectively. The GWP of N2O was only 0.8% of the total GWP of CH4 + N2O. The yield-scaled GWP and water productivity (i.e., the ratio of grain yield to water use) were also improved by AWD and AWDS. No significant differences in the measured items between AWD and AWDS were attributed to similar variation patterns in the surface water level. The results confirm the AWD’s performance as a mitigation option for paddy GHG emission in Central Vietnam.
1. Introduction
Global warming is one of the most pressing issues facing our planet. The major attributor is the increase in the atmospheric concentrations of greenhouse gases (GHGs). Carbon dioxide (CO2), methane (CH4), and nitrous oxide (N2O) are the top three GHGs, accounting for 64%, 17%, and 6%, respectively, of the total radiative forcing (Myhre et al. Citation2013). The increase of the three GHGs in the atmosphere is caused by anthropogenic emissions from land use and land-use changes, particularly agriculture, as well as from the use of fossil fuel as a source of energy (Ciais et al. Citation2013).
Rice cultivation is a major CH4 source that accounts for 9.0–13.2% of the total anthropogenic emission (Ciais et al. Citation2013). Due to the development of soil reductive conditions after field flooding, CH4 is produced by methanogenic archaea in the soil. In Asia, traditional rice cultivation uses continuously flooding as water regime. However, continuous flooding (CF) enhances CH4 emission from the soil. In contrast, draining the flooded field can effectively reduce the CH4 emission (e.g., Smith and Conen Citation2004; Yan et al. Citation2003; Itoh et al. Citation2011). IPCC designates 0.52 as the scaling factor of paddy CH4 emission for multiple aerations in irrigated rice cultivation (IPCC Citation2006).
Alternate wetting and drying (AWD) is a method of multiple aerations which was developed by the International Rice Research Institute and its partners to reduce the consumption of irrigation water (Lampayan et al. Citation2004). Barker et al. (Citation1999) reported that irrigating rice paddies consumed more than 45% of the total fresh water used in Asia. In AWD, irrigation water is supplied when soil water potential at 15 cm below the soil surface reaches −10 to −30 kPa or when the surface water level declines to 15 cm below the soil surface. Previous studies found that AWD reduced water input and kept rice grain yield at normal level (or even increased) because of the enhancement in root growth, grain-filling rate, and remobilization of carbon reserves from vegetative tissues to grains (Yang et al. Citation2007; Zhang et al. Citation2008). Furthermore, while CH4 emission was reduced by 40–70%, AWD could increase N02 emissions from paddy fields in the world (e.g., Wassmann et al. Citation2000; Farooq et al. Citation2009; Pandey et al. Citation2014; Tarlera et al. Citation2016).
Vietnam is the world’s fifth largest rice producer and the second largest rice exporter (GRiSP Citation2013). Rice is Vietnam’s main food product, accounting for about 70% of the gross production of all food crops (Ho et al. Citation2011). However, rice cultivation is also the largest GHG source in the agriculture sector in Vietnam. According to the First Biennial Update Report submitted to the UNFCCC (MONRE Citation2014), CH4 emission from paddy fields was estimated to be 50.5% of the agricultural GHG emission (in other words, 14.6% of the national GHG emission) in Vietnam. These figures corroborate the quantitative significance of rice cultivation for the national GHG budget in Vietnam. Therefore, the adoptation of AWD to Vietnam’s rice cultivation will substantially contribute to the reduction in the national GHG emission.
Vietnam can be divided into the following ecological regions: northeast, northwest, and Red River Delta (RRD) in the north, north-central coast, south-central coast, and central highland in the central, northeast south and Mekong River Delta (MRD) in the south (Nguyen Citation2002; Michael and Andreas Citation2004). In the north, the temperatures are subtropical. Shifting seasonal wind patterns result in dry and cold winters and wet summers. The central areas typify the tropical monsoon climate, with high temperatures and abundant precipitation. In the south, distinct wet and dry periods are evident, but temperatures are higher than in the north. The alluvial soil of the RRD has texture mainly medium to heavy, pH is usually neutral, and the content of organic matter is moderate. The alluvial soils in central areas are more acidic with a pH below 7 and lower fertile than alluvial soil of the RRD and the MRD. The alluvial soils of the MRD also have similar fertility characteristics of alluvial soil in the RRD; however, the texture is heavier (Le and Pham Citation2015). Although several field experiments for paddy CH4 emission have been conducted in the RRD, Northern Vietnam (Vu et al. Citation2015; Pandey et al. Citation2014) and the MRD, Southern Vietnam (Arai et al. Citation2015), the existing dataset is still scarce for Central Vietnam (e.g., Tirol-Padre et al. Citation2017).
Vietnam has ratified the Paris Agreement of COP21 and submitted its Intended Nationally Determined Contribution (INDC) to the UNFCCC. In the INDC, Vietnam highlights the challenge of large-scale implementation of mitigation options in the agriculture sector and identifies rice production as important subsector. In the INDC implementation plan, the Ministry of Agriculture and Rural Development identifies AWD as the priority mitigation option and plans to adopt AWD to 0.2 million ha without international support and to 0.5 million ha with international support (MONRE Citation2015). However, limited data on baseline emissions as well as on the potential of CH4 emission reduction by AWD in different paddy ecosystems of Vietnam impede a precise estimation of GHG reductions to be achieved.
The objectives of this study were (1) to establish the baseline GHG emission from a paddy field in Central Vietnam and (2) to investigate the feasibility of AWD in terms of GHG emission, rice productivity, and water use. This study conducted a 3-year field experiment in a farmer’s field to measure the emission of CH4 and N2O under different water management practices. Potential trade-offs and co-benefits in terms of rice productivity and water use were also examined.
2. Materials and methods
2.1. Site and experimental description
A 3-year experiment was conducted at a local farmer’s paddy field in Huong An commune, Huong Tra district, Thua Thien Hue Province, Central Vietnam (16°28′16″N; 107°31′26″E) during six consecutive cropping seasons (CSs) from 2013 to 2016. The six seasons were winter–spring 2013–2014 (WS1), summer–autumn 2014 (SA1), winter–spring 2014–2015 (WS2), summer–autumn 2015 (SA2), winter–spring 2015–2016 (WS3), and summer–autumn 2016 (SA3). Mean annual air temperature and mean annual rainfall are 25°C and 2500 mm, respectively. The soil at the experimental site is classified as Dystric Fluvisols following FAO–UNESCO (Le and Pham Citation2015). The detail of soil properties is given in .
Table 1. Soil properties of the experimental site.
The experimental factor was three treatments of water management: CF, AWD, and site-specific AWD (AWDS). The experimental plots (each of 5 m × 6 m) were arranged in a randomized complete block design with three replications. In CF treatment, the plots were flooded at 3–5 cm above the soil surface from 5 to 7 days after sowing (DAS) and drained 7–10 days before harvest. The AWD treatment followed so-called safe AWD, in which the plots were irrigated whenever the surface water level dropped to 15 cm below the soil surface. The AWD was started from 10 DAS but the plots were kept flooded during the flowering stage of rice plants. In AWDS treatment, the criteria of re-irrigation were changed from AWD treatment depending on the rice growth stage. That is, the plots were irrigated when the surface water level dropped to 5, 10, and 15 cm below the soil surface at early tillering stage (10–30 DAS), late tillering stage (30–45 DAS), and grain filling and ripening stage, respectively.
shows the calendar of rice cultivation practices in each CS. Rice seeds of HT1 variety were directly sowed into the field at a rate of 100 kg ha−1. Method and rate of chemical fertilizer application followed the recommendation by the Provincial Department of Agriculture. A microbial organic fertilizer (Song Gianh; 15% of organic carbon, 2.5% of humic acid, 1.5% of available P2O5) was applied at a rate of 1 Mg ha−1. Lime was applied at a rate of 400 kg ha−1 at one week before seed sowing. In the first two seasons, 35-cm rice stubbles from the previous crop were left in the field and incorporated during wet fallow season before WS and dry fallow season before SA. In the following four seasons, 10-cm rice stubbles from the previous crop were left and then incorporated in the same way.
Table 2. Rice cropping calendar in the winter–spring (WS) and summer–autumn (SA) seasons.
2.2. Measurements
The closed chamber technique was used to measure CH4 and N2O fluxes following the guidelines by Minamikawa et al. (Citation2015). Three chambers were placed on each of the nine plots. A plastic round base with a diameter of 50 cm was inserted about 10 cm into the soil at a location representing the average plant density in each plot. These bases were installed at least a day before the first gas sampling and were left in the field throughout the growth period. The base height and water depth inside the frames were measured on each gas sampling day. The round chamber fabricated from a plastic pail with a height of 70 cm (120-L volume) was equipped with a thermometer, a gas-sampling port, and a battery-operated fan.
Regular gas sampling was conducted weekly throughout the growth period during mid-morning (8:00–10:00 AM). Additional gas samplings were performed on 1, 2, 3, 4, and 5 days after nitrogen (N) fertilizer application. The gas samples were collected using a 60-mL syringe fitted with a stopcock at 0, 6, 12, 20, and 30 min after chamber closure. A 6-mL non-evacuated glass vial was washed with ca. 40-mL sample gas using a double-needle technique, and then, the sample was stored under pressure.
The CH4 and N2O concentrations in the gas samples were analyzed with a gas chromatograph (8610C, SRI Instruments, CA, USA) equipped with a flame ionization detector (FID) for the analysis of CH4 and an electron capture detector (ECD) for the analysis of N2O. The columns for the analysis of CH4 and N2O were packed with Porapak Q (50–80 mesh) and the carrier gas used for both FID and ECD was dinitrogen (N2). Because of the malfunction of ECD during the third year, no N2O and GWP were recorded for WS3 and SA3. Only 2 years (four seasons) data, which were quite consistent, were used in statistical analyses of N2O emission and GWP.
Methane and N2O emission rates were computed based on the ideal gas law, using chamber air temperature values measured at the time of sampling. For calculating the total CH4 and N2O emitted for a sampling interval, the measurements taken in the morning were assumed to represent daily average flux rates (Minamikawa et al. Citation2012). It was further assumed that flux changes between two consecutive sampling days are linear. The seasonal cumulative emission was calculated as the sum of the daily emissions. Hourly, CH4 and N2O fluxes were computed from the linear regression between gas concentration and the sampling time using the equation given in Minamikawa et al. (Citation2015). The global warming potential (GWP) of CH4 and N2O was calculated using the IPCC’s GWPs for 100-year time horizon with inclusion of climate-carbon feedbacks (34 for CH4 and 298 for N2O; Myhre et al. Citation2013).
Rice grain yield was determined from a 5-m2 area in each plot. Weather data (daily rainfall, and daily maximum and minimum air temperatures) were collected from nearby weather station. The amount of irrigation water to each plot was measured using a flow meter installed in the irrigation pump. The yield-scaled GWP was calculated by dividing the GWP of CH4 and N2O by the grain yield. The water productivity (WP), the ratio of the grain yield to the total volume of water used (irrigation and rainfall), was calculated.
2.3. Statistical analysis
We conducted an analysis of variance using a split-plot design, where CS was treated as the whole-plot factor and treatment (water management: CF, AWD, AWDS) as the split-plot factor, with three replications. To test differences in CS between WS and SA, we separated the sums of squares for the whole-plot components into the following sources of variation: between WS and SA (WS–SA), within WS, and within SA. For the split-plot factors, we examined the main effect of water treatment (T) and its interaction with CS. We also separated the sums of squares of the interaction term (T × CS) into the following sources of variation: T × WS–SA, T × WS, T × SA. Because the emissions of CH4 and N2O showed highly skewed distributions and violated normality and homoscedasticity assumptions, the Box–Cox transformation was conducted for CH4, N2O, GWP, and yield-scaled GWP using the ‘powerTransform’ function in the ‘car’ package of R (Box and Cox Citation1964; Fox and Weisberg Citation2011). To test differences among water managements, Tukey’s HSD (Honest Significant Difference) test was performed with a significance level of 0.05.
3. Results
3.1. Water use and rice grain yield
In the first and third years, WS was relatively drier than SA. However, this trend was reversed in the second year, in which more rainfall was recorded in WS than in SA (–F and A–F). The surface water level was well managed for all the three treatments (–I and G–I). The total water use (irrigation water + rainfall) was slightly greater in SA than in WS (; see Supplementary Table S1 for each of the six seasons) due to the greater mean rainfall during SA (283 mm) than WS (251 mm). Irrigation water use was slightly greater in WS (4838 m3 ha−1) than in SA (4731 m3 ha−1). The water use under AWD and AWDS was significantly smaller by 15% and 14%, respectively, during WS and 15% and 14%, respectively, during SA, than those under CF. Water saving efficiency under AWD and AWDS differed among seasons.
Table 3. Seasonal CH4 and N2O emissions, GWP, rice grain yield, yield-scaled GWP, total water use, and water productivity as affected by cropping season and water management.
Figure 1. Seasonal variations in daily rainfall (A, B, C), daily maximum and minimum air temperature (D, E, F), mean surface water level (G, H, I), CH4 flux (J, K, L), and N2O flux (M, N, O) for three water management practices in the first, second, and third winter–spring seasons (WS). Error bars for CH4 and N2O fluxes indicate the standard error (n = 3). Vertical dotted lines indicate the application timing of nitrogen fertilizer.
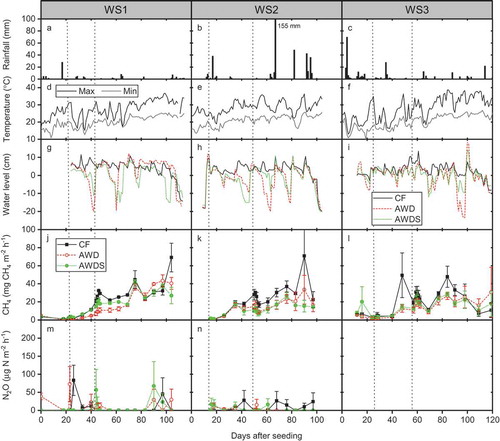
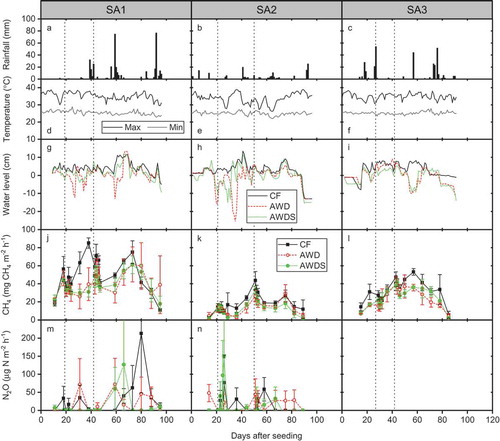
Figure 2. Seasonal variations in daily rainfall (A, B, C), daily maximum and minimum air temperature (D, E, F), mean surface water level (G, H, I), CH4 flux (J, K, L), and N2O flux (M, N, O) for three water management practices in the first, second, and third summer–autumn seasons (SA). Error bars for CH4 and N2O fluxes indicate the standard error (n = 3). Vertical dotted lines indicate the application timing of nitrogen fertilizer.
Rice grain yield significantly varied among the three WSs and among the three SAs (). However, the effect of the difference between WS and SA was marginal (p < 0.10). There was no significant difference in the grain yield among treatments although the yield under AWD and AWDS tended to be greater than that under CF (p = 0.114).
3.2. CH4 and N2O emissions
The seasonal variation pattern of CH4 flux was distinct between WS and SA, and the slower increase was observed in WS than in SA (–L and J–L). The magnitude of CH4 flux was comparable among seasons except for SA1 (). Among the three treatments, the variation pattern was similar but the magnitude was lower under AWD and AWDS than under CF.
The effects of CS and treatment were significant on the seasonal cumulative CH4 emission (). Although the difference between WS and SA was marginal (p < 0.10, 26% smaller in WS), the exceptionally greater emission in SA1 (Supplementary Table S1) caused the significant effect of CS. The seasonal cumulative emissions both under AWD and AWDS were 26% smaller than that under CF.
The seasonal variation pattern in N2O flux was sporadic regardless of treatment, and the temporal peaks were often observed after N fertilizer application and when the soil was drying toward harvest (,N and M,N). The seasonal cumulative N2O emission was significantly affected only by CS, and the emission in SA was 2.5 times greater than in WS ().
3.3. GWP, yield-scaled GWP, and WP
There were significant effects of CS and treatment on the GWP of CH4 and N2O (). The contribution of N2O to the GWP was only 0.5% in WS and 0.9% in SA regardless of treatment. The GWP in WS was 31% smaller than that in SA. The GWPs under AWD and AWDS were 26% and 29% smaller than that under CF, respectively.
The effects of CS and treatment on yield-scaled GWP were also significant (). The yield-scaled GWP in SA was 1.5 times greater than in WS, and those under AWD and AWDS were 26% and 27% smaller than that under CF, respectively.
WP, the ratio of grain yield to water use, was significantly affected both by CS and treatment (). The WP in WS was 6% higher than in SA and those under AWD and AWDS were 29% and 27% higher than that under CF, respectively.
4. Discussion
4.1. The magnitude of GHG emission in this site
The magnitude of CH4 emission observed in our study was relatively high (351–644 kg CH4 ha−1, ) as compared to the previous studies in Vietnam (Pandey et al. Citation2014; Vu et al. Citation2015). The application of organic fertilizer may have enhanced the CH4 emission irrespective of treatment. In northern Vietnam, Vu et al. (Citation2015) observed the seasonal CH4 emission ranging 70–140 kg CH4 ha−1 in the spring rice season depending on the type and rate of organic amendment. On the other hand, the CH4 emission that they observed in the summer season was ranging 160–290 kg CH4 ha−1. Our results were consistent with the inter-seasonal variability in the CH4 emission between WS and SA in Vietnam (p < 0.10, ). This variability was due mainly to (1) difference in air temperature (WS < SA; –F and D–F) and (2) the short fallow period between WS and SA () that would supply more carbon substrates as rice residue for microbial CH4 production. The relatively long rice stubbles left on the field from WS1 (35 vs. 10 cm) as well as the short fallow period would have caused the exceptionally large CH4 emission in SA1 ( and Supplementary Table S1). This is consistent with Sander et al. (Citation2014) and Tirol-Padre et al. (Citation2017) that reported that straw incorporation and field flooding during fallow period increased the CH4 emission in the subsequent rice growing season.
The magnitude N2O emission in this site was comparable to those observed in the fields with water management in Asia (e.g., northern Vietnam, Pandey et al. Citation2014; Japan, Itoh et al. Citation2011; Philippines, Sander et al. Citation2014). The N2O emission played a negligible role in terms of the GWP of CH4 and N2O because of the relatively large CH4 emission in this site. The seasonal variation pattern was also typical for the fields with water management, in which substantial fluxes were observed during drained periods in combination with N fertilizer application (e.g.,Sander et al. Citation2014; Tariq et al. Citation2016).
4.2. Effects of CS and water management on GHG emission
The effect of CS on the CH4 emission was mainly attributed to the change in rice stubble management between the first two seasons and the later four seasons (see Section 2.1). Contrary to our expectations, only a marginal difference in CH4 emission was found between WS and SA. This can be explained by the differences in the growing periods and in the fallow periods before cultivation. That is, the longer growing season in WS would compensate the positive effect of the longer fallow season on reducing CH4 emission through more decomposition of rice residue.
Our study confirmed that AWD is effective in reducing the CH4 emission in this site. This result agrees with the previous studies, in which a single- or multiple-aeration successfully reduces the CH4 emission (e.g., Yagi and Miami Citation1990; Sass et al. Citation1992). Tirol-Padre et al. (Citation2017) measured CH4 + N2O emission under CF and AWD in Quang Nam province, Central Vietnam, and reported the AWD’s mean CH4 emission reduction of 29% compared to CF over three seasons. This efficiency is close to those obtained in this study. However, it should be noted that the seasonal variation pattern in CH4 flux under AWD and AWDS was distinct from those observed in well-drained fields (e.g., Itoh et al. Citation2011). In this site, CH4 fluxes did not sharply decline to be negligible level after drainage events. This explains why AWD’s performance on reducing CH4 emission was relatively low compared to IPCC’s scaling factor for multiple aeration (IPCC Citation2006) as well as compared to other studies on multiple drainage from southeast Asia (Sander et al. Citation2015). Although the loam texture () is favorable for natural drainage, further study is necessary to elucidate the mechanisms of the distinct pattern in CH4 flux under AWD.
Although the variation pattern in N2O flux was sporadic irrespective of CS, the greater emission was observed in SA (). The higher total N applied during SA1 as compared to that during WS1 () may have contributed to the higher average N2O emission observed during SA than WS. However, water management showed no significant effect on N2O emission. In irrigated rice systems with good water control, N2O emissions are quite small except when excessively high fertilizer-N rates are applied. Nitrous oxide emissions mainly occur during fallow periods and immediately after flooding of the soil at the end of the fallow period. However, with proper timing of fertilizer application and irrigation, N2O emissions are low (Furukawa et al. Citation2007) and would not offset CH4 emission reductions from AWD in terms of GWP (Tirol-Padre et al. Citation2017). Both nitrification and denitrification processes are influenced by soil moisture (Davidson and Swank Citation1986) so that the greater the soil moisture, the greater will be the N2O emission (Baggs et al. Citation2000; Yano et al. Citation2014). However, N2O production decreases under very high moisture contents. But when there are moisture alternations, with successive moist and dry periods, the N2O emissions increase (Brentrup et al. Citation2000) (). In agreement with our findings, the N2O emissions measured in Quang Nam, Central Vietnam, did not increase under AWD relative to CF and thus did not offset the CH4 emission reduction achieved through AWD (Tirol-Padre et al. Citation2017).
4.3. Feasibility and limitations of AWD in Central Vietnam
The results of our study indicate that the AWD implemented is feasible in Central Vietnam in terms of rice productivity, water use, and GHG emission. In our study, AWD did not reduce rice grain yield (rather tended to increase), and water saving was achieved as expected (). Due to the reduction of CH4 emission, the GWP of CH4 and N2O was reduced by 26–29% under AWD and AWDS compared to that under CF. Therefore, the resultant yield-scaled GWP and WP were improved under AWD. Although environmental conditions and field management practices may differ among rice paddies in Central Vietnam, our case study demonstrates that the AWD with the current criteria will be a powerful tool in reducing paddy CH4 emission in this region.
Our study could not elucidate which type of multiple aerations is better suitable to this site because the data obtained under AWD and AWDS were very similar (). Although the surface water level monitored throughout the six CSs differed between AWD and AWDS, the response of CH4 flux to it was not distinct (–L and G–L). Therefore, other parameters for soil moisture conditions, such as water-filled pore space and water potential, may be useful to further analyze the quantitative relationship between soil water status and GHG emission. In addition, because no yield penalty was found under AWD and AWDS (), there may be still room for implementing the drainage practice with more severe soil drying in order to further reduce GHG emission.
It should be noted that GHG emission in wet fallow seasons may be substantial with the conventional water regime during fallow periods. We preliminarily measured the fluxes of CH4 and N2O in wet fallow seasons after SA1 and SA2 at a low frequency and found that the CH4 and N2O fluxes reached 17.1 mg CH4 m−2 h−1 and 386 µg N m−2 h−1, respectively (Tran et al. unpublished data). As well as implementing AWD for reducing CH4 emission in CSs, the development of mitigation options for the GHG emission in fallow seasons will contribute to the reduction in anthropogenic GHG emission in Vietnam.
5. Conclusion
Our study provides the first multi-year dataset on GHG emission from the conventional rice cultivation in Central Vietnam. The mean seasonal cumulative CH4 emission ranged from 500 in WS to 644 kg CH4 ha−1 in SA. These are relatively large compared to other rice paddies in Vietnam due partly to the application of an organic fertilizer. The results indicate that rice paddies located in Central Vietnam can contribute to the national GHG budget and that the dataset is useful to develop the regional emission/scaling factor for more precise national GHG inventory.
The AWD with the current criteria reduced the GWP of CH4 and N2O by 26–29% compared to the CF treatment. No negative result by AWD implementation was found on the items measured in this study, confirming the feasibility of AWD as a mitigation option for paddy GHG emission in Central Vietnam. Our study also shows a possibility of AWD’s performance on increasing rice productivity. In Japan, the implementation of midseason drainage and the subsequent intermittent irrigation can improve rice growth and the resultant grain yield (e.g., Kanno et al. Citation1997). As observed in the Mekong Delta, Southern Vietnam (Yamaguchi et al. Citation2016), finding the positive effect of AWD on rice productivity will be a key to spread it to local farmers.
SSPN-17-124-M-_Supplementary_Table_S1.doc
Download MS Word (43.5 KB)Acknowledgments
This study was funded by the Ministry of Agriculture Forestry and Fisheries (MAFF) of Japan through the International Research Project ‘Technology development for circulatory food production systems responsive to climate change: Development of mitigation options for greenhouse gas emissions from agricultural lands in Southeast Asia 2 (MIRSA 2).’ We would like thank Prof. Kazuyuki Inubushi (Chiba University, Japan), Dr. Reiner Wassmann (IRRI, Philippines), Dr. Bjorn Ole Sander (IRRI, Philippines), and Dr. Kazuyuki Yagi (NIAES, Japan) for their valuable comments on the earlier version of this manuscript.
Supplemental data
Supplemental data for this article can be accessed here.
Additional information
Funding
Related Research Data
References
- Arai H, Hosen Y, Hong VNP, Thi NT, Huu CN, Inubushi K 2015: Greenhouse gas emissions from rice straw burning and straw-mushroom cultivation in a triple rice cropping system in the Mekong Delta. Soil Sci. Plant Nutr., 61, 719–735. doi:10.1080/00380768.2015.1041862
- Baggs EM, Rees RM, Smith KA, Vinten AJA 2000: Nitrous oxide emission from soils after incorporating crop residues. Soil Use Manage., 16, 82–87. doi:10.1111/j.1475-2743.2000.tb00179.x
- Barker R, Dawe D, Tuong TP, Bhuiyan SI, Guerra LC 1999: The outlook for water resources in the year 2020: challenges for research on water management in rice production. In Assessment and Orientation Towards the 21st Century. Proceedings of the 19th Session of the International Rice Commission, 7–9 September1998, pp. 96–109. Cairo, Erype, FAO.
- Box GE, Cox DR 1964: An analysis of transformations. J. Royal Stat. Soc. Series B., 26, 211–246.
- Brentrup F, Küsters J, Lammel J, Kuhlmann H 2000: Methods to estimate on-field nitrogen emissions from crop production as an input to LCA studies in the agricultural sector. Int. J. LCA, 5, 349–357. doi:10.1007/BF02978670
- Ciais P, Sabine C, Bala G 2013: Carbon and Other Biogeochemical Cycles. In Climate Change 2013: the Physical Science Basis. Contribution of Working Group I to the Fifth Assessment Report of the Intergovernmental Panel on Climate Change, Eds. Stocker TF, Qin D, Plattner GK, pp. 465–570. Cambridge University Press, Cambridge, UK and New York, NY, USA.
- Davidson EA, Swank WT 1986: Environmental parameters regulating gaseous nitrogen losses from two forested ecosystems via nitrification and denitrification. Appl. Environ. Microbiol., 52, 1287–1292.
- IPCC 2006: 2006 IPCC Guidelines for National Greenhouse Gas Inventories. In Prepared by the National Greenhouse Gas Inventories Programe, Eds. Eggleston HS, Miwa K, Ngara T, Tanabe K, Published: IGES, Japan.
- Farooq M, Kobazashi N, Wahid A, Ito O, Basra SMA 2009: Chapter 6 Strategies for producing more rice with less water. Adv. Agron., 101, 351–388.
- Fox J, Weisberg S 2011: An R Companion to Applied Regression. Sage, Thousand Oaks, CA.
- Furukawa Y, Hosen Y, Rodriquez R, Agbisit R 2007: Effect of timing of N topdressing and irrigation on CH4 and N2O emissions under the AWD management. In Annual Review and Planning Meeting. IRRI-Japan Project, Eds. Hosen Y, pp. 94–106. International Rice Research Institute, Los Baños, Philippines.
- GRiSP 2013: Rice Almanac 4th, pp. 126–129. International Rice Research Institute, Los Baños, Philippines.
- Ho QD, Nguyen QH, Tran MT, Ngo DM 2011: Overview of nitroden cirulation and mitigation of nitrogen emission from rice production in Vietnam. In Proceeding of International Seminar on Increased Agriculture Nitrogen Circulation in Asia: technological Challenge to Mitigation Agricultural Nitrogen Emission, Eds. Chen ZS, Shindo J, Taipei, Taiwan. Sep. 27–28, 2011.
- Itoh M, Sudo S, Mori S et al. 2011: Mitigation of methane emissions from paddy fields by prolonging midseason drainage. Agric. Ecosyst. Environ., 141, 359–372. doi:10.1016/j.agee.2011.03.019
- Kanno T, Miura Y, Tsuruta H, Minami K 1997: Methane emission from rice paddy fields in all of Japanese prefecture. Nutr. Cycl. Agroecosyst., 49, 147–151. doi:10.1023/A:1009778517545
- Lampayan RM, Bouman BAM, de Dios JL et al. 2004: Adoption of Water Saving Technologies in Rice Production in the Philippine. Food and Feriliser Technology Center Extension Bulletin 548, pp. 15. Republilic of China on Taiwan, FFTC.
- Le TB, Pham QK 2015: Soil resources of Vietnam, major soil types and their use in agriculture. In Proceedings of National Workshop on Vietnam Soils: present Use and Opportunities, pp. 16–46. Hanoi, Agricultural Publishing House.
- Michael E, Andreas H 2004: Socioeconomic Atlas of Vietnam - A Depiction of the 1999 Population and Housing Census. Cartographic Publishing House, Hanoi, 167 pp.
- Minamikawa K, Tokida T, Sudo S, Padre A, Yagi K 2015: Guidelines for Measuring CH4 and N2O Emissions from Rice Paddies by a Manually Operated Closed Chamber Method. National Institute for Agro-Environmental Sciences, Tsukuba, Japan.
- Minamikawa K, Yagi K, Tokida T, Sander BO, Wassmann R 2012: Appropriate frequency and time of day to measure methane emissions from an irrigated rice paddy in Japan using the manual closed chamber method. Greenhouse Gas Meas. Manag., 2, 118–128. doi:10.1080/20430779.2012.729988
- MONRE 2014: Initial Biennial Updated Report of Viet Nam to the United Nations Framework Convention on Climate Change, pp. 94. NARENCA, Hanoi.
- MONRE 2015: Technical Report: vietnam’s Intended Nationally Determined Contribution, pp. 34. Hanoi.
- Myhre G, Shindell D, Bréon FM, et al. 2013: Anthropogenic and natural radiative forcing. In Climate Change 2013: the Physical Science Basis. Contribution of Working Group I to the Fifth Assessment Report of the Intergovernmental Panel on Climate Change, Eds. Stocker TF, Qin D, Plattner GK, et al. pp. 659–740. Cambridge University Press, Cambridge, UK and New York, NY, USA.
- Nguyen BP 2002: Statistics of Agriculture and Rural Development 1996–2000. Agricultural Publishing House, Hanoi, Vietnam, 599 pp.
- Pandey A, Mai VT, Vu DQ, Bui TPL, Mai TLA, Jensen LS, de Neergaard A 2014: Organic matter and water management strategies to reduce methane and nitrous oxide emissions from rice paddies in Vietnam. Agric. Ecosyst. Environ., 196, 137–146. doi:10.1016/j.agee.2014.06.010
- Sander BO, Samson M, Buresh RJ 2014: Methane and nitrous oxide emissions from flooded rice fields as affected by water and straw management between rice crops. Geoderma, 235-236, 355–362. doi:10.1016/j.geoderma.2014.07.020
- Sander BO, Wassmann R, Siopongco JDLC 2015: Water-saving techniques: potential, adoption and empirical evidence for mitigating greenhouse gas emissions from rice production. In Climate Change and Agricultural Water Management in Developing Countries, Eds. Hoanh CT, Smakhtin V, Johnston T, pp. 193–207. CABI Climate Change Series. CABI, Wallingford.
- Sass RL, Fisher FM, Wang YB, Turner FT, Jund MF 1992: Methane emission from rice fields: the effect of floodwater management. Global Biogeochem. Cycles, 6, 249–262. doi:10.1029/92GB01674
- Smith KA, Conen F 2004: Impacts of land management on fluxes of trace greenhouse gases. Soil Use Manage., 20, 255–263. doi:10.1079/SUM2004238
- Tariq A, Jensen LS, Tourdonnet S, Sander BO, Neergaard A 2016: Early drainage mitigate methane and nitrous oxide emissions from organically amended paddy soil. Geoderma. doi:10.1016/j.geoderma.2016.08.022
- Tarlera S, Capurro MC, Irisarri P, Scavino AF, Cantou G, Roel A 2016: Yield-scaled global warming potential of two irrigation management systems in a highly productive rice system. Sci. Agricola, 73, 43–50. doi:10.1590/0103-9016-2015-0050
- Tirol-Padre A, Tran DH, Hoang TN, Duong VH, Tran TN, Le VA, Ngo DM, Wassmann RW, Sander BO 2017: Measuring GHG emissions from rice production in Quang Nam province (Central Vietnam): emission factor for different landscape and water management practices. In Land Use and Climate Change Interactions in Central Vietnam, Eds. Alexandra N, Lars R, pp. 103–122. Springer, Singapore.
- Vu QD, de Neergaard A, Toan DT, Quan QH, Ly P, Tien MT, Stoumann JL 2015: Manure, biogas digestate and crop residue management affects methane gas emissions from rice paddy fields on Vietnamese smallholder livestock farms. Nutr. Cycl. Agroecosyst., 103, 329–346. doi:10.1007/s10705-015-9746-x
- Wassmann R, Neue HU, Lantin RS, Buendia LV, Rennenberg H 2000: Characterization of methane emissions from rice fields in Asia. I. Comparison among field sites in five countries. Nutr. Cycl. Agroecosyst., 58, 1–12. doi:10.1023/A:1009848813994
- Yagi K, Minami K 1990: Effect of organic matter application on methane emission from some Japanese paddy fields. Soil Sci. Plant. Nutr., 36, 599–610. doi:10.1080/00380768.1990.10416797
- Yamaguchi T, Tuan LM, Minamikawa K, Yokoyama S 2016: Alternate wetting and drying (AWD) irrigation technology uptake in rice paddies of the Mekong Delta, Vietnam: relationship between local conditions and the practiced technology. Asian Afr. Area Stud., 15(2), 234–256.
- Yan X, Ohara T, Akimoto H 2003: Development of region-specific emission factors and estimation of methane emission from rice fields in the East, Southeast and South Asian countries. Global Change Biol., 9, 237–254. doi:10.1046/j.1365-2486.2003.00564.x
- Yang J, Liu K, Wang Z, Du Y, Zhang J 2007: Water saving and high-yielding irrigation for lowland rice by controlling limiting values of soil water potential. J. Integr. Plant Biol., 49, 1445–1454. doi:10.1111/j.1672-9072.2007.00555.x
- Yano M, Toyoda S, Tokida T, Hayashi K, Hasegawa T, Makabe A, Koba K, Yoshida N 2014: Isotopomer analysis of production, consumption and soil-to-atmosphere emission processes of N2O at the beginning of paddy field irrigation. Soil Biol. Biochem., 70, 66–78. doi:10.1016/j.soilbio.2013.11.026
- Zhang H, Zhang J, Zhang J, Yang J, Wang Z 2008: Postantheis moderate wetting drying improves both quality and quantity of rice yield. Agron. J., 100, 726–734. doi:10.2134/agronj2007.0169