
ABSTRACT
This study comprises a set of methane emission measurements in rice fields located in the four agro-ecological zones of the Mekong River Delta (MRD), namely the zones with (i) alluvial soils, (ii) salinity intrusion, (iii) deep flood, and (iv) acid sulfate soils. These zones have very distinct bio-physical conditions and cropping cycles that will affect methane emissions in various forms. Our study includes comprehensive mapping of these zones as well as an overview of rice statistics (activity data) at provincial level for each cropping season. Emission data were obtained by the closed chamber method. The available data set comprises 7 sites with 15 cropping seasons. Mean emission rates showed large variations ranging from 0.31 to 9.14 kg CH4 ha−1 d−1. Statistical analysis resulted in weighted means for all zones that we use as zone-specific CH4 emission factors (EFz) in the context of the IPCC Tier 2 approach. The lowest EFz was computed for the saline accounting for 1.14 kg CH4 ha−1 d−1 (confidence interval: 0.60–2.14). The EFz values of the alluvial and acid sulfate zones were 2.39 kg CH4 ha−1 d−1 (2.19–4.13) and 2.78 kg CH4 ha−1 d−1 (2.65–3.76), respectively, which indicated that they were not different from each other derived from their confidence intervals. The deep flood zone, however, required a season-specific, assessment of EFz because emission in the autumn–winter cropping season, corresponding to the wet period, was significantly higher (9.14 kg CH4 ha−1 d−1 (7.08–11.2)) than the other seasons (2.24 kg CH4 ha−1 d−1 (1.59–3.47)). Although these emission factors correspond to baseline water management and do not capture the diversity of farmers’ practices, we see the availability of zone-specific data as an important step for a more detailed assessment of Business as Usual emissions as well as possible mitigation potentials in one of the most important rice growing regions of the world.
1. Introduction
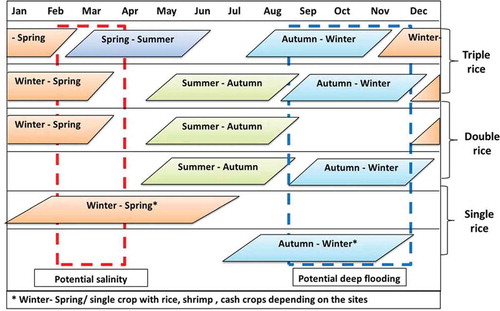
The Mekong River Delta (MRD) is popularly known as the ‘Rice Bowl’ of Vietnam. With a harvested area of 4.25 Mha, this region produces more than 25 million tons of rice yearly accounting for 56% of the Vietnamese rice production (GSO; data for Citation2014). Rice production forms the backbone of the economy of the delta and represents primary livelihood for 60% of the 17 million inhabitants of the Mekong Delta (Kaekoenen Citation2008). Also at national scale, rice from the MRD is an important commodity by ensuring a large surplus production that can be used for exports. Overall, Vietnam is the third-largest rice-exporting country with annual exports reaching 4.5 million tons (Nathan Citation2016). The MRD is an ecologically very diverse region that comprises 13 provinces that differ largely in terms of cropping intensity at different seasons (). Rice in MRD is grown in different cropping cycles ranging from single to triple crops per year as shown in jointly with the periods of salinity and deep flood risks.
Figure 1. Maps of the MRD provinces alongside with diagrams of rice area per season and province (in ‘000 ha), statistics data for the year 2014 obtained from GSO (http://www.gso.gov.vn).
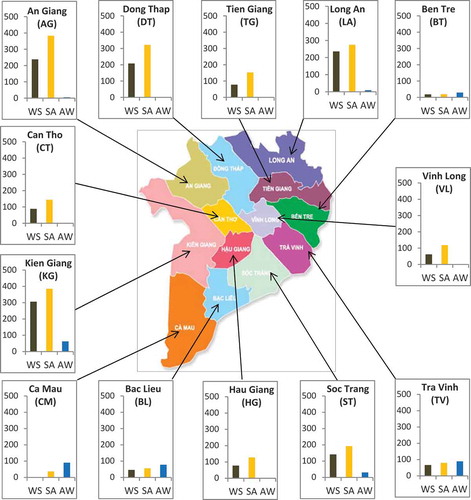
Figure 2. Simplified rice cropping calendar in MRD.
Rice production represents a large methane source (CH4) within the Viet Nam’s GHG budget, but the quantification of the CH4 source strength can only be given with a high range of uncertainty. It must be noted that rice production is also a source of other GHGs such as nitrous oxide (N2O), but those emissions are typically low (Sander et al. Citation2014). The GHG inventory in the most recent National Communication of Vietnam, based on the global default emission rates, concluded that rice production accounts for 1.78 Mt CO2eq at national scale, equivalent to 57.5% of the GHG emissions from agriculture or 26.1% of all GHG sources (MONRE Citation2010). These values were revised in 2014 (MONRE Citation2014) and it was estimated that rice accounts for 50.5% of emissions from agriculture and 18.1% of all GHG emissions in Vietnam. However, these national GHG inventories do not provide data for specific regions at subnational scale, so there is no direct quote on the specific GHG contribution of the MRD. This region accounts for 54.4% of the total rice area in Vietnam (GSO for data Citation2014) and – as a first approximation – its GHG contribution will be in a similar range. The MRD forms a highly diverse region in terms of soil constraints (acidity and salinity) and hydrological features (flooding, availability, and quality) that directly impact on the rice-growing conditions and GHG emissions at any given location and season ().
In this regard, the MRD is similar to other Asian mega-deltas which have very intensive rice production tailored to deltaic bio-physical conditions. The deltaic rice production systems are characterized by very specific hydrological conditions as compared to other rice-growing environments (Wassmann et al. Citation2009), so that the application of default emission factors may be erroneous. However, there are only few studies published on methane emissions of rice grown in such environments (Pandey Nguyen et al. Citation2014; Arai et al. Citation2015; Vu et al. Citation2015; Nguyen et al. Citation2016; Tariq et al. Citation2017; Tirol-Padre et al. Citation2017).
The objectives of our study were (1) to assess the spatial and seasonal variability of CH4 emissions under conventional rice cultivation over a wide range of rice environments in the MRD and (2) to determine zone-specific emission factors on CH4 emissions as a basis for future upscaling.
2. Materials and methods
2.1. Agro-ecological zones of the MRD with relevance to the CH4 budget
2.1.1. Alluvial zone
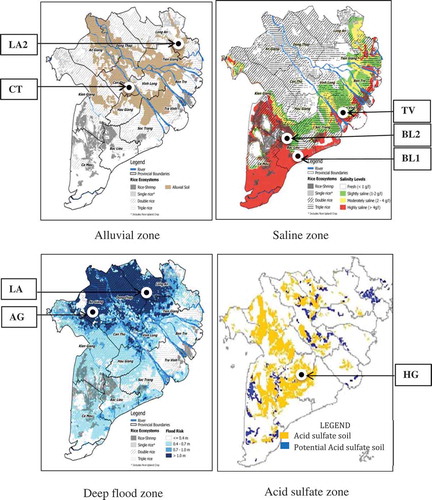
This zone basically comprises the bulk of the favorable rice fields along the river branches (). Land use is very intense with wo to three rice crops per year. Only years with extreme climatic conditions will exert adverse impacts on rice productions, e.g., El Niño years associated with droughts and high salinity intrusion as observed in 2016. Conversely, the alluvial area can be affected by floods in years with high river discharge and rainfall as has happened in the year 2000. As a response to this flood disasters in the past, the government has provided large investments for flood protection that have prevented flash floods in the alluvial zone during recent years – even in years with higher water levels.
Figure 3. Maps of alluvial, saline, deep flood, and acid sulfate zone alongside with measurement sites. Redrawn from the following sources: Nguyen et al. (Citation2017) for alluvial; CLUES project for saline and deep flood; Soil and Fertilizer Research Institute (SFRI), Hanoi for acid sulfate soil; maps drawn by Jorrel Khalil Aunario (IRRI GIS lab).
2.1.2. Saline zone
In the dry season (winter–spring crop (WS)), salinity intrusion is a major impediment for rice production along the entire coastal belt with few exceptions, smaller areas with prevailing freshwater conditions on the west coast and Ca Mau peninsular (). Salinity is effectively absent during the high-water season (autumn–winter crop (AW)), so that this forms the main rice season in most parts of the saline zone ().
The area classified as saline zone comprises very diverse rice-growing environments with different degrees of salinity problems over space and time. Newly constructed sluices are now shielding larger parts of the coastal belt from salinity intrusion. However, salinity protection can be in sufficient in especially dry years, e.g., in the El Nino event of 2016, when salinity intrusion reaches far inland.
2.1.3. Deep flood zone
Almost the entire northern part of the delta is characterized by deep flood during the wet season (AW) lasting from September to November (). However, large parts in this region are protected from flash floods by dykes, so that the water level in the canals is higher than in the soil. The dykes in the flood-prone areas have recently been elevated above the water level of the disastrous flooding of the year 2000. In the wet season, water levels in the canals typically are higher than soil levels. Heavy rainfall then causes ‘stagnant flooding’ in these fields because the water cannot be drained fast enough.
2.1.4. Acid sulfate zone
About 1.6 Mha of the soils of the MRD are classified as acid sulfate soils (Duong et al. Citation2010) that are generally characterized by pH < 4 (Attanandana and Vacharotayan Citation1986). As can be seen in , this soil type dominates the western part, but smaller areas can be found throughout the delta. However, the conditions for growing rice have drastically changed in many locations within the acid sulfate zone. While soil acidity impaired high-yielding rice systems, the acidity of the topsoil has been washed out over years of rice cultivation. Farmer can now control the soil at pH levels of >4 by keeping the soils continuously flooded. In turn, this allows fairly high rice yields of 4–5 Mg/ha in this zone.
2.2. Site and soil characteristics
The CH4 fluxes were measured from independent experimental field trials that are widely scattered among the delta (). Measurements at the sites CT, AG, BL1, BL2, and HG were part of the CLUES projectFootnote1 (‘Climate change affecting land use in the Mekong Delta: Adaptation of rice-based cropping systems’). The sites TV and LA1 were part of a collaboration by Cuu Long Delta Rice Research Institute (CLRRI) with a local GIZFootnote2 project (Dill et al. Citation2014) while LA2 was part of a collaboration by IRRI and Nong Lam University. The soil data given in stems from sampling in January 2016 and subsequent analysis at the CLRRI lab using standard methods (Vo et al. Citation2010; Tat et al. Citation2016).
Table 1. Characterization of measurement sites.
2.3. Field layout and management
Each field treatment had three replicate plots. All field experiments were conducted with randomized complete block design to compare different treatments, although we have now only used CH4 emissions data obtained from baseline management in this study. This comprises in all cases fields under the continuous flooding and direct seeding. In terms of straw management, our experiment followed farmers’ practices that vary with seasons and sites (see ). The fallow periods before the SA crop are typically very dry and farmers prefer to burn the straw while other fallow periods are in some cases too wet for straw burning. As shown in , we have used locally grown rice varieties and fertilizer applications according to typical practices of farmers in the respective zone. In some cases, however, our GHG measurements were part of agronomic experiments assessing different application rates of N and P. Since these trials did not show any significant differences in emissions, we have pooled those data as mentioned in .
Table 2. Experimental details of baseline water management at all sites and season.
2.4. Gas sampling and CH4 analysis
CH4 fluxes were measured using the static chamber method, as described in Tirol-Padre et al. (Citation2017). In all the sites, a plastic base with a diameter of 50 cm was inserted about 10 cm into the soil in thre replicate blocks for each treatment. These bases were installed at least a day before sample collection. The gas collection chambers, fabricated from a plastic pail with a height of 70 cm (120 L volume), were equipped with a sampling port, thermometer, and a battery-operated fan installed inside the chamber. Gas samples were collected at 0, 10, 20, and 30 min after chamber closure.
The gas samples were analyzed at the CLRRI lab except for those from the site LA2 that were analyzed at Hue University. Both GHG labs have compatible instrumentation and procedures. A gas chromatograph (8610C, SRI Instruments, CA, USA) equipped with a flame ionization detector was used to determine the CH4 concentration in the gas samples. The column for the analysis of CH4 was packed with Porapak Q (50–80 mesh) and the carrier gas was nitrogen (N2).
2.5. Calculation of emission rates and statistical analysis
CH4 emission rates were computed based on the ideal gas law, using chamber air temperature values measured at the time of sampling. For calculating the total CH4 emitted for a sampling interval, the measurements taken in the morning were assumed to represent daily average flux rates. It was further assumed that flux changes between two consecutive sampling days as well as between sowing and the first sampling and the last sampling and harvest are linear. The emission rates on the day of sowing and harvest were set to ‘0.’ The seasonal cumulative emission was calculated as the sum of the daily emissions from sowing to harvest. The seasonal mean emission rate of a given site () was estimated from the seasonal cumulative emission divided by the season length in days. Analysis of variance (ANOVA) was performed with the SAS mixed procedure (SAS software ver. 9.4, SAS Institute Inc., Cary, NC, USA) on each data set with different N or P fertilizer treatments to test if these treatments had a significant effect on the mean CH4 emissions rates. Since ANOVA results did not show significant (P < 0.05) treatment effects, the CH4 emission rates from all the N or P treatments in each block were pooled in calculating the seasonal means at a given site (). To assess the variability of seasonal CH4 emission rates measured in eight sites, ANOVA was performed by the SAS mixed procedure (SAS software ver. 9.4, SAS Institute Inc., Cary, NC, USA) with comparison of means by Tukey test each. For each zone, a weighted mean CH4 emission rate across seasons with bootstrapped confidence intervals was estimated using Metawin (ver.2.1; Rosenberg et al. Citation2000).
Table 3. Mean emission ratesa (kg CH4 ha−a d−a) of all sites alongside with emission factors for each zone end the entire MRD.
3. Results
3.1. Soil parameters of measurement sites
Soil textures in the study sites varied from clay to silty clay. Soil available P displayed a 59.7% CV among the study sites followed by total N (46.8%), total organic C (40.9%), and active iron (22.3%). These soil properties are known to affect CH4 emissions in various forms, although there is up to now no clear-cut correlation established. The picture on site variability is much more complicated for the dynamic soil factors of EC and pH that are superimposed by pronounced seasonal cycle. The figures given in have been obtained by sampling in January which corresponds to the transition phase from wet to dry season. In totality among all sites, soil EC showed the largest variability among the soil properties measured, with a coefficient of variation of 67.8%.
3.2. Spatial and seasonal variations in emissions
3.2.1. Alluvial zone
In our study, the alluvial rice environments are represented by the sites CT and LA2 () with two emission charts for each of the two main seasons in this zone (WS and SA) as shown in supplemented by climate data in Figure S1. Emission records were at low or moderately high level in this zone. Only few individual data points are <100 and only one >1000 mg CH4 m−2 d−1 (). There is no distinct seasonal cycle that can be derived from these charts. Seasonal means range from 1.67 of LA2-WS16 to 4.22 kg CH4 ha−1 d−1 of CT-SA12 ().
Figure 4. Emission rates obtained in alluvial zone per site and season; for climate data, see Supplement Figure S1.
3.2.2. Saline zone
Our measurements in the saline zone comprise three sites in the provinces BL and TV () with three season charts for AW and two season charts for WS (). The database for TV has been re-calculated resulting in slightly higher mean values than the one given in Dill et al. (Citation2014) (which corresponded to 0.57 kg ha−1 d−1).
Figure 5. Emission rates obtained in saline zone per site and season; for climate data, see Supplement Figure S2.
The wet season (AW) is by far the most important crop in the saline zone followed by WS and SA (). Emission rates are generally at very low level (≤1.3 kg CH4 ha−1 d−1) except for AW season in BL1 (3.5 kg CH4 ha−1 d−1).
The low values at BL2 and TV can be attributed to the inhibition of methane formation by salinity because these sites are exposed to high salinity levels during the drier periods of the year. For the site BL2, we obtained EC>2 mS cm−1 in the January samples and for the site TV we can refer to verbal information from farmers on prevailing salinity problems at that site. The AW season recorded at BL2 coincides with the point of lowest salinity intrusion, but remaining salinity in the soil and emissions appears to impair CH4 emissions (). The SA season recorded in TV encompasses a period of heavy salinity intrusion, so that emissions are generally very low.
Data from the site BL1 encompass one season with relatively high (AW) and one with low (WS) emissions. Apparently, this site had better salinity protection in the AW season which is also corroborated by the EC measurement (<2 mS/cm recorded in January). We also measured EC values on each sampling day at BL1 and these records show very low salinity levels in the initial 30-day period of the AW season while only the latter stages are affected by EC>2 mS/cm (data not shown).
3.2.3. Deep flood zone
This zone is represented by one site in An Giang Province (). The AW crop is characterized by very wet conditions that typically start even before seeding. As a consequence, CH4 emissions are very high in this season (). The mean emission AG during the AW crop (9.14 kg CH4 ha−1 d−1) was two to five times higher than those from any other given site and season of this study.
Figure 6. Emission rates obtained in deep flood zone per site and season; for climate data, see Supplement Figure S3.
In the WS season, emissions at the AG site are still high during the earlier plant stages, but they decrease with the retreat of the water during the later stages (). The mean emission rates in the WS season (3.41 kg CH4 ha−1 d−1 at AG and 2.41 at LA1) were in a similar range as the alluvial zone while the mean of the SA season (1.59 kg CH4 ha−1 d−1 at AG) was lower than those.
3.2.4. Acid sulfate zone
The zone is represented by one site in the Hau Giang Province () where rice production encompasses two cropping seasons WS and SA (). Emission rates in WS were fairly stable at moderately high level while these patterns of the SA crop show a pronounced peak during the latter stages. In both seasons, mean values were moderately high (2.65 and 3.76 kg CH4 ha−1 d−1) and in a similar range as emissions in the alluvial sites.
Even though classified as acid sulfate soil, the soil in Hau Giang had consistently pH >4.5. In addition to the soil sample in January (pH = 4.63), we also recorded pH values during the observed seasons WS 13 and SA12. Average pH values were 4.92 in WS and 4.68 in SA, respectively.
3.2.5. Assessing emission factors for different zones and the entire MRD
Statistical analysis resulted in weighted means for all zones (using Metawin ver.2.1 to indicate bootstrapped confidence intervals (Rosenberg et al. Citation2000)). These weighted means were used as zone-specific CH4 emission factors (EFz) in the context of the IPCC Tier 2 approach. ANOVA showed significant (P < 0.0001) differences among seasonal CH4 emissions from different sites as shown in .
The lowest EFz was computed for the saline accounting for 1.14 kg CH4 ha−1 d−1 (confidence interval: 0.60–2.14). The EFz values of the alluvial and acid sulfate zones were 2.39 kg CH4 ha−1 d−1 (2.19–4.13) and 2.78 kg CH4 ha−1 d−1 (2.65–3.76), respectively, which indicated that they were not different from each other derived from their confidence intervals. The deep flood zone, however, required a season-specific assessment because mean comparison by Tukey test showed that the CH4 emission rate from AG-AW12 (deep flood) was different (much higher) from all the other crops. This high value coincides with continuous heavy rain during AW resulting in 1020 mm rain (Figure S3) as well as organic inputs from decomposed straw (). Thus, we assigned two different EFz values for the deep flood zone, namely EFz_AW (9.14 kg CH4 ha−1 d−1 (7.08–11.2)) and EFz_WS/SA (2.24 kg CH4 ha−1 d−1 (1.59–3.47)).
4. Discussion
4.1. Zonal differentiation and seasonal patterns
In totality, the database provides a good overview of CH4 emissions in rice production systems of the MRD assuming continuous flooding, i.e., baseline water management as defined in the IPCC methodology. Given the size and variability within the delta, it seems unrealistic to aim at a fully exhaustive database of ample field measurements covering the entire range of environmental factors and their spatio-temporal modifications. Nevertheless, the documented emission patterns encompass the major seasons in the four distinct agro-ecological zones.
In our study, the mean emissions rates per season ranged from 0.31 to 9.14 kg CH4 ha−1 d−1 (). All emission charts have been displayed in – while the respective climate data has been displayed in the Supplemental material (Figures S1–S4). In two data sets (CT-SA12, AG-AW12), the individual records are attached to high variability in the latter stages. We attribute this to bubble ebullition which is typically higher in the second half of the season (Wassmann et al. Citation1996).
Figure 7. Emission rates obtained in acid sulfate zone per site and season; for climate data, see Supplement Figure S4.
There is only one published study available on methane emissions in the MRD, but that focuses on straw burning and mushroom production (Arai et al. Citation2015), so the reported values cannot be taken as a reference for our study. Moreover, there are few studies from other deltas of Vietnam available such as the Red River Delta in North Vietnam (Pandey Nguyen et al. Citation2014; Nguyen et al. Citation2016; Vu et al. Citation2015; Tariq et al. Citation2017) and the Vu Gia/Thu Bon delta in Central Vietnam (Tirol-Padre et al. Citation2017) which reported values ranging from 104 to 696 kg CH4 ha−1 per season. Although these data sets will not be directly applicable to the MRD because the hydrological conditions are very distinct in the different deltas of Vietnam, most of the seasonal emissions we obtained from the MRD are within the range that has been reported in North and Central Vietnam except for some very low emissions in the saline soils and the very high in the deep flood zone.
The lowest emission rates were obtained in the saline zone at BL2, namely the site with the highest EC value (). The adverse effect of salinity on microbial methane production is known for a long time (Koyama et al. Citation1970) and attributed to the sulfate content of sea water. Methanogens have to compete with sulfate-reducing bacteria for hydrogen (Neue Citation1993). Denier Van Der Gon and Neue (Citation1995) showed that an increase in the salt content of pore water to an electrical conductivity of 4 mS cm−1 led to a 25% reduction in the methane emission rate compared with a control plot. In laboratory incubations, the addition of salt progressively decreased methane emission in relation with low microbial activities and populations as reflected by decreased microbial biomass C and low soil microbial populations, including methanogens (Pattnaik et al. Citation2000).
In our measurements, CH4 emissions at BL1 were significantly higher than the other sites during WS. This is an indication of protection from salinity intrusion that can be attributed to recent infrastructure development, namely newly built sluices in the coastal zone. On the other hand, there are many locations in the coastal belt that show this type of protection, so this value should not be seen as an exceptional case.
In the deep flood zone, the AW crop that coincides with the wet season is marked by much higher emission rates than any other of our measurements. This finding may look surprising given that all our field measurements were done under continuous flooding. In the deep flood zone, however, flooding of the soils typically starts in the fallow period before seeding of the AW crop. Due to high water levels in the surrounding canals and water bodies, any rainfall event will directly translate into flooding of the field.
Prolonged flooding is known to increase methane emission rates, which was first shown in field experiments in China (Cai et al. Citation2000). This finding has been taken up in the IPCC methodology by introducing a specific scaling factor to account for the differences in water regime in the pre-season before the cultivation period (IPCC Citation2006, p. 5.50). In our case, flooding during the fallow period can be seen as one reason for the high emission levels in the AW season in the deep flood zone, but can hardly explain the emission peak in the second half of the season (). We attribute the high emission rates at latter stages to the absence of irrigation events in the wet season. When ambient water levels are higher than in the rice fields, percolation will be extremely low. During the other seasons with lower water levels and lesser rainfall, farmers have to irrigate the fields regularly which corresponds to exchanging the entire water column in the field for several times over the season. This leads to inputs of oxygen dissolved in the irrigation water. Methane production in the soil is extremely sensitive to – even small – oxygen inputs so that the emission rates will be lower than in a soil that is largely cut off from such inputs. Numerous studies have reported a significant decrease of CH4 emission in rice fields through single or periodic aeration which inhibit the activity of CH4-producing archaea (Jiao et al. Citation2007; Itoh et al. Citation2011; Minamikawa et al. Citation2014; Sander et al. Citation2014; Yagi et al. Citation1996)
The findings from the site mapped within the acid sulfate zone also need considerations regarding the validity of this classification. While acid sulfate soils are generally characterized by pH < 4 (Attanandana and Vacharotayan Citation1986), the soil pH at HG was consistently >4. These moderately high pH values can be attributed to continuous cropping over recent years that has leached out acidity from the topsoil. Given this soil amelioration, the question has to be raised if this soil located in the acid sulfate zone can actually still be labeled as acid sulfate soil. Even if we assume that acidity levels may be more pronounced in the AW season (which is not present in HG province), it seems unlikely that this will have a greater impact of the overall emissions from the area with acid sulfate soils.
These conditions of an ‘improved’ acid sulfate soil can plausibly explain the fairly high emission rates observed at the site HG. There is ample evidence that soil acidity will largely constrain emissions (Yao et al. Citation1999). While the optimum pH of CH4 production is near neutrality, a small reduction in soil pH could decrease CH4 emissions due to the combined effect of inhibiting activity of methanogens and increasing soil Eh (Wang et al. Citation1993).
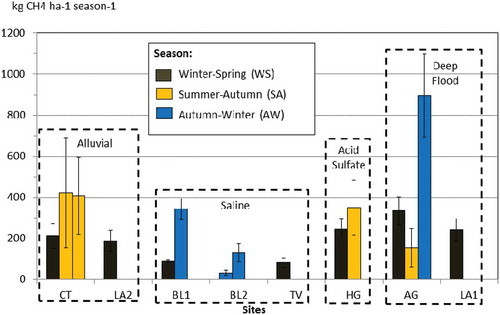
provides a comprehensive picture of the CH4 emissions cumulated over a given season. As all seasons had a similar length of around 100 days, the displayed results basically reflect the emission rates shown in . This graphic presentation effectively highlights the different degrees of variability in the different zone. Variations of seasonal emission rates were very high in the deep flood and in the saline zone. As discussed earlier, these two zones are characterized by very variable bio-physical conditions in space and time. Infrastructure development has generally improved growing conditions for rice, but also resulted in a highly dynamic mosaic-like structure of rice-growing environments. In contrast, emission rates in the alluvial and acid sulfate zone seem to be less variable ranging within low to moderately high level.
Figure 8. Cumulated emission rates per season for all sites and seasons.
4.2. Relevance of results for upscaling with IPCC approach
The IPCC guidelines from 2006 provide clearly defined formulae on using EF and SF for emission upscaling, but they are relatively vague on the exact modalities for the requested disaggregation of these factors. Equation 5.1 (IPCC Citation2006, p. 5.45) represents the basic formula for overall emissions by multiplication of specific emission factors with the respective season length and area. In terms of disaggregation, these EFs should ‘represent different ecosystems, water regimes, type and amount of organic amendments, and other conditions under which CH4 emissions from rice may vary’ (IPCC Citation2006, p. 5.45). When we apply Equation 5.1 to the conditions of the MRD rice production and different agro-ecological zones, the formula can be phrased as follows:
CH4 MRD = ∑ (EFz × tz × Az × 10–3)
where:
CH4 MRD = annual methane emissions from rice cultivation (in Mg CH4 year−1),
EFz = daily emission factor (in kg ha−1 d−1) for each agro-ecological zone,
tz = cultivation period (in days) of rice for each agro-ecological zone,
Az = annual harvested area (in ha) of rice for each agro-ecological zone, and
z = agro-ecological zone.
Thus, we have used our data set for computing EFz values in . Then, we have averaged all EFz values and calculated an overall EFMRD for the entire delta. For this purpose, we have used the weighted mean (see method discussed earlier) as EFMRD that accounts to 1.92 kg CH4 ha−1 d−1 with confidence limits from 1.41 to 2.68. Unlike the arithmetic mean, the weighted mean takes precision of the measured emissions into consideration as values are weighted based on respective variance. Values with high variance are given less weight as compared to those with low variance. This emission factor is 48% higher than the global default value given by IPCC (Citation2006) which is 1.30 kg CH4 ha−1 d−1, but below the upper margin of the error range of the IPCC guidelines which is given as 2.20 kg CH4 ha−1 d−1.
In terms of constraints in our approach, one could argue that the computation of EFMRD still has an arbitrary element because it is based on the available measurements rather that a stratified sampling strategy. However, this possible criticism is applicable to all studies that have so far used emission factors for upscaling. The global default value of IPCC (Citation2006) as well as the country-specific emission factors embedded in the various National Communications have been derived by averaging available emission rates for the geographic domain. At the same time, we recognize that any emission factor database will inherently require updating once more data becomes available. Thus, we regard the reported values as being tentative. EFz and EFMRD values may soon have to be updated by integrating new measurements into the MRD emission database.
Due to high spatio-temporal heterogeneity and the limited number of available measurements, we also recognize that EF values presented in our study are attached to considerable uncertainties. The number of recorded seasons is smaller than in some other GHG studies for individual sites including those in this special issue. This is – under given limitation of financial and logistic resources – a direct consequence of the objectives of our study that gave priority to spatial coverage at the expense of continued observation. Moreover, the term ‘baseline water management’ may need some elaboration. Field managers have been instructed at all sites to maintain a minimum water level of a few centimeters and thus to ensure that the soil will not fall dry. Insofar, we feel that we can call this ‘baseline water management’ even though the records of water levels are not available.
Likewise, the focus on CH4 emissions without N2O measurement could be seen as a possible uncertainty in terms of total GHG emissions. The reason for exclusion of N2O is attributed to technical limitations in the lab system. We have, however, estimated the range of N2O emissions by using the IPCC approach vis-à-vis a CH4MRD value of 1.92 kg CH4 ha−1 d−1 accounting for 5.4 Mg CO2eq. Given an average fertilizer rate of 100 kg N ha−1 season−1 and the IPCC emission factor for N2O from flooded rice fields (=0.3% of applied N), this input corresponds to 0.09 Mg CO2eq or less than 2% of the CH4 emissions. Moreover, there will be smaller CO2 emissions stemming from farm operations, but those will only marginally affect overall magnitude and patterns of GHG emissions.
These EF values will allow future use of the IPCC formula for improved upscaling of emissions for the entire MRD. At this point, however, we refrain from this upscaling, because our data set is confined to continuous flooding and does not take into account the variability in management practices. As we recognize that continuous flooding is not the ubiquitous water management practice at any season throughout the delta, the upscaling for the entire delta derived from baseline EFs only would be pre-mature.
Ideally, the EFs obtained in our study should be applied for extrapolation jointly with detailed activity data on management practices in the different parts of the delta. Future surveys on farmers’ management practices are needed to estimate the percentages of continuous flooding vs. other water management practices over space and time. This ‘Business-as-Usual’ assessment was beyond the scope of this study. Irrespective of this constraint, we see the availability of zone-specific emission data as an important step for a more detailed assessment of BAU emissions as well as possible mitigation potentials in one of the most important rice-growing regions of the world, but still we see our data as an important step to acquire a better assessment of GHG emissions in one to other major rice-growing regions of the world.
Supp._Figures.pdf
Download PDF (3.1 MB)Acknowledgements
The authors acknowledge thorough contributions by several researchers for field sampling (CLRRI, Nong Lam University, Tra Vinh’s Department of Agriculture and Rural Development) and lab analysis (CLRRI, Hue University for Agriculture and Forestry). We also acknowledge the re-drawing of maps () by Jorrel Khalil Aunario (IRRI GIS lab). The views expressed in this document cannot be taken to reflect the official opinions of these organizations.
Additional information
Funding
Notes
1. CLUES (Climate change affecting land use in the Mekong Delta: Adaptation of rice-based cropping systems) funded by the Australian Centre for International Agricultural Research (ACIAR) from 2011–2015: http://irri.org/networks/climate-change-affecting-land-use-in-the-mekong-delta.
2. Deutsche Gesellschaft für Internationale Zusammenarbeit.
Related Research Data
References
- Arai H, Hosen Y, Nguyen PHV, Truong TN, Nguyen HC, Inubushi K 2015: Greenhouse gas emissions from rice straw burning and straw-mushroom cultivation in a triple rice cropping system in the Mekong Delta. Soil Sci. Plant Nutr., 61, 719–735. 10.1080/00380768.2015.1041862
- Attanandana MG, Vacharotayan S 1986: Acid sulfate soils. Their characteristics, genesis, amelioration and utilization. Southeast Asian Stud., 24, 154.
- Cai ZC, Tsuruta H, Minami K 2000: Methane emission from rice paddy fields in China: I. measurements and influencing factors. J. Geophys. Res., 105, 17231–17242. 10.1029/2000JD900014
- Denier van der Gon HAC, Neue HU 1995: Soil parameters controlling methane emission from rice paddies. Stud. Environ. Sci., 65, 607–610.
- Dill J, Deichert G, Le TNT eds. 2014: Promoting the System of Rice Intensification: lessons Learned from Trà Vinh Province, Viet Nam, Infoagro website. 25 http://infoagro.net/archivos_Infoagro/Regatta/biblioteca/VN-GIZreportonLesson.pdf
- Duong TN, Ngo NH, Le VP, Vo QM, Le QT 2010: Some morphological characteristics of acid sulphate soils in the Mekong Delta. Can. Tho Univ. J. Sci., 14, 243–249.
- GSO (General Statistics Office of Viet Nam). http://www.gso.gov.vn/Default_en.aspx?tabid=766
- IPCC (Intergovernmental Panel on Climate Change) 2006: Agriculture, forestry and other land use. In 2006 IPCC guidelines for national greenhouse gas inventories, Eds Eggleston S, Buendia L, Miwa K, Ngara T, Tanabe K, Institute for Global Environmental Studies (IGES), Hayama, Japan
- Itoh M, Sudo S, Mori S, et al. 2011: Mitigation of methane emissions from paddy fields by prolonging midseason drainage. Agric. Ecosyst. Environ., 141, 359–372. 10.1016/j.agee.2011.03.019
- Jiao Z, Hou A, Shi Y, Huang G, Wang Y, Chen X 2007: Water management influencing methane and nitrous oxide emissions from rice field in relation to soil redox and microbial community. Comm. Soil Sci. Plant Anal., 1(37), 1889–1903
- Kaekoenen M 2008: Mekong delta at the crossroads: more control or adaptation? Ambio, 37, 205–212. 10.1579/0044-7447(2008)37[205:MDATCM]2.0.CO;2
- Koyama T, Hishida M, Tomino T 1970: Influence of sea salts on the soil methabolism. 11. On the gaseous metabolism. Soil Sci. PlantNutr., 16, 81–86.
- Minamikawa K, Fumoto T, Itoh M, Hayano M, Sudo S, Yagi K 2014: Potential of prolonged midseason drainage for reducing methane emission from rice paddies in Japan: a long-term simulation using the DNDC-Rice model. Biol. Fertil. Soils, 50, 879–880. 10.1007/s00374-014-0909-8
- MONRE 2010 Vietnam’s Second National Communication of Vietnam to the United Nations Framework Convention on Climate Change, 152pp. Hanoi
- MONRE (Ministry of Natural Resources and Environment) 2014: Initial Biennial Updated Report of Viet Nam to the UNFCCC, 94 pp. Hanoi
- Nathan C 2016: The January 2016 Rice Outlook No. (RCS-16A), In USDA’s World Agricultural Supply and Demand Estimates Report 24, USDA Economic Research Service (ERS) Publications.
- Neue HU 1993: Methane emission from rice fields: wetland rice fields may make a major contribution to global warming. BioScience, 43(7), 466–473. 10.2307/1311906
- Nguyen PM, Haghverdi A, De Pue J, Botula YD, Le KV, Waegeman W 2017: Comparison of statistical regression and data-mining techniques in estimating soil water retention of tropical delta soils. Biosystems Eng., 153, 12–27. 10.1016/j.biosystemseng.2016.10.013
- Nguyen TT, Bui TPL, Trinh MV, Nguyen HS 2016: Effect of water regimes and organic matter strategies on mitigating green house gas emission from rice cultivation and co-benefits in agriculture in Vietnam. Int. J. Environ. Sci. Dev., 7, 85–90. 10.7763/IJESD.2016.V7.746
- Pandey Nguyen A, Mai VT, Vu DQ, Bui TPL, Mai TLA, Jensen LS, De Neergaard A 2014: Organic matter and water management strategies to reduce methane and nitrous oxide emissions from rice fields in Vietnam. Agric. Ecosyst. Environ., 196, 137–146. 10.1016/j.agee.2014.06.010
- Pattnaik P, Mishra SR, Bharati K, Mohanty SR, Sethunathan N, Adhya TK 2000: Influence of salinity on methanogenesis and associated microflora in tropical rice soils. Microbiol. Res., 155, 215–220. 10.1016/S0944-5013(00)80035-X
- Rosenberg M, Adams DC, Gurevitch J 2000: Statistical software for meta-analysis, version 2.1 release 5.1. Sinauer associates Inc., Sunderland, MA, USA. SAS Institute Inc. 2004: SAS/STAT ® 9.1 User’s Guide. Cary, NC: SAS Institute Inc.
- Sander BO, Wassmann R, Siopongco JDLC 2014: Water-saving techniques: potential, adoption and empirical evidence for mitigating greenhouse gas emissions from rice production, Hoanh CT, Smakhtin V, Johnston T Eds, Climate Change and Agricultural Water Management in Developing Countries. 193–207. CABI Climate Change Series, CABI Publishing, Wallingford.
- Tariq A, Vu QD, Jensen LS, Tourdonnet S, Sander BO, Wassmann R, Van Mai T, Neergaard A 2017: Mitigating CH4 and N2O emissions from intensive rice production systems in northern Vietnam: efficiency of drainage patterns in combination with rice residue incorporation. Agric. Ecosyst. Environ., 249, 101–111. 10.1016/j.agee.2017.08.011
- Tat AT, Le VD, Vo TG, Nguyen TBT, Trang NLC, Dao LKD 2016: Efficiency of organic and lime compost in rice yield improvement and adverse effect of saline soils under greenhouse conditions. Can. Tho Univ. J. Sci., 4, 84–93
- Tirol-Padre A, Tran DH, Hoang TN, Duong VH, Tran TN, Le VA, Ngo DM, Wassmann R, Sander BO 2017: Measuring GHG emissions from rice production in Quang Nam province (Central Vietnam): emission factor for different landscape and water management practices, Alexandra N, Lars R eds, Land Use and Climate Change Interactions in Central Vietnam. 103–122. Springer Nature, Singapore.
- Vo TG, Tran BL, Chau TAT 2010: Improving soil fertility and yield of paddy rice on lost cultivation floor soil in Chau Thanh district, Tra Vinh province. Can. Tho Univ. J. Sci., 16b, 107–116.
- Vu QD, De Neergaard A, Toan DT, Quan QH, Ly P, Tien MT, Stoumann Jensen L 2015: Manure, biogas digestate and crop residue management affects methane gas emissions from rice paddy fields on Vietnamese smallholder livestock farms. Nutr. Cycl. Agroecosyst., 103, 329–346. 10.1007/s10705-015-9746-x
- Wang ZP, DeLaune RD, Patrick WH, Masscheleyn PH 1993: Soil redox and pH effects on methane production in a flooded rice soil. Soil Sci. Soc. Am. J., 57, 382–385. 10.2136/sssaj1993.03615995005700020016x
- Wassmann R, Jagadish SVK, Sumfleth K, Pathak H, Howell G, Ismail A, Serraj R, Redoña E, Singh RK, Heuer S 2009: Regional vulnerability of climate change impacts on Asian rice production and scope for adaptation. Adv. Agron., 102, 91–133.
- Wassmann R, Neue HU, Alberto MCR, Lantin RS, Bueno C, Llenaresas D, Arah JRM, Papen H, Seiler W, Rennenberg H 1996: Fluxes and pools of methane in wetland rice soils with
- Yagi K, Tsuruta H, Kanda K, Minami K 1996: Effect of water management on methane emission from a Japanese rice paddy field: automated methane monitoring. Global Biogeochem. Cycles, 10, 255–267. 10.1029/96GB00517
- Yao H, Ronrad H, Wassmann R, Neue HU 1999: Effect of soil characteristics on sequential reduction and methane production in sixteen rice paddy soils from China, the Philippines, and Italy. Biogeochemistry, 47, 267–293. 10.1023/A:1006186420644