
ABSTRACT
We reviewed the role of the soil function of urban green space in mitigating the heat island phenomenon and urban flood damage, which are important issues in the modern urban environment. Urban sprawl has progressed remarkably in the southern part of the Kanto District of Japan, especially since the 1960s. The grassland/bare land area ratio in the center of Tokyo was more than 70% in the 1930s but less than 40% in 1990. On the other hand, the paving area ratio was ~2% in the 1930s but more than 10 times that amount in 1990. Thus, cities, such as Tokyo, in the southern part of the Kanto District have been significantly sealed soil throughout time, and the heat island phenomenon has intensified. Urban green space helps to mitigate the heat island phenomenon based on the water retention and heat dissipation function of plants and unsealed soil. A cool island effect was reported during summer days in urban green spaces in Tokyo. The mitigation of the heat island effect seems to be large, even when conditions, such as the park area, land use, afforestation area ratio, and soil type, differ. Soil sealing and compaction affect urban flooding by hindering the penetration of rainwater and increasing surface runoff. According to a survey in the hilly basin (1 km2) of the western part of Tokyo, the proportion of farm- and forestland decreased due to development. The urban area increased from ~10% in the 1970s to ~60% in the 1980s. As a result, the flood arrival time shortened. Green spaces have a high rainwater permeability. The forest soil structure and presence of O horizons further increase the permeability. By promoting permeability to the underground, it is possible to reduce and delay the water runoff on the land surface. To develop urban green space as green infrastructure, it is necessary to accumulate more information on the current situation and agenda for the future of urban green space.
1. Introduction
The urban area generally is the center of politics, economics, and culture. Various materials, money, and services are gathered and the population will therefore be more concentrated in this area. The land footprint of cities is less than 0.5% of the Earth’s total land area (Schneider et al. Citation2009). However, at present, more than half of the world’s population lives in urban areas, and the urban population is expected to reach 6.5 billion people by 2050, two-thirds of the total population (UNDP Citation2017). For a safe and comfortable life in the urban area, it is necessary to design sustainable urban environmental space. On the other hand, many urban areas worldwide experience various challenges such as the heat island effect, air and water pollution, and declining biodiversity. Sustainable development cannot be achieved unless the development and management methods in urban areas are drastically changed (UNDP Citation2017).
Nowadays, land surfaces of urban areas are often covered with buildings, asphalt, concrete, and dust paving. We refer to these types of land covering as soil sealing in this paper. In total, 17 ha of soil worldwide are sealed every minute due to expanding infrastructure (FAO Citation2016). In Japan, particularly in the southern part of the Kanto District including the Tokyo metropolitan area, the land cover modification rates have increased from 1945 to 1975 as the topsoil modification remarkably advanced (Biodiversity Center of Japan Citation1980). Based on the revised World Soil Charter issued in 2015, soil degradation, including soil sealing by concrete covering due to rapid urbanization, is becoming a big global problem. The charter warns about threats to the balance between food security and the ecosystem (FAO Citation2015).
Soil degradation is the deterioration or loss of the ability of maintaining ecosystem services indispensable for the soil function and human welfare. In short, the soil function enables ecosystem services such as supporting services for nutrient circulation, soil formation, and purification of water and air; provisioning services for food and biomass production; regulating services for the mitigation of climate change; and flood control and preserving (conserving) services for the maintenance of biodiversity (FAO-ITPS Citation2015). In other words, soil is a basic natural resource and natural capital-constituting land.
The soil function is relatively well exhibited in the urban environment in urban green space. Japan’s first urban planning law was established in 1888. Later, it became necessary to promote the development of urban infrastructure to change Edo, a former city, into a modern city. The role of urban green space in urban planning laws included huge benefits related to sanitation, provision of fresh air, countermeasures against infectious diseases, wastewater removal (Ono Citation2000), and evacuation sites in the event of a disaster (Shirai Citation1975). The current role of urban green space in Japan is roughly the same but reflects present-day environmental problems, prevention of global warming, alleviation of the heat island phenomenon, and conservation of biodiversity. Furthermore, it also includes essential items for the revitalization of the area such as functions that contribute to the safety of cities to protect citizens from disasters such as earthquakes and fires and create rich communities through activities of citizens and the creation of a place for relaxation (Ministry of Land, Infrastructure, Transport, and Tourism Citation2017). The items related to the soil function are (1) absorption and sequestration of greenhouse gases, (2) mitigation of the heat island phenomenon, (3) reduction of urban flood damage, (4) conservation of urban biodiversity, and (5) promotion of urban agriculture (as a place of production of biological resources; National Institute for Land and Infrastructure Management Citation2016). These functions cannot be expected to have a sufficient effect in sealed soil environments. With respect to farmland, the Basic Act on the Promotion of Urban Agriculture came into force in 2015. Even considering the trend of urbanization, a framework for the maintenance of diverse functions is recommended to supply fresh agricultural products; secure disaster prevention space; generate good landscape, conservation land, and environments; and provide a place for agricultural experiences.
Thus, the relationship between the urban environment, including urban green space, and soil functions extends across diverse fields. We focused on cases in the Tokyo Metropolis, Japan, in this paper and reviewed different aspects of the role of soil functions of urban green space in mitigating the heat island phenomenon and reducing urban flood damage, which are two important issues in the modern urban environment.
2. States of land and soil in the urban area
2.1. Urbanization and land use
Seventeen hectares of soil worldwide are sealed every minute due to expanding infrastructure (FAO Citation2016). Furthermore, measurements of light emitted from the Earth’s surface indicate that impervious surfaces cover 0.43% of the world’s land area (European Commission Citation2012).
The relationship between artificial cover as an indicator of urbanization and land use will be introduced as an example of the change in the Kanto District, especially the Tokyo metropolitan area (). As of 2016, the area of the Kanto District was approximately 32,200 km2 including a population of ~43 million people; the Tokyo area was ~2100 km2 including a population of ~13.6 million people (Statistics Bureau of Japan Citation2017).
Figure 1. Map of Tokyo City and the Kanto District.
With respect to changes of the land surface in this region from 1945 to 1975, which is the period of high economic growth after the Second World War, urban areas expanded and natural areas (forest- and grassland) and semi-natural land (agricultural land, etc.) decreased (; Biodiversity Center of Japan Citation1980). From 1945 to 1960, most of the land surface modifications made in Tokyo were urbanization due to the diversion from farm- and forestland. Natural land surfaces decreased from 39% to 37%, and artificial land surfaces increased from 24% to 38%. From 1960 to 1975, urbanized types of land modification, such as soil sealing, reversal, and topsoil destruction, occurred in other prefectures in the Kanto District, especially in Kanagawa and Saitama. The natural land surface in Tokyo decreased from 37% to 35%, artificial land increased from 38% to 44%, and the semi-natural land surface decreased from 31% to 16%. The process of land surface modification progressed irreversibly from semi-natural land or agricultural land to urbanized, covered land.
Table 1. Changes in land use classification.
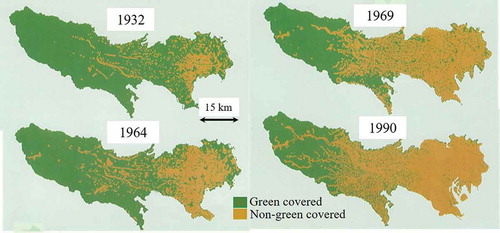
Tabata and Kinoshita (Citation1995) clarified the changes of the structure of green covered space within the city center and its vicinities in the Tokyo metropolitan area between 1932 and 1990 by tracing maps and verifying them with aerial photographs and field observations. They revealed that the green covered space halved in 1990 compared with that in 1932. The decline in the coverage was remarkable around 1960 when the high economic growth period started ().
Figure 2. Changes in the distribution of green covered spaces in the Tokyo metropolitan area.
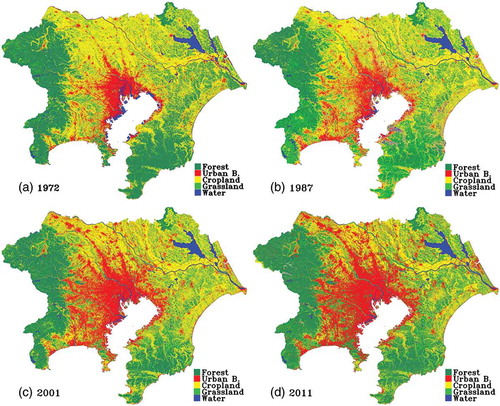
Bagan and Yamagata (Citation2012) investigated chronological changes of land use in the Kanto District using remote-sensing imagery (Landsat) from 1972 to 2011 and revealed that the rapid expansion of the urban area in this period was accompanied by an extensive shrinking of the agricultural area (). Furthermore, urban sprawl progressed remarkably. The population did not concentrate in the center of Tokyo and artificial residential areas with low density formed in the surrounding area. This seemed to be the factor that caused a sharp increase in artificially covered areas. This change was considered to be due to the lifestyle of people, that is, not because of people living in high-rise condominiums but rather because people were strongly inclined to live in suburban detached houses.
Figure 3. Time series of the land use and land cover maps of the southern part of the Kanto District for (A) 1972, (B) 1987, (C) 2001, and (D) 2011.
Furthermore, considering the recent fluctuation, the green rate of Tokyo, that is, the proportion of the area of the whole green area including the park plus the water surface, was 50.5% in 2013 but 52.4% in 2003, which reflects a decrease of 1.9% in 10 years (Tokyo Metropolitan Government Citation2016). Likewise, park–green spaces slightly increased by 3.3–3.5–3.7% from 2003–2008–2010 (by 0.4%); agricultural land decreased by 4.4–3.9–3.7% (by 0.7%); and forests, wilderness, and grassland decreased by 42.4–40.8–40.6% (by 1.8%; Tokyo Metropolitan Government Citation2016).
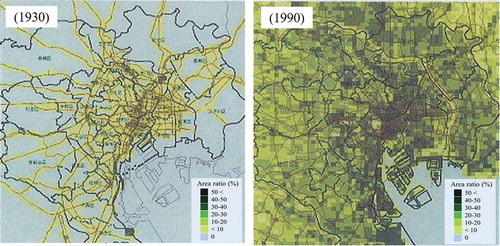
The area ratios of grassland, bare land, and pavement surfaces in the 1930s and 1990 in 23 administrative districts that constitute the center of Tokyo City are shown in . The change in the grassland/bare land area ratios accounted for almost 70% or more in the 1930s but was less than 40% in 1990. The pavement surface area ratio was ~2% in the whole the center of Tokyo City in the 1930s but reached up to more than 10 times that value in 1990 (Ministry of the Environment in Japan Citation2003).
Figure 4. Changes in the pavement surface area ratio in the center of Tokyo between 1930 and 1990.
In many European countries, more than 10% of the land area has already been urbanized and used for settlement and transportation. The degree of soil sealing across Europe mapped by the European Environment Agency was 2.43% in 2012. Metropolitan areas with more than 500,000 people are hotspots of high sealing, with sealed areas of 30% or more (RECARE Citation2016).
There are countries in Europe that have set targets to lower the land coverage; however, it seems that they are not able to take concrete measures (Artmann Citation2016).
The establishment of major green spaces, such as the Imperial Park, during the former Tokyo City period (1889–1943) was largely due to the diversion of the shrines and temples in the Edo era and the Imperial Reconstruction Project after the Great Kanto Earthquake in 1923. Therefore, it is probably difficult to replan and reestablish new large-scale green space under the current situation with an advanced sprawl to suburbs (Koshizawa Citation2001).
2.2. Heat island (urban climate) and land use
Land use changes in urban areas, such as the decrease of topsoil and green rate and the expansion of the pavement area, changed the urban climate.
On the global scale, the temperature is increasing due to the accumulation of greenhouse gases accompanied by the increase in the saturated water vapor pressure and the rise in the sea surface temperature (IPCC Citation2007). On the other hand, in urban areas, the relative humidity has greatly decreased due to the decrease in the amount of evaporation (steam amount) based on the decrease in the water surface and green area and rise in the temperature due to the heat storage by buildings and waste heat (Japan Meteorological Agency Citation2012).
Based on the examples of Tokyo and Tsukuba, a suburban city 50 km northeast of the center of Tokyo that has been developed as Tsukuba Science City since the 1960s, trends in tropical and winter days per year are shown in using archive data collected by the Japan Meteorological Agency (as of 2017). In both cities, the tropical days gradually increase while winter days decrease. There is no noticeable difference between Tokyo and Tsukuba with respect to the increase in the number of tropical days. This indicates that the increase in tropical days is not attributable to urbanization but rather to global warming. However, the remarkable decrease in Tokyo’s winter days is probably due to urbanization.
Figure 5. Trends in tropical and winter days per year in Tokyo (A) and Tsukuba (B). During a tropical day, the temperature rises above 30°C. During a winter day, the minimum temperature falls below 0°C. Archive data were taken from the website of the Japan Meteorological Agency (Citation2017b). However, observation points in Tokyo were relocated three times before 1964. A fourth relocation was carried out in December 2014.
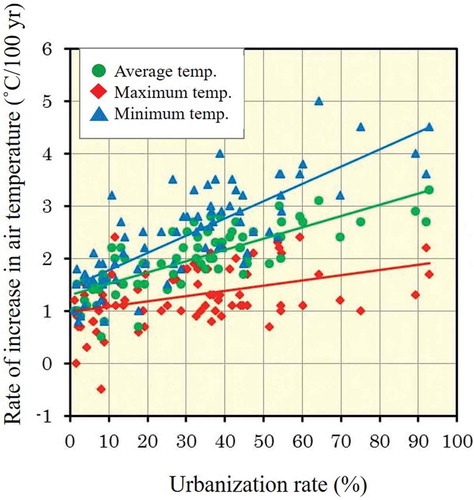
Based on the results obtained from 78 nationwide observation points from 1931 to 2016 in Japan, the average air temperature, maximum temperature, and daily minimum temperature tend to increase as the urbanization rates of land increase (artificial coverage ratio in a circle with a radius of 7 km around the observation point; Japan Meteorological Agency Citation2017a). A positive correlation was found between the rising rate of the air temperature (converted to the rate of increase per 100 years) and surrounding urbanization rate (). The higher the urbanization rate is, the lower is the annual average relative humidity and the urbanization effect clearly appears (Japan Meteorological Agency Citation2017a). The scale of buildings and urban areas in the center of Tokyo expanded with technical innovation, approximately every 30 years (Ojima Citation1995). According to the report of the Ministry of the Environment (Citation2003), the building coverage ratio and high-rise building and floor area ratio increased over time, which affected the increase of the sensible heat of the city. Compared with the 1930s, before full-scale urban development was carried out, the coverage of the ground surface under current conditions increased fivefold. In addition, because the distance from the sea to the downtown area increased due to progressing landfill disposal along the coastal center, the city center became less susceptible to the benefits of the sea breeze.
Figure 6. Positive correlations between the rate of increase in air temperature (converted to the rate of increase per 100 years) and the surrounding urbanization rate.
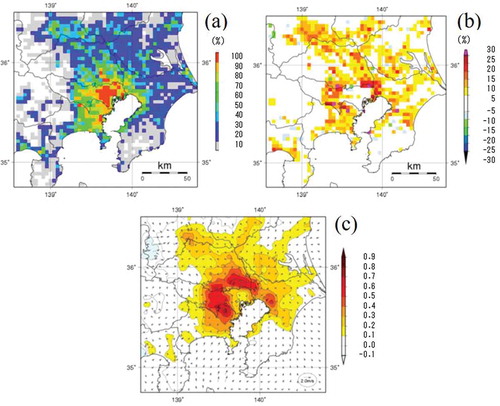
To understand the influence on the temperature based on land use change in the past 30 years, urban climate model simulations were carried out using land use data from 1976 to 2006 (). As a result, the extent to which land use change over the past 30 years affected the change of the daily average air temperature was large in the outskirts of Tokyo (maximum ~0.6°C), where the artificial covering rate, that is, urban sprawl, increased remarkably. With the expansion of urbanization, the high air temperature range expanded (Japan Meteorological Agency Citation2010). The heat island effect is accelerating.
Figure 7. Artificial coverage rate (%) in the southern part of the Kanto District in 2006 (A). Change in the artificial coverage ratio (%) over the past 30 years (difference between the artificial coverage rate in 1976 and 2006) (B). Change in the daily average temperature estimated from the urban climate model (°C) (C).
The heat island phenomenon is the difference between the temperature of the city and local area (Oke Citation1989, Citation1995) and is defined as ‘a state at which the temperature in the city is higher than the estimated temperature assuming that there is no city’ (Japan Meteorological Agency Citation2017a). The changes in the temperature of the urban area are related to area of soil sealing, sealing materials, energy emissions by human activities, city size, and population density (Oke Citation1973; Brazel et al. Citation2000; Baker et al. Citation2002; Japan Meteorological Agency Citation2017a). In addition, it was reported that the effect of an increasing atmospheric temperature due to the urban heat island effect extends to the soil temperature (Edmondson et al. Citation2016).
Compared with artificial, coated pavement, such as asphalt and concrete, the water-holding capacities of plants and soil are high in the vegetation area such as grassland and forest. Due to vaporization heat, mainly during the day, a temperature increase is suppressed. Soil sealing or land covering also greatly changes the water circulation in the urban area (Konijnendijk et al. Citation2013; Hameed Citation2017; Prakash and Sreedevi Citation2017). The water-holding capacity of plants and soil promotes the recharge of groundwater and evaporation of moisture, contributing to the adjustment of meteorological conditions of the urban area (Pauleit and Duhme Citation2000; Pataki et al. Citation2011).
Many studies of the heat island phenomenon confirm the correlation between the thermal pattern of the ground surface temperature based on remote sensing and data of land use and land covering (Voogt and Oke Citation2003; Weng et al. Citation2004; Hiruta and Ishikawa Citation2012). Based on case studies in Davis and Sacramento in the United States, Myrup (Citation1969) simulated that the daily maximum temperature decreased by 1.5–2°C and the daily minimum temperature decreased by ~1°C, respectively, as the area of green spaces in the urban area increased by 10%.
Oke (Citation1989) studied the influence of vegetation in the urban area from the viewpoint of the cooling effect due to the heat of vaporization based on evapotranspiration. They recognized the green shadow effect due to solar shading by plant leaves and pointed out that the effect of urban vegetation would be an important factor for the design of urban environments. Mariani et al. (Citation2016) conducted a simulation experiment incorporating energy balances, such as sensible heat, in Milan, Italy, and clarified that green spaces and vegetation reduce the heat storage due to changes in the sensible heat flux and shielding effect of the tree canopies. Makhelouf (Citation2009) and Bowler et al. (Citation2010) also acknowledged the thermal storage mitigation effect of urban green space. The larger the green space area is, the larger is the decrease of the atmospheric temperature in the green space. In other words, the scale of the green space and rate of temperature decrease are almost proportional to each other (Yun et al. Citation1997; Yamada and Maruta Citation1988).
Based on cases in major cities, such as Tokyo, the differences in the temperature between the urban area and suburbs become constant when the evaporation area ratio (water surface, green area, etc.) exceeds 30% such that an evaporation area ratio of >30% is required in the urban area (Fukuoka Citation1983, Citation1998). Yamada and Maruta (Citation1990) analyzed the temperature and green area (including forest, grassland, bare land, and water surface) in the Suginami ward in the western part of Tokyo using stratified multiple regression analysis. The forestland and water surface ratios were useful to explain differences in the maximum air temperature. The effect of a reduced temperature was reported to be 0.24 ± 0.15°C per 10% forestland ratio and 1.79 ± 0.65°C per 10% water surface ratio. According to Yamada (Citation1994) and Murota et al. (Citation2001), 40% of green space (open space) in the radius of 200 m was required as countermeasure to mitigate the increase in temperature and dehumidification in the urban area. Based on a case in the northern part of Tokyo, Irie et al. (Citation1997) reported that a temperature mitigation effect of green space could occur if the width is 100 m or more and the area is 1.0 ha or more and that there is a correlation between the green area ratio and surface temperature. This indicates that the temperature reduction rate per 10% of the green area ratio is ~0.58°C. Similarly, Sawada et al. (Citation2002) reported that there is a strong correlation between the classification of land cover and land surface temperature distribution in the center of Tokyo. Narita et al. (Citation2004) compared the temperatures in the forest and that of lawns inside the Shinjuku Gyoen National Garden in Tokyo. The temperature in the forest was lower during the day because of the shade but that of the lawn better contributed to cold generation at night.
Some studies revealed so-called cold air-exuding phenomena and cool island phenomena concerning heat transfer in the park (Mikami Citation1982; Hamada and Mikami Citation1994; Nagatani et al. Citation2008; Sugawara et al. Citation2011, Citation2016). Regarding the effect of exuding cold air, it has also been clarified that dispersing green spaces is more effective for lowering the temperature if the total green area is the same (Honjo and Takakura Citation1990; Kanda and Hino Citation1990; Irie Citation2002).
Considering the two urban green parks (Institute for Nature Study and Shinjuku Gyoen National Garden) with a relatively large number of research cases in the center of Tokyo, the relationship between the mitigation of the heat island phenomenon and state of land use is introduced as follows. The Institute for Nature Study in Minato-ku, Tokyo, is ~18 ha in size, mainly covered with forest (98%), designated as ‘national monument and historical landmark’ (1945, former imperial estate), and now an attached facility of the National Science Museum of the Ministry of Education, Culture, Sports, Science, and Technology (Institute for Nature Study Citation2017). The Shinjuku Gyoen National Garden occupies ~58 ha. It is composed of 64% forest, 20% grassland, and 2.6% water and includes the former samurai warrior’s residence and an imperial garden. It was redesignated as a national garden after the Second World War and opened to the public under the Ministry of the Environment (Shinjyuku Gyoen National Garden Citation2017).
Although the park area, area ratio of the planted forest area, and soil types and their conditions were different, the cool island intensity (temperature difference between the green area and surrounding city area) in the Institute for Nature Study in Minato-ku, Tokyo, was ~2.5°C (Shimizu et al. Citation2011, Citation2012) and that of the Shinjuku Gyoen National Garden was ~2°C (Narita and Sugawara Citation2011). The Institute for Nature Study mainly includes forests and wetlands with restricted access. It is suitable as a plant growth base because the soils have many pores and soft under-forest vegetation (Uoi et al. Citation2012). Therefore, the water-holding capacities of soils, plants, and wetlands can contribute to mitigating the heat island phenomenon. Meanwhile, the area of grasslands and forests that can be accessed in the Shinjuku Gyoen National Garden is large and compacted soils are widely distributed (Uoi et al. Citation2013). However, although the soil conditions are worse than in the Institute for Nature Study, the mitigation of the heat island phenomenon might be sufficient because of the lawn area in which the intensity of the cool island effect is larger than that of the forest and the water surface is large.
2.3. Urban flood damage and land use
Some of the precipitation that falls on the open soil surface infiltrates and passes through the soil profile, partly evaporates into the atmosphere, falls off the soil surface, and is eventually introduced into water bodies such as rivers, lakes, and the ocean (; Scheyer and Hipple Citation2005). However, once the soil surface is covered, this natural water circulation will be altered significantly (Pataki et al. Citation2011; Hameed Citation2017). High areas of impermeable cover in the watershed have various effects on the water balance and water regulation at local and watershed scales (; Scheyer and Hipple Citation2005; Paul and Meyer Citation2001; European Commission Citation2012).
Figure 8. Differences in water movement between natural landscape and disturbed urban landscape. Source: Natural Resources Conservation Service of the US Department of Agriculture by Scheyer and Hipple (Citation2005). (A) Water movement in natural landscape with plant cover. This landscape is in a humid area. In drier regions, the stream level is higher than the surrounding land. (B) Water movement in a disturbed urban landscape with impervious surfaces and limited natural vegetation. This landscape is in a humid area. In drier regions, the stream level is higher than the surrounding land.
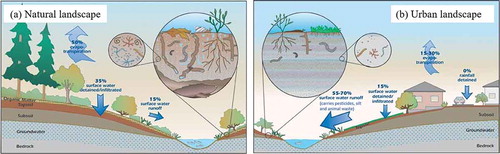
The surface water runoff increases with the increase of impervious sealing area, particularly during heavy rainfall events. Soil sealing increases the peak discharge rate, total runoff volume, and stream flashiness (streamflow response to storms; typically rising and falling quickly; European Commission Citation2012).
Green areas have a higher water permeability. Beven and Germann (Citation1982) reported that the existence of continuous pore structures called macropores, which are derived from the pore composition and soil structure, is important for the water permeability. When the pore ends of the ground surface are closed by soil sealing or when the pore gap disappears or decreases due to soil compaction during land development, the decrease of the permeability results in surface water runoff. These problems are considered to be soil degradation in urban environments.
Several studies on the occurrence of urban floods have been reported such as cases in Munich (Pauleit and Duhme Citation2000) and Leipzig (Haase and Nuissl Citation2007) in Germany and Leeds in the UK (Perry and Nawaz Citation2008). Based on these cases, it was concluded that the land use change related to urban sprawl phenomena; increase of urban, industrial, and commercial areas; expansion of the road area; increase in the number of detached houses; and increase of impervious surface by pavement cause the decrease of the urban infiltration ability and increase of surface runoff.
To eliminate housing shortages and prevent sprawls, a hilly area in the western part of Tokyo, approximately 2884 ha, was developed as the commuter belt in Japan in 1966. During the development, the Ministry of Construction (Civil Engineering Research Institute, River Bureau, Construction Bureau), Tokyo Metropolitan Government, and Japan Housing Corporation jointly started to establish runoff sites in river basins within the development area in 1969 and began investigating the continuation survey of the water flow change due to urbanization to grasp the relationship between urbanization and the occurrence of floods. The results and background of this survey were summarized by the Committee on Urban Hydrology (Citation1986). The runoff test site was a hilly area consisting of Tertiary sea stratum and Quaternary volcanic ash cover. Andosols were distributed on the ground surface. The rain gauge and river water level were measured in various basins in the test site area during the ongoing development. The changes in land use, runoff rate (ratio of river runoff volume to rainfall per basin area), and flood arrival time during the survey period in the Minami–Osawa Basin (1 km2) are shown in . Forest areas, crop fields, and paddy fields drastically decreased due to the progress of urbanization and development; on the contrary, established and urban areas increased. The water runoff rates in the catchment area increased from 15% to 65% in the 1970s to 30–64% in the 1980s. As a result, the flood arrival times shortened from 30 to 130 min in the 1970s to 30 to 90 min in the 1980s.
Figure 9. Changes in land use, water runoff rate, and flood arrival time in the Minami–Osawa watershed in the western part of Tokyo (Committee on Urban Hydrology Citation1986).
Data on the relationship between the extent of urbanization and changes in the runoff volume were accumulated in a continuous survey and utilized for various analyses. Based on the results of the joint research team, Kinoshita et al. (Citation1973) found that ground surfaces in the natural state had irregularities, and the roughness of the surface was large such that the effect of delayed water runoff caused by the water accumulation effect (rainwater recharge) and smoothing of the ground surface by urbanization decreasing the roughness of the surface reduced the water runoff delay effect. In addition, it was confirmed that the large porosity of soils and distribution of roots contributed to permeability and that soil sealings greatly decreased the permeability. In 1980, the Ministry of Construction shifted from a countermeasure focused on river improvement to a comprehensive flood control program based on rainwater storage in the watershed and land use regulations as measures against urban flood damage. Therefore, it was necessary to establish a permeability evaluation method for each land use in the watershed.
Ando et al. (Citation1982) conducted field measurements at 23 points in the target watershed using the flooding type infiltrometer. It was confirmed that the permeabilities were greater in natural land use areas, such as forests and grassland, but smaller in urban land use areas such as athletic fields and building sites. They also confirmed that the permeabilities differed depending on the soil quality and compaction degree, even for the same land use type. Subsequently, it was necessary to evaluate both methodologies again because the method using the flooding-type infiltrometer, which is the basic measurement method, tended to show larger infiltration values than the method using the rainfall simulator infiltrometer. Ando et al. (Citation1990) concluded that the method using the rainfall simulator infiltrometer is suitable for water runoff analyses; it showed small errors with respect to the amount of water runoff. Ando et al. (Citation1990) and Fujimura and Ando (Citation1997, Citation1998) examined the differences in permeability depending on the topography and soil types using a rainfall simulator infiltrometer. The final infiltration values (permeability in which the change in infiltration value is small and reaches the steady state) of the athletic field were 2.3–7.1 mm h−1, 1.9–13.2 mm h−1 in the bare land, and 22 mm h−1 for lawn. The differences resulted in the importance of land use compared with the topography and soil type. The permeability varied even for the same land use type depending on the degree of compaction and condition of the soil surface (Ando Citation1991).
In Yukawa and Onda (Citation1995), the permeability was decreased because the soil structure was destroyed by raindrop impact and soil particles clogged the pores of the forest floor, where the underlying vegetation had disappeared by the collection of fallen leaves (crust formation). Yoshida et al. (Citation2013) examined the influence of the tree species in green spaces on the rainwater recharge function and the influence different forest floors on the permeability. The final infiltration rate in secondary forest with deciduous broad-leaved trees showed a large value of ~220 mm h−1, while it was low (144 mm h−1) in the evergreen forest, where the development of litter deposit/accumulated layer was weak.
Iida et al. (Citation2015) evaluated the capability of suppressing inundation inside a levee of green space in urban areas based on various data of green spaces, permeability by each land use, and the building coverage rate in the Kanda River Basin in Tokyo. A large infiltration rate was observed in the simulation assuming a total rainfall of ~110 mm for 3 h in the catchment area with a large number of forested green spaces, whereas flooding occurred in the catchment area rich in commercial areas, stations, and roadsides. The simulation results with reduced green spaces showed a further increased risk of inundation flooding.
Maintaining macropores is important to reduce floods and recharge groundwater in urban areas. For that purpose, it is necessary to not only reduce the soil sealing area but also maintain and manage the soil functions related to water circulation such as the improvement of the soil density in green parks and increase of permeability of sealed areas by green infrastructure technology.
3. Conclusion
We attempted to review the role of the soil function of urban green space in mitigating the heat island phenomenon and urban flood damage, which are important issues in the modern urban environment, especially in the Tokyo metropolitan area.
Urban sprawl has progressed remarkably in the southern part of the Kanto District of Japan, especially since the 1960s.
The topsoil in cities, such as Tokyo, and the southern part of the Kanto District has been dramatically sealed and the heat island phenomenon has expanded. Urban green space helps to mitigate the heat island phenomenon by water retention and heat dissipation of plants and soil sealing. A cool island effect was recognized during summer days in urban green space in Tokyo and the mitigating effect for the heat island effect seems to be large, even when conditions such as the park area, land use, afforestation area ratio, and soil type differ.
Soil sealing and compaction play a role in urban flooding. They hinder the penetration of rainwater and increase the surface runoff. The farm- and forestland decreased and the urban area increased due to development. As a result, the flood arrival time shortened. Because green space has a high rainwater permeability, it is possible to reduce and delay the water runoff on land by decreasing areas of soil sealing and developing green spaces.
To develop the urban green space as green infrastructure, it is necessary to further accumulate soil sealing and land coverage information on the current situation and agenda for the future of urban green space.
References
- Ando Y 1991: Relationship between Infiltration Capacity and Topography, Soil Type and Land Use in Urban Are. P. Hydraulic Eng., 35, 123–128. (in Japanese with English summary). doi:10.2208/prohe.35.123.
- Ando Y , Okamoto T , Kaneo K , Kan A 1982: On infiltration capacity of various land-use areas. P. Jpn. Conf. Hydraul. , 26, 307–312. (in Japanese). doi:10.2208/prohe1975.26.307
- Ando Y , Suzuki A , Kajitani M , Ozaki A , Hayashi T 1990: Flood runoff analysis of urban watershed with infiltration capacity observation by land utilization. Water Sci. , 191, 46–56. (in Japanese).
- Artmann M 2016: Urban gray vs. urban green vs. soil protection – development of a systemic solution to soil sealing management on the example of Germany. Environ. Impact Asses. Rev. , 59, 27–42. doi:10.1016/j.eiar.2016.03.004
- Bagan H , Yamagata Y 2012: Landsat analysis of urban growth: how Tokyo became the world’s largest megacity during the last 40 years. Rem. Sens. Environ. , 127, 210–222. doi:10.1016/j.rse.2012.09.011
- Baker LA , Brazel AJ , Selover N , Martin C , McIntyre N , Steiner FR , Nelson A , Musacchio L 2002: Urbanization and warming in Phoenix (Arizona USA): impacts, feedback and mitigation. Urban Ecosyst. , 6, 183–203. doi:10.1023/A:1026101528700
- Beven K , Germann P 1982: Macropores and water flow in soils. Water Resour. Res. , 18, 1311–1325. doi:10.1029/WR018i005p01311
- Biodiversity Center of Japan, Nature Conservation Bureau, Ministry of the Environment 1980: Survey of surface ground alterations. (in Japanese). https://www.biodic.go.jp/reports/2-20/index.html (November, 2017).
- Bowler DE , Buyung AL , Knight TM , Pullin AS 2010: Urban greening to cool towns and cities: a systematic review of the empirical evidence. Landsc. Urban Plan. , 97, 147–155. doi:10.1016/j.landurbplan.2010.05.006
- Brazel A , Selover N , Vose R , Heisler G 2000: The tale of two cities – Baltimore and Phoenix urban LTER sites. Clim. Res. , 15, 123–135. doi:10.3354/cr015123
- Committee on Urban Hydrology 1986: Report on the runoff changes due to large-scale urban development in Tama New Town. T. Jpn. Soc. Civ. Eng. , 375, 29–41. (in Japanese). doi:10.2208/jscej.1986.375_29
- Edmondson JL , Stott I , Davies ZG , Gaston KJ , Leake JR 2016: Soil surface temperatures reveal moderation of the urban heat island effect by trees and shrubs. Sci. Rep. , 6, 33708. doi:10.1038/srep33708
- European Commission 2012: Soil Sealing. Science for environment policy in-depth reports. http://ec.europa.eu/environment/archives/soil/pdf/sealing/Soil Sealing In-depth Report March version_final.pdf.
- Food and Agriculture Organization of the United Nations 2016: Soil sealing. http://www.fao.org/3/a-i6470e.pdf (November, 2017).
- Food and Agriculture Organization of the United Nations 2015: Revised world soil charter. Rome. http://www.fao.org/3/a-mn442e.pdf (November, 2017).
- Food and Agriculture Organization of the United Nations, Intergovernmental Technical Panel on Soils (FAO-ITPC) 2015: Status of the World’s Soil Resources-Technical Summary. FAO, Rome. http://www.fao.org/3/a-i5126e.pdf (November, 2017).
- Fujimura K , Ando Y 1997: Stormwater runoff analysis of urban basin using measured infiltration capacity by rainfall simulator. J. Jpn. Soc. Hydrol. Water Resour. , 10, 319–328. (in Japanese with English summary). doi:10.3178/jjshwr.10.319
- Fujimura K , Ando Y 1998: Simulation of runoff control efficiency by infiltration facilities of urban basins. J. Jpn. Soc. Hydrol. Water Resour. , 11, 360–370. (in Japanese with English summary). doi:10.3178/jjshwr.11.360
- Fukuoka Y 1983: City size and heat island. Geography , 28(12), 34–42. (in Japanese).
- Fukuoka Y 1998: The function of water and plants on warming of urban atmosphere. Water Sci. , 244, 1–18. (in Japanese).
- Haase D , Nuissl H 2007: Does urban sprawl drive changes in the water balance and policy? The case of Leipzig (Germany) 1870–2003. Landsc. Urban Plan. , 80, 1–13. doi:10.1016/j.landurbplan.2006.03.011
- Hamada T , Mikami T 1994: Cool island phenomena in urban green spaces: a case study of Meiji Shrine and Yoyogi Park. Geogr. Rev. Jpn. , 67, 518–529. (in Japanese with English summary). doi:10.4157/grj1984a.67.8_518
- Hameed HM 2017: Estimating the effect of urban growth on annual runoff volume using GIS in the Erbil sub-basin of the Kurdistan Region of Iraq. Hydrology , 4, 12–25. doi:10.3390/hydrology4010012
- Hiruta Y , Ishikawa M 2012: Research on indication for evaluating the heat-reduction effect of green space. J. City Plan. Inst. Jpn. , 47, 259–264. (in Japanese with English summary). doi:10.11361/journalcpij.47.259
- Honjo T , Takakura T 1990: Simulation of thermal effects of urban green areas on their surrounding areas. Energ. Build. , 15, 443–446. doi:10.1016/0378-7788(90)90019-F
- Iida A , Yamato H , Hayashi S , Ishikawa M 2015: A simulation study of rainwater infiltration and flood prevention effects by urban green spaces in Kanda River, Tokyo. J. City Plan. Inst. Jpn. , 50, 501–508. (in Japanese with English summary). doi:10.11361/journalcpij.50.501
- The Institute for Nature Study 1990: The Special Event-Urbanization and Nature in Tokyo, p. 63. National Museum of Nature and Science, Tokyo. (in Japanese).
- Institute for Nature Study 2017: http://www.ins.kahaku.go.jp/english/index.php (November, 2017).
- Intergovernmental Panel on Climate Change (IPCC) 2007: Climate Change 2007: The Physical Science Basis. Contribution of Working Group I to the Fourth Assessment Report of the Intergovernmental Panel on Climate Change 2007. Cambridge University Press, Cambridge, UK.
- Irie T 2002: Study on effect of open space in reducing heat island by presuming the temperature. J. Jpn. Inst. Landsc. Architec. , 66, 889–892. (in Japanese with English summary). doi:10.5632/jila.66.889
- Irie T , Hirano K , Hara K 1997: Study on the effective form of open space for urban climate control by Landsat TM data in a case study on Northern Tokyo areas. J. Agric. Sci., Tokyo Nogyo Daigaku , 41, 246–254. (in Japanese with English summary).
- Japan Meteorological Agency 2010: Heat island report. (in Japanese). http://www.data.jma.go.jp/cpdinfo/himr/2010/himr2010.pdf (November, 2017).
- Japan Meteorological Agency 2012: Heat island report. (in Japanese). http://www.data.jma.go.jp/cpdinfo/himr/2012/himr2012.pdf (November, 2017).
- Japan Meteorological Agency 2017a: Heat island report. (in Japanese). http://www.data.jma.go.jp/cpdinfo/himr/h29/himr_2016.pdf (November, 2017).
- Japan Meteorological Agency 2017b: Past weather data. (in Japanese). http://www.data.jma.go.jp/gmd/risk/obsdl/index.php (November, 2017).
- Kanda M , Hino M 1990: Numerical simulation of soil-plant-air system (2) numerical experiment on the effect of plant on meteorological environment. J. Jpn. Soc. Hydrol. Water Resour. , 3(3), 47–55. (in Japanese with English summary). doi:10.3178/jjshwr.3.3_47
- Kinoshita T , Yoshino F , Hashimoto T , Yoneda K 1973: Change of runoff due to urbanization. P. Jpn. Conf. Hydraul. , 17, 97–102. (in Japanese). doi:10.11532/prohe1962.17.97
- Konijnendijk CC , Annerstedt M , Nielsen AB , Maruthaveeran S 2013: Benefits of urban parks. A systematic review. A report for IFPRA. http://worldurbanparks.org/images/Newsletters/IfpraBenefitsOfUrbanParks.pdf (November, 2017).
- Koshizawa A 2001: Tokyo City Planning Story, 389 p. Chikuma Shobo, Tokyo. (in Japanese).
- Makhelouf A 2009: The effect of green spaces on urban climate and pollution. Iran. J. Environ. Health Sci. Eng. , 6, 35–40.
- Mariani L , Parisi SG , Cola G , Lafortezza R , Colangelo G , Sanesi G 2016: Climatological analysis of the mitigating effect of vegetation on the urban heat island of Milan, Italy. Sci. Total Environ. , 569–570, 762–773. doi:10.1016/j.scitotenv.2016.06.111
- Mikami T 1982: Climates of parks and green spaces in an urban area. Ochanomizu Univ. Stud. Arts Cult. , 35, 21–36. (in Japanese).
- Mikami T 2005: Illustration · Something is Wrong, Tokyo Abnormal Weather. Yosensya, Tokyo. (in Japanese).
- Ministry of Land, Infrastructure, Transport and Tourism 2017: Need for parks and green spaces. (in Japanese). http://www.mlit.go.jp/common/000996960.pdf (November, 2017).
- Ministry of the Environment of Japan 2003: Ground surface coating. The report of environmental impact caused by heat island phenomenon. (in Japanese). http://www.env.go.jp/air/report/h15-02/01_1_2_2.pdf (November, 2017).
- Murota Y , Komura O , Kobayashi S , Chino S , Sakai K 2001: Elements of land use with contribution toward alleviating high-temperature and dehumidification of city: a basic study on planning standard of land use covered with green district for human environment-friendly of temperature-humidity in urban area part 3. J. Archi. Plan. Eng., AIJ , 66, 209–214. (in Japanese with English summary). doi:10.3130/aija.66.209_2
- Myrup LO 1969: A numerical model of the urban heat-island. J. Appl. Meteorol. , 8, 908–918. doi:10.1175/1520-0450(1969)008<0908:ANMOTU>2.0.CO;2
- Nagatani Y , Umeki K , Honjo T , Sugawara H , Narita K , Mikami T 2008: Analysis of movement of cooled air in Shinjuku Gyoen. J. Agric. Meteorol. , 64, 281–288. (in Japanese with English summary). doi:10.2480/agrmet.64.4.11
- Narita K , Mikami T , Sugawara H , Honjo T , Kimura K , Kuwata N 2004: Cool-island and cold air-seeping phenomena in an urban park, Shinjuku Gyoen, Tokyo. Geogr. Rev. Jpn. , 77, 403–420. (in Japanese with English summary). doi:10.4157/grj.77.403
- Narita K , Sugawara H 2011: Cold-air seeping-out phenomena in an urban green space. J. Geogr. , 120, 411–425. (in Japanese with English summary). doi:10.5026/jgeography.120.411
- National Institute for Land and Infrastructure Management 2016: Vision for landscape planning in future society research report on the landscape planning methodology compatible with population decline and urban shrinkage in Japan. Techn. Note NILIM , 914, 1–88. (in Japanese with English summary).
- Ojima T 1995: Advanced Landscape of Tokyo, 226 p. Waseda University Press, Tokyo. (in Japanese).
- Oke TR 1973: City size and the urban heat island. Atmos. Environ. , 7, 769–779. doi:10.1016/0004-6981(73)90140-6
- Oke TR 1989: The micrometeorology of the urban forest. Philos. Trans. R. Soc. B: Biol. Sci. , 324, 335–349. doi:10.1098/rstb.1989.0051
- Oke TR 1995: The heat island of the urban boundary layer: characteristics, causes and effects. In Wind Climate in Cities, Ed. Cermak JE , pp. 81–107. Kluwer Academic Publishers, Amsterdam.
- Ono R 2000: Planning conceptions of parks and public open spaces in Tokyo city in the Meiji Era. Bull. Univ. Tokyo For. , 103, 121–241. (in Japanese with English summary).
- Pataki DE , Carreiro MM , Cherrier J , Grulke NE , Jennings V , Pincetl S , Pouyat RV , Whitlow TH , Zipperer WC 2011: Coupling biogeochemical cycles in urban environments: ecosystem services, green solutions, and misconceptions. Front. Ecol. Environ. , 9, 27–36. doi:10.1890/090220
- Paul MJ , Meyer JL 2001: Streams in the urban landscape. Annu. Rev. Ecol. Syst. , 32, 333–365. doi:10.1146/annurev.ecolsys.32.081501.114040
- Pauleit S , Duhme F 2000: Assessing the environmental performance of land cover types for urban planning. Landsc. Urban Plan. , 52, 1–20. doi:10.1016/S0169-2046(00)00109-2
- Perry T , Nawaz R 2008: An investigation into the extent and impacts of hard surfacing of domestic gardens in an area of Leeds, United Kingdom. Landsc. Urban Plan. , 86, 1–13. doi:10.1016/j.landurbplan.2007.12.004
- Prakash CR , Sreedevi B 2017: Land-use land-cover change and its impact on surface runoff using remote sensing and GIS. Int. J. Adv. Rem. Sens. GIS , 6, 2103–2113. doi:10.23953/cloud.ijarsg.237
- RECARE 2016: Fact sheet-soil sealing October 2016. http://www.recare-hub.eu/images/articles/Soil_Threats/Soil_Sealing/FactSheet_Soil_SealingFinal.pdf (November, 2017).
- Sawada D , Honjo T , Maruta Y , Kimura K 2002: A study on estimation of area available for rooftop tree-planting in terms of aerial photograph. Conf. Env. Inf. Sci. , 16, 393–398. (in Japanese). doi:10.11492/ceispapers.ceis16.0.59.0
- Scheyer JM , Hipple KW 2005: Urban Soil Primer. United States Department of Agriculture, Natural Resources Conservation Service, National Soil Survey Center, Lincoln. https://www.nrcs.usda.gov/Internet/FSE_DOCUMENTS/nrcs142p2_052835.pdf ( November, 2017).
- Schneider A , Friedl MA , Potere D 2009: A new map of global urban extent from MODIS satellite data. Environ. Res. Lett. , 4, 1–11. doi:10.1088/1748-9326/4/4/044003
- Shimizu S , Sugawara H , Narita K , Mikami T , Hagiwara S 2011: Cold air-seeping phenomena in the Institute for Nature Study. Rept. Inst. Nat. Stu. , 42, 39–47. (in Japanese).
- Shimizu S , Sugawara H , Narita K , Mikami T , Hagiwara S 2012: Cold air-seeping phenomena in the Institute for Nature Study – results of the 2011 summer observations. Rept. Inst. Nat. Stu. , 43, 19–27. (in Japanese).
- Shinjuku Gyoen National Garden, Ministry of the Environment 2017: Information. https://www.env.go.jp/garden/shinjukugyoen/english/index.html (November, 2017).
- Shirai H 1975: Study on current ideas of green space conservation in cities (1) – conservation theories in the spring era. J. Jpn. Inst. Landsc. Architec. , 39(3), 34–45. (in Japanese with English summary). doi:10.5632/jila1934.39.3_34
- Statistics Bureau of Japan 2017: Japan statistical yearbook 2017. http://www.stat.go.jp/english/data/nenkan/index.htm (November, 2017).
- Sugawara H , Shimizu S , Takahashi H , Hagiwara S , Narita K , Mikami T , Hirano T 2016: Thermal influence of a large green space on a hot urban environment. J. Environ. Qual. , 45, 125–133. doi:10.2134/jeq2015.01.0049
- Sugawara H , Tanaka H , Narita K , Nakano T , Mikami T 2011: Vertical structure of cool island in an urban green park. J. Geogr. , 120, 426–432. (in Japanese with English summary). doi:10.5026/jgeography.120.426
- Tabata S 1980: A study on the structure and the alteration of green covered space. Tech. Bull. Fac. Hort. Chiba Univ. , 27, 19–33.
- Tabata S , Kinoshita T 1995: Distribution of green covered space and its changes within the city center and its vicinities in Tokyo Metropolis. Tech. Bull, Fac. Hort. Chiba Univ. , 49, 53–69.
- Tokyo Metropolitan Government 2016: Environment white paper 2016. (in Japanese). http://www.kankyo.metro.tokyo.jp/basic/2016sizen.pdf (November, 2017).
- United Nations Development Program (UNDP) 2017: GOAL 11: sustainable cities and communities. http://www.undp.org/content/undp/en/home/sustainable-development-goals/goal-11-sustainable-cities-and-communities.html (November, 2017).
- Uoi N , Kawahigashi M , Ono M , Murata T , Watanabe M 2013: Estimation of soil carbon storage in Shinjyuku Gyoen National Garden based on land use history and soil compactness profiles. Geogr. Rep. Tokyo Metrop. Univ. , 48, 13–24.
- Uoi N , Watanabe M , Murata T 2012: Correspondence of vertical soil hardness and land use history in the Institute for Nature Study. Rept. Inst. Nat. Stu. , 43, 37–45. (in Japanese).
- Voogt JA , Oke TR 2003: Thermal remote sensing of urban climates. Rem. Sens. Environ. , 86, 370–384. doi:10.1016/S0034-4257(03)00079-8
- Weng Q , Lu D , Schubring J 2004: Estimation of land surface temperature-vegetation abundance relationship for urban heat island studies. Rem. Sens. Environ. , 89, 467–483. doi:10.1016/j.rse.2003.11.005
- Yamada H 1994: A comparison of the value of the ratio of air temperature reduction effect of open spaces in some cities. J. Jpn. Inst. Landsc. Architec. , 58, 253–256. (in Japanese with English summary). doi:10.5632/jila.58.5_253
- Yamada H , Maruta Y 1988: An actual study on the modification of climate by the open spaces in urban area. J. Jpn. Inst. Landsc. Architec. , 52, 127–132. (in Japanese with English summary). doi:10.5632/jila1934.52.5_127
- Yamada H , Maruta Y 1990: A quantitative analysis on the mitigation of city temperature by the open spaces in urban area. J. Jpn. Inst. Landsc. Architec. , 54, 299–304. (in Japanese with English summary). doi:10.5632/jila1934.54.5_299
- Yoshida A , Hayashi S , Ishikawa M 2013: Effect of difference of species composition in green space in the city on rainfall recharge function. A case study at the Otomeyama park in Shinjuku ward, Tokyo. J. City Plan. Inst. Jpn. , 48, 1011–1016. (in Japanese with English summary). doi:10.11361/journalcpij.48.1011
- Yukawa N , Onda Y 1995: The influences of understories on the infiltration capacities of Chamaecyparis obtusa plantations (I) experimental results using a mist type rainfall simulator. J. Jpn. For. Soc. , 77, 224–231. (in Japanese with English summary). doi:10.11519/jjfs1953.77.3_224
- Yun Y , Maruta Y , Honjo T , Yanai S 1997: A study on air temperature of urban parks and their surrounding residential areas. J. Jpn. Inst. Landsc. Architec. , 61, 769–772. (in Japanese with English summary). doi:10.5632/jila.61.769