
ABSTRACT
Water stress reduces soybean (Glycine max) yield in fields converted from clayey-soil rice (Oryza sativa) paddies to uplands (upland converted paddies [UCPs]). Subirrigation and/or allowing roots to penetrate to a deeper soil layer were expected to effectively mitigate water stress. Therefore, we examined the effects of subirrigation and slit tillage on mitigating water stress in clayey soils (52% clay) in UCPs. Four treatment experiments (subirrigation, slit tillage, subirrigation control, and slit tillage control) were conducted in each of three growing seasons, with sampling for yield analysis conducted in triplicate. Following conventional tillage, a slit tillage blade was used to cut 15-mm-wide vertical slits in the surface of the soil (cutting depth = 15–20 cm) and seeds were sown 15 mm from the cut lines. Subirrigation then occurred for approximately 21–47 days, from the end of the rainy season, when water table elevation was at 35 cm below ground. We found that subirrigation only resulted in improved soybean yield in 2012, when precipitation after the flowering stage was low, whereas slit tillage significantly increased yield in all three growing seasons, including a particularly wet growing season. Overall, subirrigation and slit tillage increased soybean yield by 2% and 13%, respectively. Slit tillage also resulted in a significantly greater taproot length and root density. Stomatal conductance at midday in about the R5–6 stages was higher in slit-tilled plots than in control plots, but only in the subirrigated field.
1. Introduction
More than 30% of paddy fields in Japan are used to produce upland crops rather than rice (Oryza sativa L.) because potential rice production exceeds domestic consumption (Takahashi et al. Citation2013). In particular, more than 80% of soybean [Glycine max (L.)] production is produced in temporarily drained paddy fields, which are known as upland converted paddies (UCPs). Because paddy fields have low-permeability soil just below the plowed layer, which prevents water infiltration during rice agriculture, moisture excess injury in crops is a major problem when farming UCPs. Furthermore, some studies have reported that water stress after flowering limits soybean yield (Shimada et al. Citation2012; Matsuo et al. Citation2013). This is problematic in the northern part of Japan because the end of the rainy season coincides with the flowering stage in soybean; therefore, the development of the root system is inhibited in the rainy season and the risk of water stress after flowering in UCP fields is increased.
Subirrigation is effective in mitigating water stress (Broughton and Madramootoo Citation1995). A new subirrigation system design has recently been developed that can control the level of the water table (Shimada et al. Citation2012; Matsuo et al. Citation2013). In this system, called ‘FOEAS’ (Farm-Oriented Enhancing Aquatic System), irrigation water is supplied through a pipeline to a water supply unit and then flows into trunk and branch pipes, which are connected to a water-level regulator located on the drainage end of the field. Subdrains are placed at 1-m intervals and connect to the trunk and branch pipes at right angles to allow rapid drainage and uniform distribution of the subirrigated water throughout the field (Shimada et al. Citation2012). This subirrigation system is gradually being implemented in UCPs in Japan.
Some studies have shown that the FOEAS system can effectively increase soybean yield by controlling hydrologic regime (Shimada et al. Citation2012; Matsuo et al. Citation2013). However, the system has proved to be variable in its effects on soybean yield in Japan. For example, Matsuo et al. (Citation2013) showed that the effects of subirrigation vary between years and among soybean cultivars. Annual variations in yield are caused by differences in the magnitude of seasonal precipitation, wherein water stress has little impact on soybean yield in wetter years. In contrast, yield differences between cultivars may be due to differences in root density (Matsuo et al. Citation2013) in that a low root density often results in a low water potential in leaves. Because the rate of water absorption in a plant is limited by the surface area of its roots, low root density results in stomatal closure in leaves and the cessation of transpiration and photosynthesis at midday (Jones Citation1992).
The depth of a root system is another important factor affecting the magnitude of water stress in a plant. Roots that penetrate deeper layers of the soil are more likely to reach the moister soils near the water table. Furthermore, deeper roots increase the rate of capillary rise from the water table. The supply rate of subirrigated water to the rhizosphere is generally slow because it represents unsaturated water flow (Skaggs Citation1981). However, because the rate of capillary rise is a function of the difference in water potential and the distance between the roots and the water table (Skaggs Citation1981), deeper roots increase the rate in capillary rise. The abovementioned studies highlight the importance of root system structure or physiognomy. Reducing the distance between roots and the water table by growing roots deeper into the soil layer or increasing root density is crucial for helping plants mitigate water stress in a UCP.
Well-developed root systems will contribute to the stability of yield by maximizing the potential effects of subirrigation. In addition, plowing is generally adequate for creating conditions for an effective root layer to form. However, as will be discussed later in this paper, we have observed that an effective root zone is limited in the surface layer (0–10 cm) of soil in a plowed, clayey-soil UCP, indicating that plowing alone is not adequate for promoting the growth of a deeper root system in some UCPs. Therefore, in this study, we used slit tillage to stimulate the development of deeper roots and test for the increase in soybean yield in a plowed UCP.
Slit tillage is a plowing method whereby slits are cut (with modified plow blades) into the surface layer of a soil along the seeding lines just before seeding. It has been shown to increase the yields of sorghum (Sorgum bicolor; Karlen et al. Citation1991) and soybean (Seki and Sato Citation2002) by improving the development and penetration of their roots (Hamada et al. Citation1992). Slit tillage would appear to be the most direct approach for producing a soil zone in which roots can fully develop. However, slit tilling is generally considered to be an alternative to plowing to save on labor costs (Karlen et al. Citation1991) and so to date, there has been no examination of the effect that slit tillage has on root development in an already plowed UCP. In addition, little is known about how effective subirrigation is in increasing yield in clayey soils. Because the rate of capillary rise depends on hydraulic conductance (Skaggs Citation1981), clayey soils might, in fact, reduce the effectiveness of subirrigation. If slit tillage in UPCs can improve root development in soybean crops, a combination of subirrigation and slit tillage might be an effective way to increase soybean yields in clay-rich soils of UPCs. Therefore, the objective of this study was to (1) determine if subirrigation increases soybean yield in clayey soils of UCPs, (2) reveal the effect of slit tillage on root development and yield in a plowed, clayey-soil UCP, and (3) examine the combined effects of subirrigation and slit tillage on soybean yield in clayey-soil UCPs.
2. Materials and methods
2.1. Study site, installation of subirrigation system, and field preparation
In this study, we tested the effects of two soil treatments (subirrigation and slit tillage) on soybean yield. The study was conducted in a very heavy, clayey soil in Ohgata village, northeastern Japan (39°58′N, 139°59′E). Ohgata village is reclaimed polder land where water table level is occasionally close to ground surface. The soil was classified as a Typic Hydrauent (USDA Citation2010), with smectite as its dominant clay mineral. Until 2010, the experimental fields were continuously cropped rice paddy fields, cultivated with non-puddling rice. The chemical and physical properties of the plowed layer of the soil in these fields are shown in .
Table 1. Chemical and physical properties of the plow layer of soils in the experimental fields.
Subirrigation systems were installed in June 2011 in four adjacent, 0.5-ha fields to control water table level, the design of which is similar to the system described by Shimada et al. (Citation2012). The main underdrains were constructed at 9-m intervals and at a depth of 50 cm below the ground surface. Subdrains were installed to cross the main drains orthogonally at 2-m intervals and a depth of 40 cm. This high density of subdrains helped spread or drain water uniformly across the experimental field. A constant water table level was maintained via subirrigation through the main drain.
Soybeans were cultivated in all four fields in 2011 to establish rhizobia. In 2012, two of these fields were then used for first growing season of study, with the remaining two fields managed as rice paddies with non-puddling cultivation (). These latter two fields were then converted into upland fields for the 2013 study. This rotation was continued for 4 years, until 2015, to obtain data on soybean yield immediately after conversion from an actively cropped rice paddy (). Our soybean cropping study was designed to evaluate the effects of subirrigation and slit tillage as two independent techniques for mitigating water stress in a UCP. The field in which subirrigation was conducted was switched each year to eliminate any location effects (). Because soybean yield severely declined in 2014, due to failure of seed to germinate (standing ratio <30%), we only used data from 2012, 2013, and 2015 in our analyses.
Table 2. Treatment history of the fields used in the experiment.
Figure 1. Slit-forming mechanism in a modified vacuum seeder (left) and schematic description of the relationship between line and depth of slits and location of seeds (right).
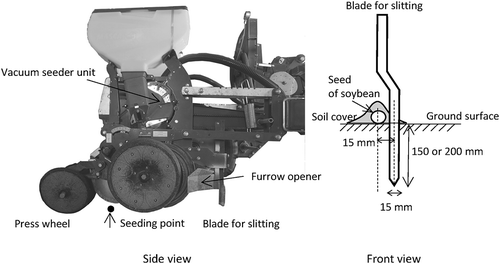
Figure 2. Hydrologic changes in soybean (Glycine max) crop over time during the growing season for (a) evapotranspiration potential (ETo), (b) precipitation, and (c) water balance.
Horizontal, two-ended arrows in (c) demark the rainy season period for each growing season. ETo was calculated from daily mean temperature, wind speed, and daily hours of sunlight (Allen et al. Citation1998) at 10-day intervals. Climatic data were obtained from the Automatic Meteorological Data Acquisition System located 7 km from the experimental site.
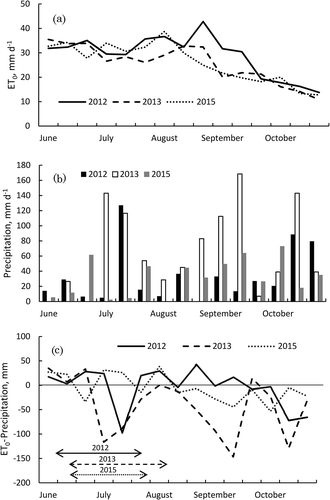
Figure 3. Relationship between the elevation of the water table level and steady-state, upward flux in the experimental fields.
Triplicate profiles are shown to indicate the level of spatial variation. This relationship was calculated from Darcy’s law and unsaturated hydraulic conductivity determined from the water potential of each year, assuming that water potential at the bottom of the effective root layer (−15 cm) was −4.9 kPa.
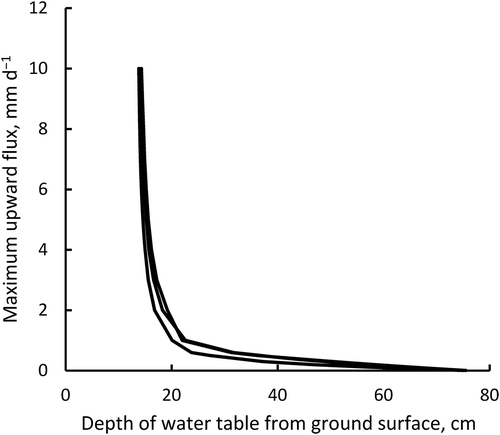
Figure 4. Comparison of soil water potential between subirrigated and control fields during the soybean (Glycine max) growing season.
Water potential was measured at 10-cm depth using a tension meter. Two-ended horizontal arrows below the x-axis indicate the period of subirrigation. Vertical arrows indicate the flowering stage (R1) (Fehr et al. Citation1971) for soybean.
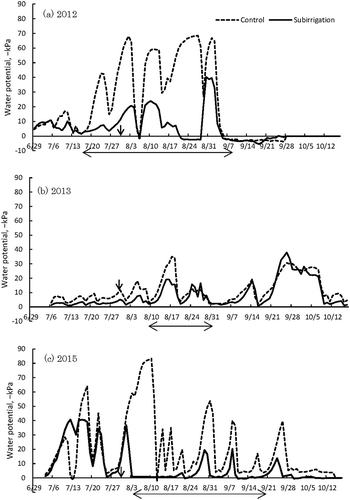
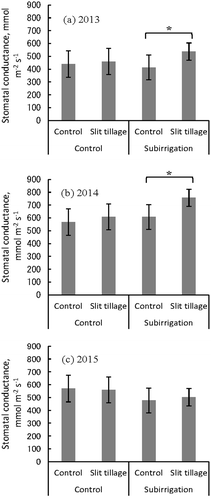
Figure 5. The effects of subirrigation and slit tillage on stomatal conductance at 13:00 in soybean (Glycine max).
*Indicate significant difference (p < 0.05) by t-test. Error bars are the standard deviation based on six replicates. A leaf porometer was used to measure stomatal conductance in the terminal leaflet on the most active trifoliate leaf on the main stem when the soybean growth stage was between R5 and R6 (Fehr et al. Citation1971) (28 August, 2 September 2013, 2014, and 31 August 2015). Six replicate samples were measured for each treatment. Only plants with normal germination were measured in 2014, because there was a low standing crop (therefore, sampling was not random that year).
2.2. Soybean cropping treatments
A slit tillage plot was prepared in each field. The field was plowed before seeding to a depth of 18 cm in 2012 and 2013 and to a depth of 16 cm in 2015, following by an application of chemical fertilizer (N–P2O5–K2O at 30–30–30 kg ha−1). The seedbed was prepared with a power harrow by tilling the top 10 cm of soil. Field elevation was leveled using a laser leveler before preparing the seedbed, but only in 2012. Soybean seeds of the ‘Ryuho’ cultivar were sown on 5 June 2012, 10 June 2013, and 7 June 2015 (). Seeds were spaced in 75-cm-wide rows, with a 7.5-cm, intra-row spacing, and one plant per hill. We modified the furrow openers of a vacuum seeder to form the slits (). The blades of the modified vacuum seeder were 15-mm wide and were located in front of each seeder. The blades were shaped to form a slit 15 mm to the side of the seeding line, to prevent seed from being dropped into the slit. Slit depth was adjusted to 15 cm in 2012 and 2013, and to 20 cm in 2015. After seeding, intertilling and molding were conducted twice per growing season at around the V5 developmental stage (Fehr et al. Citation1971).
Table 3. Field treatments used for soybean (Glycine max) cropping, by year.
Subirrigation began after the rainy season in July and ended when the frequency of precipitation events increased around early September. Specifically, the subirrigation periods were 45 days from 18 July to 11 September 2012, 21 days from 7 August to 28 August 2013, and 47 days from 2 August to 18 September 2015. Water table depth was maintained at −35 cm in the subirrigated fields. We also tried an alternate irrigation method in the subirrigated field in 2015, called intermittent irrigation, which involved raising the water table level during the irrigation period to within 16 cm of the ground surface each morning (around 7:00) and then dropping it to −35 cm in the evening (around 17:00). These differences in methods of cropping, by year, are summarized in .
Flowering soybeans (R1 stage, Fehr et al. Citation1971) were collected above the first node from three 0.55-m2 areas in each field to determine dry matter weight. Mature crops (R8 stage (Fehr et al. Citation1971) were collected in the same manner from three 1.1-m2 areas in each field to determine plant characteristics (dry matter weight, main stem length, number of branches, number of nodes on stems, and stem radii) and yield components (e.g., number of pods per unit area, number of seeds per pod, and 100-seed weight). All soybeans in each plot were then harvested using a combine harvester. Then, the total yield of the plot was calculated using the producer’s standard method, to compare yield per unit area sampled.
2.3. Measurement of soybean and soil characteristics
Change in water potential over time during the soybean growing season was measured using a tension meter (HD-10; Sensez Corp., Tokyo, Japan) that was installed at a depth of 10 cm from the ground surface at the center of the control (non-slit-tilled) plot in each field. Resistance to soil penetration was measured in the center of each field using an SR-II type cone penetrometer (DIK-5521; Daiki Rika Kogyo Co. Ltd., Saitama, Japan) just after leveling in 2012 and after seeding in 2013 and 2015. Stomatal conductance was measured in 2013, 2014, and 2015 using a leaf porometer (SC-1; Decagon Devices Inc., Pullman, WA, USA). Since no yield data were obtained in 2014 (due to severe damage to the standing crop), stomatal conductance was measured only in sections of the field where soybeans were undamaged. Only plants that had germinated normally were measured; therefore, sampling was not entirely random in 2014. A terminal leaflet of the most active trifoliate leaf on a main stem was measured on 28 August 2013, 2 September 2014, and 31 August 2015 when the soybean plants were between the R5 and R6 growth stages (Fehr et al. Citation1971). Six replicate measurements were taken from each treatment plot at 5:00, 9:00, 11:00, 13:00, 15:00, and 17:00.
Root distribution was determined each year after harvest. Six soybean plants per plot were randomly selected and soil pits were excavated until the lower boundary of the root system could be clearly seen (Watanabe et al. Citation2014). Root size, root abundance, and taproot depth were then determined and recorded following the criteria of the Japanese Society of Pedology (Citation1997). Briefly, root size was categorized according to root diameter: ‘coarse’ (>5 mm), ‘medium’ (2–5 mm), ‘fine’ (0.5–2 mm), or ‘very fine’ (<0.5 mm). For each category, root abundance was then classified as ‘very few’ (100–2000 m−2 for root size category of ‘very fine’ and ‘fine’ and 100–200 m−2 for root size category of ‘medium’ and ‘coarse’), ‘few’ (2000–5000 and 200–500 m−2 for each respective root size category as above), ‘common’ (5000–20,000 and 500–2000 m−2 for the respective root size category as above), ‘many’ (>20,000 and >2000 m−2 for the respective root size category as above), or ‘none’ (0 m−2). Ground surface was defined as the soil surface, before molding. Because observations of root distribution were conducted after molding, we leveled molded rows and then measured depth of root from this leveled surface.
Hydraulic conductivity was measured in 2011 in previously undisturbed soil samples (i.e., before soybean cropping began). Sampling was conducted in triplicate in field B () at depths of 15–25, 25–35, 35–45, and 55–65 cm using two different types of tubes. The sampling tubes used for measuring saturated conductivity were 5.1 cm in diameter and 5 cm in height, whereas tubes used to measure unsaturated hydraulic conductivity were 8 cm in diameter and 8 cm in height and had four small holes (φ = 5 mm) located 1, 3, 5, and 7 cm from the top (in order to insert a micro-tension meter). The cored samples were stored at 4°C until analysis. Saturated hydraulic conductivity was measured using the falling-head-soil-core method (Reynolds and Elrick Citation2002), while unsaturated hydraulic conductivity was measured using the evaporation method (Boels et al. Citation1978; Mohrath et al. Citation1997). To do this, core samples were first saturated with water and placed on a balance, after which a 3-mm, micro-tension meter was inserted into each tube hole. Changes in core water content and water potential at each height of the core were then measured at 1-h intervals during evaporation from the top of the core until the water potential measured by the top tension meter reached −49 kPa. In obtaining the relationship between water volume and water potential, we assumed that the core could be separated into four layers and that the water potential and water content within each layer were uniform (Boels et al. Citation1978). Unsaturated hydraulic conductivity was calculated as the difference in water potential and water flux across each layer (Mohrath et al. Citation1997). Then, hydraulic conductivity was obtained within the range of 0 to −49 kPa.
The maximum steady rate of upward water movement was calculated as a function of water table elevation, using Darcy’s law concerning saturated and unsaturated hydraulic conductivity (Skaggs Citation1981). In our study, we assumed that water potential was −49 kPa at the bottom of the effective root zone and 0 at water table elevation.
Climatic data were obtained during the growing season from the Automated Meteorological Data Acquisition System (AMeDAS), located 7 km from the experimental fields. Potential evapotranspiration (ETo) was calculated following the method of Allen et al. (Citation1998), using data obtained from the meteorological station.
2.4. Statistical analysis
Statistical analysis was performed using R software (R Core Team Citation2014). Yield and yield component data were analyzed with a multiway analysis of variance (ANOVA), in which year of harvest, irrigation, and slit tillage were used as variables. The intermittent irrigation treatment, conducted in 2015, was included as a variable of irrigation method. As shown in Section 3, intermittent irrigation in 2015 was not detected as being significantly different as an interaction effect in ANOVA. The variable of slitting included two slitting depths (15 and 20 cm). Stomatal conductance was analyzed relative to tillage treatment (slit tillage vs. control), using a t-test. Because observations of the root system were discrete data that were not normally distributed, a nonparametric analysis (using ranked data) was conducted using the Scheirer–Ray–Hare extension of the Kruskal–Wallis test (Sokal and Rohlf Citation1995). A p value of <0.05 was considered statistically significant.
3. Results
3.1. Precipitation and estimated evapotranspiration
Values for potential evaporation (ETo), cumulative precipitation, and water balance (ETo minus precipitation) at 10-day intervals are shown in . ETo values were shown as means of daily ETo at each 10-day interval. The lowest precipitation occurred in 2012, when the water balance was always positive, except in mid-July and October. By contrast, high precipitation occurred in 2013, with cumulative precipitation being higher than ETo almost throughout the growing season. The climate was moderate in 2015, with very low precipitation amounts occurring during the rainy season (around July). The obvious decrease in water balance values measured during the rainy seasons of 2012 and 2013 was not observed in 2015. According to the Japan Meteorological Agency, the rainy season occurred from 9 June to 26 July in 2012, from 15 June to 10 August in 2013, and from 16 June to 29 July in 2015.
3.2. Soil hydrological properties
The upward flux of water from the water table, which was calculated from our hydraulic conductivity calculations, is shown in . These values indicate that the flux in capillary rise from the water table was in a steady state, when the water potential at the bottom of the effective root zone was assumed to be −49 kPa. Thus, the values shown in are the theoretical maximum rate of capillary rise, rather than that observed under actual field conditions (Skaggs Citation1981). No difference was detected among the three capillary rise curves. The rate of upward capillary flux was quite low until the depth of the water table level rose to within 20 cm of the ground surface; the estimated capillary rise was only approximately 0.6 mm d−1 when the water table elevation was within 35 cm of the surface.
Water potential values measured at 10 cm depth (using a tension meter) are shown in . The water potential values were lower in the control field than in the subirrigated field in 2012 and 2015, indicating that the subirrigation system worked successfully. However, no apparent difference between the subirrigation and control treatments was detected in 2013. Soybean photosynthesis begins to decline at a water potential of approximately −31 kPa (Kamota et al. Citation1974). The water potential in the control plot was lower than this for 34 days in 2012, for 4 days in 2013, and for 26 days in 2015, demonstrating that water stress most likely occurred in 2012. In addition, there were 5–10 days in 2015 when the water potential was lower than −31 kPa before flowering, the only year that water stress occurred before flowering ().
3.3. Growth and soybean yield
There was no difference in the length of the soybean growth stages between the subirrigation and slit tillage treatments. Day to flowering and day to maturity are summarized in . Flowering day corresponded approximate to the end of the rainy season (). According to Takahashi (Citation1995), a 14-day period from flowering is the most effective period in which yield of soybean can be increased via irrigation; in Japan, this positive effect continues until 27 days after flowering. Because our period of irrigation covered this time frame (), our timing of irrigation was deemed suitable for increasing yield in the light of how soybeans develop.
Table 4. Calendar day of soybean development and related cumulative amount of precipitation.
Red crown rot was found frequently during the 2012 harvest, whereas no severe disease damage was observed in 2013 or 2015. The yield and yield components obtained per unit area sampled are shown in . Coarse grain yield was 280–439 g m−2 across the 3 years of the experiment. Coarse yield for the entire sample () was 77% of the area sampled and there was a positive linear relationship between the two (r = 0.95, p < 0.01). This reduction in yield for the entire sample was ascribed to head loss from using a combine harvester. ANOVA revealed that year significantly affected all of the yield components, with 2015 > 2012 > 2013 for coarse grain yield.
Table 5. Yield, yield components, and other characteristics of mature soybean (Glycine max) under various treatment regimes and between years.
Table 6. Yields (g m−2) of the entire sample of soybean (Glycine max) obtained by combine harvester, by year.
Slit tillage also significantly related to high coarse grain yield. No interaction was detected between slit tillage and either year or subirrigation treatment, indicating that slit tillage increased yield independently of year or irrigation treatment. By contrast, there was an interaction between subirrigation and year, with further testing showing that there was only a significant effect in 2012 (Bonferroni method: p < 0.05). This indicates that subirrigation is only effective for increasing yield in years with low precipitation.
Coarse grain yield is the product of 100-grain weight and the number of pods produced. Although both of these factors tended to vary with yield, neither was significantly affected by slit tillage or subirrigation. However, there was a significant interaction effect between year and subirrigation relative to 100-grain weight, with further analysis showing that subirrigation significantly increased the 100-grain weight only in 2012 (Bonferroni method: p < 0.05). This indicates that subirrigation increased the yield in low precipitation years by increasing the 100-grain weight of soybean seeds.
shows the dry matter weight at flowering (R1) and maturity (R8) stages, by plot. There was no significant difference among treatments and no interaction between year and irrigation treatment at stage R8. Further testing showed that there was only a significant effect in 2012 (Bonferroni method: p < 0.05). This result is consistent with our measurement of coarse grain yield. In contrast, the effect of silt tillage was not detected in dry matter weight at either the R1 or R8 stages.
Table 7. Dry matter weight for stages (flowering: R1; mature: R8) for soybean (Glycine max), and differences in values, by stage, under various treatments, by year.
3.4. Root distribution and stomatal conductance
Taproots grew to a significantly greater depth in the slit tillage plots (mean 14.3 cm) than in the control plots (mean 11.2 cm) in each of the 3 years of the experiment (). However, taproots did not extend to the bottom of the plowed layer (at 16–18 cm) in either treatment and there was no significance among years, suggesting that depth of plowing did not affect taproot growth. Likewise, subirrigation treatment was not significantly related to maximum taproot depth.
Table 8. Root distribution in soybean (Glycine max) at the harvest stage.
In 2012 and 2013, very fine roots developed significantly better in deeper (from taproot tip) soil zones in the slit tillage treatment plots; in 2015, fine roots developed better in both shallower and deeper regions (from taproot tip) in the slit tillage treatment plots than in the subirrigated treatment plots, but there was no difference in very fine roots between treatments. The details of root development pattern differed somewhat among years, but it was clear that slit tillage significantly increased root density in deeper regions of the soil (measured from the tip of the taproot). We were unable to test for differences among years using ANOVA because those data were not normally distributed. However, root density in deeper soil zones (from taproot tip) was higher in 2015 than in the other years.
There was no significant difference in stomatal conductance in the slit tillage treatment except that at time 13:00 in 2013 and 2014 (: results at 13:00 only). In both years, there was significant difference between slit tillage and control in the subirrigated plots (p < 0.05). The duration of sunlight at 13:00 was 0.9 in 2013, 0.7 in 2014, and 0.0 h in 2015.
4. Discussion
4.1. Effect of subirrigation in clayey UCP
This study suggests that subirrigation is effective in increasing soybean yield, even in the clayey soils where capillary rise is slow and when the amount of precipitation is low. Generally, low hydraulic conductivity is disadvantageous when applying subirrigation in clayey soils. In our study, the estimated capillary rise from the experimental fields was only approximately 0.6 mm d−1 at a water table level of 35 cm, which is much lower than the maximum potential ETo rate at the grain-filling stage of 4 mm d−1 (). Water potential in the plowed layer confirmed that the capillary rise rate was lower than ETo. Subirrigation slightly increased the water potential in 2012 (), the year in which the lowest precipitation was observed. However, water potential values were often less than −2.4 kPa (water head = − 25 cm), which is the minimum water potential possible when a water table is maintained at −35 cm and when the water potential of a plow layer is equilibrated with the water table. Consequently, the rate of capillary rise was lower than the rate of evapotranspiration, as expected. Even under such conditions, water potential in our subirrigated plots was usually higher than it was in control plots (). Soybean yield and dry weight significantly increased in response to subirrigation when precipitation was low as mentioned above (), despite the low rate of upward flux in the fields. This result suggests that subirrigation works well in clayey soils with a low potential for capillary rise when precipitation is low.
4.2. Effect of slit tillage on increasing of soybean yield
It has previously been shown that slit tillage increases the production of sorghum (Karlen et al. Citation1991) and soybean (Seki and Sato Citation2002) due to changes that occur in the root systems in slit-tilled fields. Our results support both studies in that we observed that slit tillage had a consistent, positive effect on soybean yield (), although there were large fluctuations among years. Slit tillage significantly increased grain yield only, not the dry matter weight at maturity (). Soybeans contain high protein concentrations and the photosynthetic energy required for protein production is 2.8 times larger than what is required for carbohydrate production (Connor et al. Citation2011). The dry matter weight at maturity may not directly reflect cumulative photosynthesis during reproduction stage.
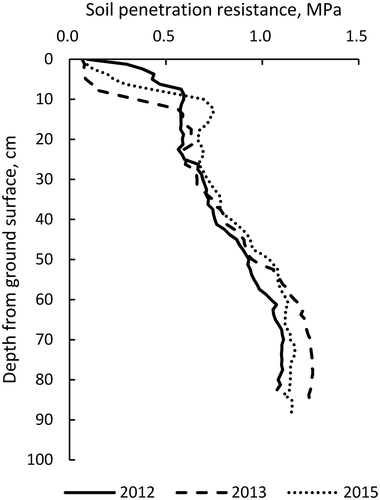
Elkins and Hendirick (Citation1983) suggested that slits produced by slit tilling eliminates soil strength as a barrier in compacted soil layers and improves the movement of oxygen deeper into soils, allowing roots to grow deeper. Most studies show that root elongation is limited by the hard layer compacted by machinery. In our study, we demonstrated that slit tillage effectively improves the root system in an already plowed UCP. In our experimental UCPs, elongation of taproots, in response to slit formation, was likely due to slit tilling providing conditions for oxygen to penetrate into deeper soil layers, rather than loosening the hard layer. This is because the penetration resistance in the shallow layer of the soil (to approximately 50 cm) was less than the magnitude at which root penetration usually becomes inhibited (0.8–1.4 MPa) (; Kubota et al. Citation1983; Seki et al. Citation2001). Furthermore, the gleyed layer, where anaerobic conditions occur during the rainy season, was detected just below the seedbed, suggesting that the shallow root system was due to anaerobic conditions, rather than to soil hardness. Therefore, the apparent effects of slit tillage in our study were similar to the studies of Karlen et al. (Citation1991) and Seki and Sato (Citation2002), even though factors that limited root penetration in the field seemed to be quite different.
Figure 6. Soil penetration resistance profiles for experimental plots.
Soil penetration resistance was measured with an SR-II type cone penetrometer just after leveling the fields in 2012 and after seeding in 2013 and 2015, prior to slit tilling. Both values were obtained from the center of each field.
Both Karlen et al. (Citation1991) and Seki and Sato (Citation2002) indicate that mitigation of water stress is major reason that slit tillage increases yield (by improving root development). Our study partially supports their conclusions in that stomatal conductance in our subirrigated plots were significantly higher in the slit tillage treatment than the control plot in years when it was partly sunny to sunny at the time of measurements (at midday), essential for measuring stomatal conductance (). Our results indicate that a combination of subirrigation and slit-tilled soil enabled stomata to open at midday under cloudless weather conditions. Stomata of crop plants often close at midday in response to water stress (Sojka et al. Citation1977; Shimada et al. Citation2012), resulting in a decline in leaf water potential and insufficient water uptake by the roots, causing the rate of water absorption by roots to be lower than the rate of dissipation to the atmosphere by transpiration. This so-called midday depression occurs even if soil water potential is high, such in a flooded rice paddy (Hirasawa et al. Citation1992). This is because the movement of water from soil to the leaves is limited by root surface area (Adachi et al. Citation2011). Therefore, a high root density helps mitigate this limitation by increasing total root area. Midday depression of transpiration results in a reduction in photosynthesis around midday, when the solar radiation is highest, consequently reducing productivity. This could explain why slit tillage significantly increased yield even in years of higher than normal precipitation. Although we found a significant difference of stomatal conductance between slit-tilled fields and control fields, this difference only applied to subirrigated fields. However, we would expect that stomatal conductance would also be higher in slit-tilled fields that are not irrigated, since fields subjected to slit tillage had higher yields, regardless of whether or not they were irrigated. This apparent inconsistency may reflect the difficulty of measuring stomatal conductance. We measured stomatal conductance only 1 day per year, but stomatal conductance responds to changes in environmental condition over time (Jones Citation1992) and this variation among plants was wide in our study. Our preliminary results demonstrate that more carefully designed experiments are needed to clearly understand the relationship between stomatal conductance and yield.
It is also possible that slit tillage may have mitigated excess moisture injury to soybeans (during the rainy season, around July), because deep furrows (slit) from slit tilling appear to have accelerated the rate at which excess water drained from surface soil. We did not test this supposition because we did not measure soil water contents near slits or natural drainage. However, dry matter weight at flowering stage showed no significant relationship with tillage treatment (). More specifically, we observed the tendency of higher biomass in slit-tilled fields. In particular, the difference in mean dry matter weight between tillage treatments (at flowering stage) was 3.5 g m−2 in 2012, 10.5 g m−2 in 2013, and 27.0 g m−2 in 2015. The value was much higher in the driest year (2015) of the 3-year experiment when water potential of soils in control plots occurred at a magnitude considered to be water stressful for soybeans. Slit tillage could have mitigated potential water stress during this unusually dry year, and so, we presume that mitigation of water stress but not of moisture excess injury may have been largely responsible for increased yield we measured in the slit-tilled plots, but further research is required to substantiate this assumption.
The observed increase in yield could also possibly be explained by an increase in nutrient delivery or root access to nutrients due to slit creation. However, this seems unlikely because soybeans accumulate nitrogen via its nitrogen-fixing nodules, and phosphorus and potassium were applied to the fields at a sufficient rate, indicating that nutrient deficiency was unlikely.
4.3. Effect of precipitation on yield
Precipitation likely affects soybean yield. In our study, soybean yield showed a negative relationship with cumulative precipitation (; from seeding to date of flowering), but this relationship did not hold up through later stages (from flowering to maturity or to harvest). This suggests that excess moisture injury before flowering could have been mainly responsible for the loss in yield. In fact, yield was quite high in 2015. Root density in deeper soil layer (from tip of taproot) also increased markedly in 2015 relative to the other years, implying that root development/condition is important for obtaining high yield in UCPs (as also shown by Takahashi et al. Citation2014) and that excess moisture injury before the flowering stage prevents it.
4.4. Comparison of effect of subirrigation and slit tillage on yield
Finally, it is important that the effects of subirrigation and slit tillage on soybean yield are separately evaluated. It is difficult to evaluate the effects of subirrigation quantitatively because it depends on the climate in any given year. By calculating the overarching effect on yield over an extended experimental period (3 years) and by standardizing yield relative to control conditions over those years, we could show that subirrigation and slit tillage independently increased yield by 2% and 13%, respectively (). However, when subirrigation and slit tillage treatments were both applied together, yield increased by 18%. This implies that the interaction effect between these treatments was responsible for the 3% increase in yield, although the interaction effect was not detected statistically. Our results indicate that slit tillage could provide a potentially much larger effect on increasing soybean yield than subirrigation alone in clayey soils of UCPs.
Acknowledgments
The authors thank Mr. Hirofumi Asanuma for conducting the field work. The authors are also thankful to Mr. Tsuyoshi Shimomura and Mr. Hayato Noguchi of Sugano Farm Machinery Mfg. Co., Ltd. for preparing the vacuum seeder for slit formation. The authors would like to thank Enago (www.enago.jp) for the English language review.
Additional information
Funding
References
- Adachi S, Tsuru Y, Nito N, Murata K, Yamamoto T, Ebitani T, Ookawa T, Hirasawa T 2011: Identification and characterization of genomic regions on chromosomes 4 and 8 that control the rate of photosynthesis in rice leaves. J. Exp. Botany., 62, 1927–1938
- Allen RG, Pereira LS, Raes D, Smith M 1998: Crop evapotranspiration: guidelines for computing crop water requirements. Irrigation and Drainage Paper No. 56, Food and Agriculture Organization of the United Nations, Rome.
- Boels D, Jbhm VG, Veerman GJ, Wit KE 1978: Theory and system of automatic determination of soil moisture characteristics and unsaturated hydraulic conductivities. Soil Sci., 126, 191–199
- Broughton SR, Madramootoo CA 1995: Effects of four water table depth on soybean yields. In Subirrigation and Controlled Drainage, eds. Belcher HW, D’ltri FM, pp. 97–110. CRC Press, Inc., Boca Raton
- Connor DJ, Loomis RS, Cassman KG 2011: Crop Ecology Productivity and Management in Agricultural Systems, 2nd edn pp. 300. Cambridge Univ. Press, Cambridge
- Elkins CB, Hendirick JG 1983: A slit-plant tillage system. Transaction of ASAE., 26, 710–712
- Fehr WR, Caviness CE, Burmood DT, Penningston JS 1971: Stage of development descriptions for soybean. Glycine Max (L.) Merrill. Crop Sci., 11, 929–931
- Hamada Y, Nonoyama T, Shaku I, Kojima H, Sawada Y, Miyashita H 1992: Promotion method to hasten the development of root system. Res. Bull. Aichi Agric. Res., 24, 61–67 in Japanese with English summary
- Hirasawa T, Tsuchida M, Ishihara K 1992: Relationship between resistance to water transport and exudation rate and the effect of the resistance on the midday depression of stomatal aperture in rice plants. Jpn. J. Crop Sci., 61, 145–152
- Japanese Society of Pedology 1997: Soil Survey Handbook, pp. 91, Hakuyu-sha, Tokyo, in Japanese
- Jones HG 1992: Plants and Microclimate, second pp. 285–288. Cambridge Univ. Press, Cambridge
- Kamota F, Ban Y, Shimura K 1974: Studies on photosynthesis and transpiration of vegetable crops I differential response to soil moisture in photosynthesis and transpiration among crops. Bulletin Veg. Ornamental Crop Res. Stn. Series A., 1, 109–139 in Japanese with English summary
- Karlen DL, Edwards JH, Busscher WJ, Reeves DW 1991: Grain sorghum response to slit-tillage on Norfolk loamy sand. J. Prod. Agric., 4, 80–85
- Kubota T, Castelo Branco JL, Ike M 1983: Soybean root penetration as affected by the compact layer in Cerrado Oxisol. Jpn. J. Soil Sci. Plant Nutri., 54, 389–395 in Japanese
- Matsuo N, Takahashi M, Nakano H, Fukami K, Tsuchiya S, Morita S, Kitagawa H, Nakano K, Nakamoto H, Tasaka K 2013: Growth and yield responses of two soybean cultivars grown under controlled groundwater level in southwestern Japan. Plant Prod. Sci., 16, 84–94
- Mohrath D, Bruckler L, Bertuzzi P, Gaudu JC, Bourlet M 1997: Error analysis of an evaporation method for determining hydrodynamic properties in unsaturated soil. Soil Sci. Soc. Am. J., 61, 723–735
- R Core Team 2014: R: A language and environment for statistical computing. R Foundation for Statistical Computing, Vienna, Austria. URL http://www.R-project.org/(June, 2016).
- Reynolds WD, Elrick DE 2002: Falling head soil core method. In Methods of Soil Analysis Part 4–physical Methods, eds. Dane JH, Topp CC, pp. 809–812. Soil Science Society of America, Inc., Wisconsin
- Seki Y, Hiba T, Bordon J 2001: Root distribution of soybean plants in No-tillage fields in Yguazu distinct of Paraquay. Nettai Nogyo, 45, 33–37 in Japanese with English summary
- Seki Y, Sato O 2002: Slit-sowing effects on soybean root distribution in no-tillage fields of Paraguay. Nettai Nogyo, 46, 290–294 In Japanese with English summary
- Shimada S, Hamaguchi H, Kim Y, Matsuura K, Kato M, Kokuryu T, Tazawa J, Fujimori S 2012: Effects of water table control by farm-oriented enhancing aquatic system on photosynthesis, nodule nitrogen fixation, and yield of soybean. Plant Prod. Sci., 15, 132–143
- Skaggs RW 1981: Water movement facators important to the design and operation of subirrigation systems. Transactions ASAE., 24, 1553–1561
- Sojka RE, Scott HD, Ferguson JA, Rutledge EM 1977: Relation of plant water status to soybean growth. Soil Sci., 123, 182–187
- Sokal RR, Rohlf FJ 1995: Biometry the Principles and Practice of Statistics in Biological Research, thirdedn pp. 440–447. Freeman and Co., New York
- Takahashi M 1995: Increasing of yield of soybean by irrigation and top dressing in upland fields converted from rice paddies, miscellaneous Pub. Hokkaido Natl. Agric. Exp. Stn., 53, 25–33 in Japanese
- Takahashi T, Mochida H, Sakakibara M, Morimoto S, Kobayashi H, Aiba S 2014: Investigation of the factors reducing soybean productivity in the Tohoku region of Japan. Bull. Tohoku Agric. Res. Cent., 116, 89–118 in Japanese with English summary
- Takahashi T, Nira R, Sumida K 2013: A new framework for study of irrigated paddy rice and upland crop rotation farming and its relation to soil and plant nutrition science. 1. Advances and perspectives in irrigated paddy rice and upland crops rotation farming. Jpn. J. Soil Sci. Plant Nutri., 84, 202–207 in Japanese
- USDA 2010: Keys to Soil Taxonomy 11th, Books Express publishing, pp. 346. http://www.nrcs.usda.gov/wps/PA_NRCSConsumption/download?cid=stelprdb1252094&ext=pdf (August 2017)
- Watanabe S, Kasahara Y, Matsumori K, Yoshikawa H 2014: Brief investigation method for the root and assessment of the growth pattern of the root in low ridges of outdoor eggplant culturing. Jpn. J. Soil Sci. Plant Nutri., 85, 519–524 in Japanese