
ABSTRACT
Considerable nitrogen (N) losses from intensive vegetable systems have become an important source of environmental damage. A high-efficiency N application to minimize N pollution and improve production is urgently needed. Here, we conducted field experiments to identify the effects of a single application of controlled-release urea (CRU), conventional urea (CU), and chicken manure (CM) on N losses and yields improvement in a greenhouse tomato system in Beijing, China. Five treatments were carried out: no N control (CK), lower rate of CRU with CU and CM (CRN1), medium rate of CRU with CU and CM (CRN2), higher rate of CRU with CU and CM (CRN3), and conventional fertilization (CN). The results showed that the single application of CRU, CU, and CM reduced the nitrate N concentration and N2O emissions by 22 to 79% and 39 to 51%, respectively, compared with the conventional fertilization . Based on the N application rate, the average nitrate N concentration showed an exponential increase, and the cumulative N2O emissions showed a linear increase. Compared to the CN treatment, the CRN1, CRN2, and CRN3 treatments decreased fertilization cost by 44%, 22%, and 3.4%, while raising yields by 9.6%, 17%, and 2.0%, respectively. The apparent N surplus of the CRN1 and CRN2 treatments was reduced by 39% and 13% relative to the CN treatment, whereas the CRN3 treatment was as high as that of the CN treatment. It can be concluded that applying CRU, CU, and CM at the higher rate hardly improved the yield but increased the risk of N losses, whereas the lower and medium rates of CRU could reduce N pollution and improve production. The CRN2 treatment, reducing the CRU rate by 25%, with the highest economic efficiency, was the best choice to achieve greater yields with less environmental impacts in greenhouse tomato systems.
Abbreviations: CRU, controlled-release urea; CU, conventional urea; CM, chicken manure; DAT, days after transplanting.
1. Introduction
China has the largest vegetable growing area in the world, comprising 41% of the global vegetable area (FAO Citation2014). Farmers often apply excessive amounts of N fertilizer and water to minimize the risk of yields reduction in the vegetable growing system. The amount of synthetic N fertilizer input in greenhouses has reached 556–1257 kg N/ha in Beijing and Shandong Province, northern China (He Citation2006; Yang et al. Citation2007). The excessive application of N fertilizer results in much lower N-use efficiency and higher nitrous oxide (N2O) emissions (He et al. Citation2009; Gao et al. Citation2011). However, vegetable yields increase at a much lower rate in comparison with the increase of N fertilizer application (Liang et al. Citation2015; Yuan et al. Citation2015). Optimizing the input of N fertilizer, such as reducing the N application rate and improving root zone management, could significantly minimize the environmental pollution of N2O emissions, nitrate leaching, and ammonia volatilization from intensive vegetable systems (Song et al. Citation2009; Ren et al. Citation2010; Min et al. Citation2012; Zhao et al. Citation2012), but the improvement of vegetable yield is still very limited, and in some cases, the yields even decrease by more than 40% (Min et al. Citation2012; Badra, et al. Citation2016). Since growing greenhouse vegetables is the main economic source of vegetable farmers, obtaining high yields to improve income is always their first goal. Therefore, it is an essential requirement to develop an efficient N management system that aims to significantly improve vegetable yields while simultaneously mitigating N losses to protect the environment.
Inefficient N absorption and utilization are considered to be key reasons for low yields. Vegetable root systems are shallower than cereal crops. Synthetic N easily leaches out of the root zone in the greenhouse with frequent and large flood irrigation water. Increasing soil C/N can enhance organism immobilization of mineral N, so as to prevent soil N leaching under the greenhouse system (Zhao et al. Citation2012). However, several split N applications are still necessary, which result in more labor input and higher cost of fertilization. Alternatively, a single application (or called ‘one-off’ application) of controlled-release urea (CRU) could reduce N leaching and N2O emissions (Shaviv Citation2000) and also improve yields and the quality of agricultural products in rice, wheat, and tomato growing systems because of a better synchronization between the N release rate of CRU and N requirements of crops (Kiran et al. Citation2010; Simonne and Ozores Citation2010; Geng et al. Citation2016). However, the high cost of CRU limits its use in the cropping systems, although a single application of CRU can save labor cost.
Since controlled-release fertilizers have various release types, a variety of application methods can be developed to improve the efficiency of N absorption (Shaviv Citation2000; Tian and Saigusa Citation2005). Recently, a sigmoid type of CRU was developed by the Beijing Engineering Technology Research Center for Slow/Controlled release Fertilizer, which shows delayed N release early in the growing stage and accelerated N release later. In contrast, conventional urea (CU) supplies most of the N at the early stage after its application, whereas organic fertilizer such as chicken manure (CM) provides a steady N supply. If the sigmoid CRU, CU, and CM are applied before seedling transplanting and no more fertilizer is applied later (a single application of CRU, CU, and CM), a sufficient and optimal N supply will be provided throughout the growing season. This is because the CRU can provide most of the N for the uptake peak after plant flowering, whereas CU and CM can supply N mainly in the early growing stage. Simultaneously, the cost of the single application is decreased because the cheaper CU is added. Thus, our hypothesis is that higher yield with lower environmental pollution can be realized in a greenhouse system by this single application of CRU, CU, and CM. To test this hypothesis, a two-season tomato experiment was conducted in Beijing, China. We investigated the nitrate N concentration of soil leachate water, N2O emissions, soil mineral N supply, and tomato yields and accessed the risk of environmental pollution based on the N application rate.
2. Materials and methods
2.1. Experimental site
Experiments were conducted in two successive growing seasons from August 2012 to June 2013 in a typical greenhouse in the Shunyi district of Beijing, northern China (40°09′19′′ N, 116°46′47′′ E). The climate of this region is warm-temperate, subhumid continental, and monsoonal with cold winters and hot summers. Annual precipitation is 500–700 mm per year, two-thirds of which are concentrated between June and August. The greenhouse was 120 m long, 13 m wide, and 4.0 m high with clay walls on three sides and polyethylene sheets over the top, and had a 3-year history of continuous vegetable cultivation with conventional management by a local farmer. The top soil (0–20 cm) in the greenhouse had a loamy texture, a pH of 7.92 (1:1 soil to water), 16.9 g/kg organic matter, 1.31 g/kg total-N (Douglas et al. Citation1980), 47.9 mg/kg sodium bicarbonate extractable P, and 196 mg/kg ammonium acetate extractable K. The bulk density of the 0–200 cm soil depth was 1.54, 1.57, 1.65, 1.61, 1.57, 1.53, 1.54, 1.54, 1.55, and 1.55 g/cm3 at each 20 cm interval. The water table was about 50 m deep, and the average nitrate-N content in the irrigation water was 3.56 mg N/L.
2.2. Treatments
The test included five treatments: (1) CK – neither organic fertilizer nor chemical N fertilizer was used; (2) CN – CU at a rate of 600 kg N/ha plus 134 kg N/ha from CM (composted organic fertilizer, CM) following conventional practices, 240 kg N/ha urea, and 134 kg N/ha manure for basal application, and another 360 kg N/ha urea for topdressing in three equal splits at 30, 61, and 83 DAT in the first season, and at 68, 90, and 104 DAT in the second season; (3) CRN1 – low N rate of CRU at 240 kg N/ha plus 60 kg N/ha CU and 134 kg N/ha CM, and all the CRU, CU, and CM were applied before transplanting as basal fertilization, no N topdressing during the growth season; (4) CRN2 – medium N rate of CRU at 360 kg N/ha plus 90 kg N/ha CU and 134 kg N/ha CM, and the same fertilization method was used as with the CRN1; and (5) CRN3 – high N rate of CRU at 480 kg N/ha plus 120 kg N/ha CU and 134 kg N/ha CM, and the same method as with the CRN1 treatment was used. All treatments were arranged in a randomized complete block design with three replications. Each plot was 13.2 m2, 11 m long, and 1.2 m wide.
In each treatment, 270 kg/ha P2O5 and 225 kg/ha K2O as basal fertilizer were applied, and another 225 kg/ha K2O was topdressed at the stage of the first fruit set of tomatoes. Phosphate and potassium fertilizers were superphosphate (P2O5: 18%) and potassium sulfate (K2O: 50%), respectively. The CM, from a broiler chicken farm, was composted by an aerobic and high-temperature method in a composting plant to produce an organic fertilizer product, which has N 1.78%, P2O5 1.62%, K2O 0.94%, organic matter 46%, and water content 30%. Basal fertilizers were broadcasted on the soil surface and then incorporated into the soil by plowing. For the topdressing, CU and potassium sulfate were dissolved in water in a bucket and delivered with furrow irrigation.
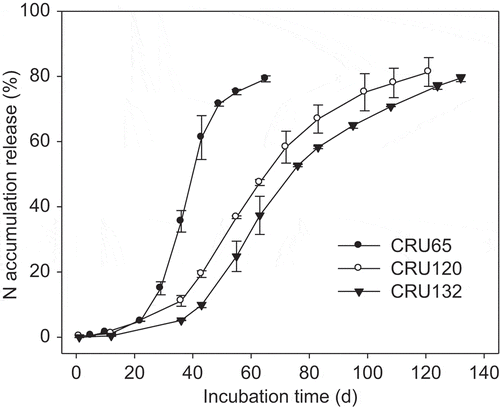
CRU was made up of a core of urea granule with a shell of polyethylene-polymer coating. Three types of polymer-coated urea with release longevities (days for the accumulative release rate to reach 80% of N in CRU as measured in water at 25°C) of 65 d, 120 d, and 132 d (CRU65, CRU120, and CRU132) were used (). The N contents of CRU65, CRU120, and CRU132 were 42%, 41%, and 41%, and the polymer-coating fractions were 8.6%, 9.5%, and 11%, respectively. CRU65, CRU120, and CRU132 were mixed at a ratio of 1:2:2 to ensure enough N supply throughout the growing season.
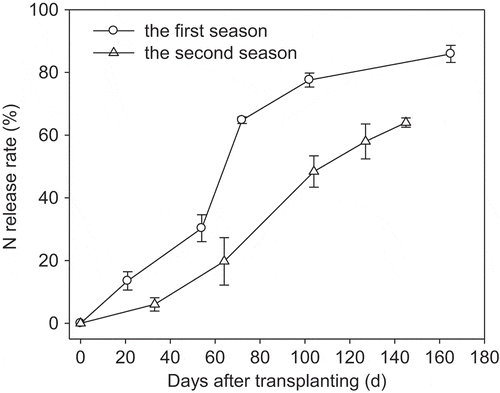
Figure 1. The accumulative release rate of N from controlled-release urea (CRU) in 25°C water.
2.3. Crop management
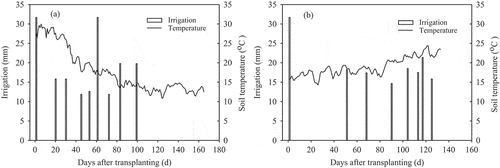
Each plot includes one raised bed (0.7 m × 11 m) and two roads (0.25 m × 11 m for each road). Tomato seedlings (cv. Jinpeng F1) were transplanted on 5 August 2012 in the first season and on 28 January 2013 in the second season, and harvested on 16 January 2013 and 20 June 2013, respectively. Two rows of seedlings were transplanted on the raised bed at a plant density of 46,000 plants/ha with a space between plants of 0.33 m and a space between rows of 0.35 m. Furrow irrigation was used according to the local practice with total amounts of 171 and 156 mm water for the first season and second season, respectively. A water meter (Rotating vane type-LXS15, Shanghai Huguang, Co. Ltd., China) was installed in the main pipeline to measure the amount of water applied, and the irrigation rate was based on the average value of a farmer-investigation around the vegetable farm. There is a furrow in the center of each bed. Irrigation water was applied only in the furrow in most of the irrigation events, except for two times (transplanting day and 61 days after transplant) in the first season and one time (transplanting day) in the second season, in which water was applied both in furrow and in road. The time and amount of each irrigation event are shown in . The soil temperature at 15 cm depth was automatically recorded by two electronic thermometers (LogTag Recorders, New Zealand), and the data are also shown in .
Figure 2. Irrigation events and the soil temperature at 15 cm depth in the first season (a) and the second season (b).
2.4. Soil collecting and analysis
Soil samples were taken with a soil auger (35 mm diameter) from 0 to 20 cm depth at the flowering stage (24 days after transplanting (DAT) in the first season, 33 DAT in the second season), the first fruit set period (42 DAT in the first season, 63 DAT in the second season), the second fruit set period (76 DAT in the first season, 103 DAT in the second season), and the fourth fruit set period (102 DAT in the first season, 123 DAT in the second season). At the end of harvesting (165 DAT in the first season, 145 DAT in the second season), 0–100 cm soil samples were taken in 20-cm depth increments. Soil samples of the same soil depth from four random points per plot were mixed as a composite sample and then passed through a 5-mm sieve. Fresh soil samples were extracted immediately with 0.01 mol L−1 CaCl2 solutions and analyzed for mineral N (NO3–N and NH4+-N) by a continuous flow analyzer (TRAACS 2000, Bran and Luebbe, Germany). The soil water content was measured by oven-drying at 105 °C for 12 h.
2.5. Fruit collecting and plant analysis
The harvest area was 3.5 m × 1.2 m in the middle of each plot at the appropriate harvest time. Tomato fruits were picked every 7–10 days in the first season and every 3–5 days in the second season. Fresh weight was recorded at each harvest to calculate the total yield per plot. At the end of the harvest, three plants were taken from each plot. Shoot and fruit tissues were separated and dried at 70 °C in a forced air oven for 48 h. Dry weights were recorded, and Kjeldahl N was determined in fruit and plant biomass samples (Douglas et al. Citation1980).
2.6. N release of CRU in the field
To measure the N cumulative release rates in field conditions, a nylon mesh bag (20 cm × 5 cm) containing 5.00 g polymer coated urea was used as one sample. Fifteen samples were prepared for each type of CRU (CRU65, CRU120, and CRU132). The bags containing different CRUs were buried at 10 cm depth in soil in one bed next to the corresponding experiment area. Samples were collected in the seedling stage, the fruit set periods, and after harvest (21, 54, 72, 102, and 165 DAT in the first season, and 33, 64, 104, 127, and 145 DAT in the second season). Three bags were collected from each CRU at each sampling date. The bags were taken back to the laboratory, rinsing the clay, and oven-drying at 60 °C to a constant weight. The dried granules in each bag were crushed and transferred into a 500 ml volumetric flask, metering the volume with distilled water. N content of the solution in the volumetric flask was analyzed using the Kjeldahl digestion method (Douglas et al. Citation1980). The N release rate was calculated using the following equation:
N release rate (%) = (N applied in the bag at the beginning -N left in the bag)/N applied in the bag at the beginning× 100.
2.7. Soil water collecting and nitrate N concentration analysis
A soil solution extractor method was used to collect soil water (Zotarelli et al. Citation2007). The extractor is composed of a ceramic clay cup (1.5 cm diameter× 3.0 cm height), a sampling glass bottle (500 ml), and some plastic hose connections. Two cups were buried 5 m apart in 1.0 m soil depth in each plot. After applying a pressure of −30 kPa with a suction pump at the day before sampling, water permeated the clay cup and then flowed into the sample bottle automatically. Soil water was collected at 6, 17, 33, 47, 69, 97, 126, and 163 DAT in the first season and at 33, 46, 62, 77, 101, 117, and 137 DAT in the second season, approximately 3–5 days after each irrigation or fertilization, and at the first DAT and the last days of each growing season. The water volume in the bottle was measured at each sampling time, and 100 ml of water was transferred to a small plastic bottle for analysis. Water samples were taken back to the laboratory and stored in an icebox (−18 °C). At the end of each season, nitrate N concentration of the samples was analyzed using a continuous flow analyzer (TRAACS 2000, Bran and Luebbe, Germany).
2.8. Measurements of nitrous oxide
Gas samples were collected using the closed-chamber technique (He et al. Citation2009). A cylindrical base chamber of 0.3 m in diameter × 0.15 m in height made of polyvinyl chloride (PVC) was inserted into the soil to a depth of 10 cm between two plants in one row of each plot, and a cover chamber of 0.3 m in diameter × 0.22 m in height was put on the channel of the base. Next, 400 ml water was poured in the channel to make the chamber gas-tight. In the first season, samples were collected at 2, 3, 6, 11, 21, 23, 29, 31, 32, 39, 46, 47, 55, 62, 63, 67, 73, 74, 81, 90, 94, 101, 108, 116, 125, 138, and 165 DAT. In the second season, samples were collected at 21, 22, 33, 41, 43, 46, 53, 54, 55, 59, 69, 72, 74, 77, 83, 89, 93, 97, 106, 108, 122, and 137 DAT. After each fertilization and/or irrigation, frequent collection (one sample per day) was arranged, and then the frequency was decreased to once every 3–7 days, and at the last days of each season, collecting interval was above 10 days. Samples were taken between 8:30 and 10:30 in the morning. For each sample, air collection was taken twice at a 30 min interval using a 20 ml disposable syringe through a rubber septum fitted on the top of chamber, and then transferred into a 13 ml glass tube for transport to the laboratory. At the same time, the soil and air temperatures were also measured. The N2O concentration of gas samples was analyzed by gas chromatography (GC-14B, Shimadzu, Japan) with an electron capture detector (ECD) using nitrogen (N2) as the carrier gas. For details for the GC–ECD method, see Wang and Wang (Citation2003). N2O flux (μg N/m2/h) was calculated by the temporal increase in N2O concentration during the measurement interval. The cumulative seasonal N2O emission (kg N/ha) was the product of the daily mean flux and the duration of the season.
2.9. Nitrogen surplus
The apparent N surplus of N inputs and outputs in the soil-plant system was estimated for each growing season. The inputs included soil mineral N before planting, N from applied fertilizers, and N from irrigation water. The outputs included plant N uptake and residual soil mineral N. Because most tomato roots are typically distributed 0–60 cm deep within the soil (Zotarelli et al. Citation2009), only the top 60 cm of the soil layer was used for the N budget calculations. The calculating formula was as follows:
Apparent N surplus = N inputs – N outputs
2.10. Data analysis
All results are presented as treatment means. Data were subjected to one-way analyses of variance followed by means comparison using Tukey’s studentized range test at the 5% level for tomato yields, soil mineral N, plant N uptake, and total N2O emissions. Analyses of variance and multiple means comparison were conducted in Statistical Analysis Systems (SAS) version 9.1. Based on the data collected from the CRN1, CRN2, CRN3, and CK treatments, response models were tested to assess the responses of nitrate N concentration in soil water, N2O emissions, and tomato yields to an increase in the N application rate. The relationship between these data was fitted with exponential, linear, and parabolic models using SigmaPlot 12 for Windows (Systat Software Inc. USA). The R2 values were used for model selection, in addition to a visual inspection of each type of response curve. The exponential model fitted better for the relationship between N rate and nitrate N concentration in soil water, the linear model was superior in describing the relationship between N rate and N2O emissions, and the parabolic model produced the best fit for the data between N rate and tomato yields. The selected response models were used to provide an estimate for an optimal controlled-release N rate in a high-yielding tomato system with lower environmental pollution. The economic analysis was calculated using the cost of labor and fertilizers and the income from tomato fruits. The prices of each item and the calculation formulas have been listed in the calculated table.
3. Results
3.1. Nitrate N concentration of the soil water
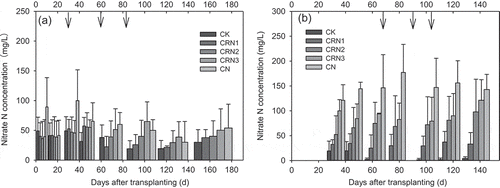
In the first season, most of the nitrate leaching occurred in the early growing stage. The nitrate N concentration of CN treatment was the greatest among the treatments after the basal fertilization and the first N top-dressing in the first season (), suggesting a large potential for nitrate leaching. In terms of the three CRU treatments, however, the nitrate N concentrations ranged from 36.1 to 52.5 mg/L relative to 41.6 to 100 mg/L of CN treatment from the transplanting to 40 DAT, resulting in a reduction of 13.0–47.5%. Throughout the first season, the average nitrate N concentrations of CK, CRN1, CRN2, CRN3, and CN treatments were 34.7, 37.4, 40.8, 48.0, and 61.3 mg/L, respectively, showing a reduction of 22–39% in the three CRU treatments compared to the CN treatment. In the second season, with the lower temperatures and fewer irrigation events (), the risk of nitrate leaching was small before 40 DAT. After 40 DAT, nitrate N concentration differed significantly between the CN treatment and the other treatments (). The CN treatment had the highest level of nitrate N concentration on each sampling date (ranging from 122 to 177 mg/L), suggesting a great risk of nitrate leaching. The average values of nitrate N concentrations of CK, CRN1, CRN2, CRN3, and CN treatments in the second season were 7.06, 31.6, 73.2, 93.0, and 148 mg/L, respectively. Three CRU treatments reduced the nitrate N concentration by 37–79% relative to the CN treatment. Therefore, for both seasons, using CRU could prevent nitrate leaching in the early stage of the first season and later in the second season.
Figure 3. Nitrate N concentrations in soil water at a depth of 100 cm in the first season (a) and the second season (b). (The solid arrows represent N top-dressing only for CN treatment at 30, 61 and 83 DAT in the first season, and at 68, 90 and 104 DAT in the second season, respectively).
3.2. N2O emissions
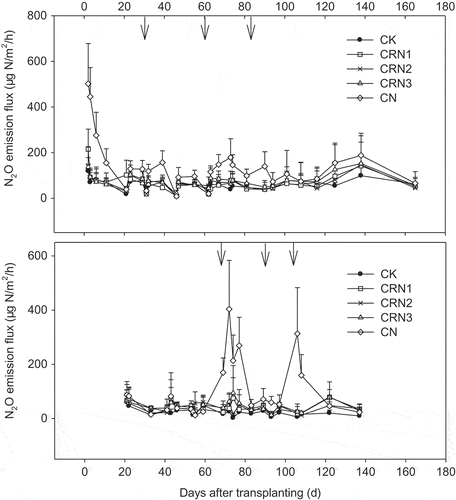
The highest N2O emissions were from the CN treatment in both seasons, at 502 μg N/m2/h and 404 μg N/m2/h in the first season and the second season, respectively (). For the first season, the average emission fluxes of each treatment ranged from 60 to 144 μg N/m2/h, and for the second season, they ranged from 22.7 to 103 μg N/m2/h. Low emissions occurred in the later autumn to winter and winter to early spring stages during which the temperature was the coldest in the year that can mitigate N2O generation. The cumulative amounts of N2O emissions were 2.47–5.33 kg/ha in the first season and 0.69–2.60 kg/ha in the second season (). The N2O emissions from the CN treatment in both seasons were significantly higher than those of the other treatments. Compared with the CN treatment, the N2O emissions from the three CRU treatments were reduced by 39–51%. It is further noted that in the second season, the N2O emissions from the CRN3 treatment were significantly higher than that of CK. However, there were no differences among CRN1, CRN2, and CK. The N2O emissions factor of the CN treatment (0.32%) was significantly higher than those of the CRN treatments (0.08–0.11%), showing a rise of 188–306%.
Table 1. Total N2O emissions in the seasons of 2012 and 2013.
Figure 4. N2O fluxes during the first season (a) and the second season (b) in a greenhouse tomato cropping system in Beijing, northern China.
3.3. Yields and economic profit analysis
There was no significant difference in yields between treatments in the first season (). In the second season, however, a significant difference occurred between the CRN2 and CK treatments, showing an increment of 24.9% for the CRN2 treatment in comparison with the CK treatment. For the sum yield of two seasons, the CRN1, CRN2, and CRN3 treatments increased by 2.2, 10, and 17%, respectively, compared to the CN treatment. The yield of CRN2 treatment was significantly higher than that of the CN treatment, but the difference between the CRN1, CRN3, and CN treatments was not significant.
Table 2. Tomato yields in the seasons of 2012 and 2013.
The fertilizer cost of the CRN1 treatment was 15% lower than that of the CN treatment, whereas the fertilizer costs of the CRN2 and CRN3 treatments were 24–63% higher than that of the CN treatment (). However, the cost of fertilization (including fertilizer and labor cost) of the CRN1, CRN2, and CRN3 treatments was reduced by 41%, 22%, and 3.4% compared with that of the CN treatment, respectively, because of using the single application. The economic efficiency of the CRN1 and CRN2 treatments was much higher, indicating better economic effect of fertilization.
Table 3. Nitrogen fertilizer and labor costs as well as income from fruits for the two seasons.
3.4. N release from CRU and soil N supply
As shown in , N release from CRU rose slowly at the beginning and then accelerated in the middle and late growth stages. The release curve of CRU is just like a sigmoid (S) type as we aimed, which is helpful to supply N to synchronize plant requirement after plant flowering. In the second season, the N released more slowly than that of the first season. Lower temperature in the second season, as shown in , may be the main factor for the delayed N release from CRU.
Figure 5. Cumulative N release rate from CRUs under field conditions in the two seasons.
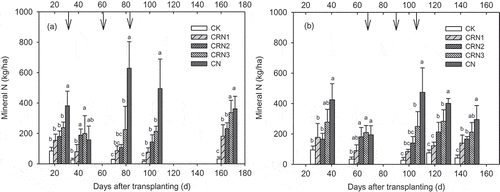
In the first season, the mineral N (NO3–N and NH4+-N) supply from the CN treatment was significantly higher than the other treatments at 24, 76, and 102 DAT (). The mean value of mineral N of CN treatment was 405 kg N/ha, which is more than 10 times higher than that of the CK (37.5 kg N/ha), leading to an excessive N supply and a higher risk of N loss. Compared with the CN treatment, the N supply of the three CRU treatments did not sharply change and rose gradually during the fruit set periods due to the lower N release from CRU, resulting in average values of 116, 170, and 242 kg N/ha for CRN1, CRN2, and CRN3, respectively. In the second season, the mineral N of the CN treatment was the highest among all treatments, and significant difference was found between the CN and CRN3 treatments at 103 and 125 DAT (). The average N supply for CK, CRN1, CRN2, CRN3, and CN treatments in the second season were 54.9, 123, 173, 246, and 358 kg N/ha, respectively, and a reduction of 31.2–65.7% was seen for the three CRU treatments relative to the CN treatment.
Figure 6. Mineral N dynamics in the 0–20 cm soil layer from seedling to harvest in the first season (a) and the second season (b).
3.5. N surplus
The calculated apparent N surplus was often used to indicate N losses from different N treatments. The apparent N surplus of the CK treatment in the first season was 15.1 kg N/ha, suggesting that soil N supply was enough, even if no N was used (). However, in the second season, a negative value (−168 kg N/ha) occurred in the CK treatment, indicating that N supply had become inadequate. However, for other treatments, the calculated apparent N surplus ranged from 236 to 532 kg N/ha in the second season, showing an increasing trend with N application rate. The sum of apparent N surplus of the CRN3 treatment for two seasons was as high as that of the CN treatment, leading to unavoidable nitrate leaching risk. Nevertheless, for the CRN1 and CRN2 treatments, the apparent N surplus was reduced by 39% and 13%, respectively, resulting in a significant difference between the CRN1 and CN treatments.
Table 4. Calculated apparent N surplus in the greenhouse tomato system in 2012 and 2013 in Beijing, China.
3.6. The risk of N pollution
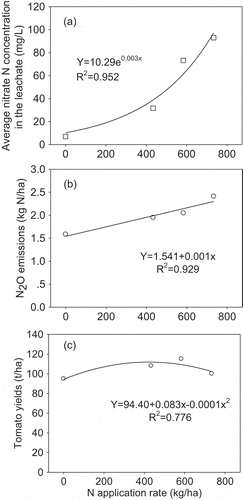
Under the CK, CRN1, CRN2, and CRN3 treatments, the correlation relationship of the nitrate N concentration of soil water based on N application rates shows an exponential increase (). When applying N above 600 kg/ha, the nitrate N concentration dramatically increased, suggesting that the environmental risk of nitrate leaching was very high. For N2O pollution, the N2O emissions increased linearly based on the N application rate (), but the highest N2O emission rate was much lower than that of the CN treatment (). The response of tomato yields to N application rate was a parabolic curve (). However, at the highest N application rate of 734 kg/ha, the yields declined. From the three curves, they suggest that higher tomato yields with lower N pollution of nitrate and N2O occurred at the lower N rate from 434 to 584 kg/ha.
Figure 7. Relationships between the N application rate and the average nitrate N concentration in the soil water (a), N2O emissions (b), and tomato yields (c) under the CK, CRN1, CRN2, and CRN3 treatments based on regression analysis.
4. Discussion
Nitrate leaching is the main pathway of N loss in greenhouse systems. Reducing the N rate is often regarded as the most important measure to minimize N leaching. When decreasing the synthetic N rate by 40%, the N concentration in soil water was reduced by 23–40% (Min et al. Citation2012; Zhao et al. Citation2012). However, it is difficult to maximize the crop production just by optimizing the N application rate since the yields decline when the soil N supply is less than 150 kg/ha in the root zone (0–30cm) (Ren et al. Citation2010). In our study, when decreasing the synthetic N rate by 50%, the nitrate N concentration of the CRN1 treatment was reduced by 39–79% without yields declining, in comparison with the CN treatment. Furthermore, the nitrate N concentration of the CRN2 treatment was reduced by 33–50%, with a yield increase of 17%. The reason for significantly reducing nitrate losses in the CRU treatments was that a synchronous N supply based on plant uptake was developed. When CM, CU, and CRU were applied together, time synchronization between N supply and plant uptake was established (as shown in and ), which can reduce excessive N supply in the early stage and increase N supply in the late stage. Meanwhile, the granules of CRU remained in the top 0–20 cm of soil and released N continuously around the root zone throughout the growing season, resulting in a spatial coincidence between nutrients and tomato roots to enhance N absorption rather than to leaching. However, in the CN treatment, the average N supply of 405 kg N/ha in the first season and 358 kg N/ha in the second season () was excessive, which was much higher than the ecological threshold of 90 kg N/ha (Declercq et al. Citation2001), leading to a great risk of N losses. Moreover, as shown in , the CU granules used in the CN treatment usually dissolve in soil water and transform into nitrate readily and move out of the 0–20 cm soil root zone soon after the irrigation (Rajput and Neelam Citation2006; Ju et al. Citation2007). Therefore, it is hard to establish the spatial coincidence between the CU and tomato roots to absorb N efficiently. Similar results were reported by Zheng et al. (Citation2016) in a wheat-maize system, who found that blending CRU and CU can improve yields and N-use efficiency by 6.8–9.8% and 13.2–37.6%, respectively, and decrease soil N accumulation by 25.2% compared with CU, because the single application of mixture of CRU and urea closely matched the crop requirement for N during the whole growth period. In our study, however, the N release rate of CRU was only 64% after the harvest in the second season, leading to a portion of N remaining in the CRU, which will be released during the fallow and next season to supply new crop.
The application of controlled-release fertilizer is an effective way to decrease N2O emissions in open crop fields (Ji et al. Citation2011, Citation2012; Soon et al. Citation2011). However, in greenhouse vegetable systems, excessive N fertilizer and large irrigation water inputs may lead to higher N2O emissions than that from open-field systems (Gao et al. Citation2011). Reducing the N application rate is a better management to decrease N2O emissions. When the N rate was reduced by 69–76%, a N2O reduction of 27–51% was reported in a tomato greenhouse system (He et al. Citation2009). However, there are few data on N2O reduction by CRU in the vegetable systems. In our study, compared to CN treatments, the three CRU treatments reduced N2O emissions by 39–51%, but the CRU application rate was only reduced by 0–40%. Adding nitrification inhibitors in urea application could reduce the N2O emissions by 55–63% in a greenhouse system, but the risk of ammonia volatilization is greatly increased (Guo et al. Citation2012). Although no data on NH3 volatilization was presented in our study, it was reported that using CRU could reduce NH3 volatilization by about 30% relative to CU, resulting in a significant reduction in NH3 loss (Yang et al. Citation2010; Sun et al. Citation2016; Li et al. Citation2017). Thus, the application of CRU may be a more efficient management to prevent N2O emissions in greenhouses. N2O emission increased linearly based on the CRU application rate, which is different from the exponential relationship between the N rate and N2O emissions (Cui et al. Citation2013). The very low N2O emissions from the CRN3 treatment may explain this difference. Even at the same N application rate of 734 kg/ha, the CRN3 treatment can reduce N2O emissions by 39% compared with the CN treatment. The slow release of N from CRU and the single application of CRU, CU, and CM may contribute to the reduction of N2O emissions, because of the decline of N supply after transplanting and the cancellation of N top-dressing. Top-dressing can increase N supply intensity significantly in the CN treatment (), which is an important driving force to generate N2O emissions, as shown in . Therefore, several peaks of N2O emissions were reduced by canceling the N top-dressings in the CRU treatments. When taking emitted N2O-N as the fraction of applied N, the N2O emission factor (0.32%) of the CN treatment was close to the values (0.27–0.30%) reported by He et al. (Citation2009), but was lower than the values (0.49–1.19%) reported by Zhang et al. (Citation2010). However, the N2O emission factor for CRU treatments was only 0.08–0.11%, which are very low values for vegetable systems in China (Zheng et al. Citation2006; Zhang et al. Citation2010). In addition, the N2O emission of CK in the first season was much higher than that of in the second season, which may be related to the large N application of the farmer’s practice in the last season before this study. Overuse of N fertilizers could increase the residual N in the soil profile, which resulted in more N2O emissions in the first season of our experiment.
Generally, low environmental damage and high yields are in conflict with one another. However, in recent studies, the crop yields and N-use efficiency were increased by 22–91% and 119–121%, respectively, compared to conventional practices (Fan et al. Citation2009; Chen et al. Citation2011). Such higher improvements are not only due to the decrease in N input, but also due to the increment of plant N absorption and larger root systems by an integrated soil-crop system management approach (Zhang et al. Citation2011; Cui et al. Citation2013). However, in the greenhouse, vegetable root systems are sparse and poor. In our study, the CRN1 and CRN2 treatments achieved higher yields with lower N rates compared to the CN treatment, which may be related to N absorption improvement resulting from the better N supply and interaction between root and CRU, because controlled-release N is beneficial to the proliferation of fine roots to increase N uptake (Tian and Saigusa Citation2005; Yang et al. Citation2017). The N rate of the CN treatment was 734 kg N/ha, which is a typical farmer management in vegetable greenhouses in northern China, and often results in low income increment and serious environmental pollution (Yang et al. Citation2007; He Citation2006). The excessive N application in conventional practice produces a higher soil N concentration in the early growth stage, suppressing root growth and development (Tian et al. Citation2008; Lecompte et al. Citation2008; Zhu et al. Citation2015). The early growth stage was considered as a critical period for root zone N manipulation, and a critical threshold of N supply (146 kg/ha) in the root zone was reported from the greenhouse tomato systems of Shouguang, northern China (Ren et al. Citation2010). Maintaining critical mineral N levels in the root zone is the key strategy to solve the conflict between high yields and environmental risk (Guo et al. Citation2008). The CRN1 and CRN2 treatments not only reduced total N input, but also provided reasonable N supply intensity during each growth stage. A slow rise of N supply in the early growth stage and a steady and continuous N supply in the middle and late growth stages (107–173 kg N/ha, ) were established, which benefits fine root development and distribution to increase N absorption and suppress N losses. However, for the CRN3 treatment, the chemical fertilizer N, including 120 kg/ha soluble N from CU and 29–65 kg N/ha released from CRU before 40 DAT (), was 33–100% higher than that of the CRN1 and CRN2 treatments, leading to a much higher soil mineral N content (237 and 277 kg/ha, respectively, ) in the early stage. This high N supply can limit root growth just as the conventional practice does, resulting in poor yields improvement. Furthermore, the CRN1 and CRN2 treatments decreased the N rate by 20–41% relative to the CN treatment, while increasing the income by 10–17% with lower environmental impacts and lower cost of fertilization by a single application of CRU, CU, and CM. Therefore, the approach of a single application of CRU, CU, and CM at a lower rate of 434–584 kg N/ha might be an optimized management for local farmers. Nevertheless, the yield increase of the CRN1 treatment was not significant compared to that of the CN treatment, although the CRN1 treatment produced the lowest environmental impacts. Thus, further study should focus on the improvement of tomato root architecture to increase N absorption and fruit yields at a low application rate of CRU.
5. Conclusions
A single application of CRU, CU, and CM at a lower N rate can improve tomato production while reducing nitrate N leaching risk and N2O emissions, and can greatly save the labor inputs by omitting the N top-dressing. However, at the higher rate of 734 kg N/ha for the single application, the yield improvement was very small and N pollution risk was increased. With the increment of the CRU application rate, the nitrate N concentration of the soil water increased exponentially, whereas the N2O emissions increased linearly. Moreover, the tomato yields showed a trend from rise to decline based on the N application rate. Therefore, it can be concluded that the CRN2 treatment, reducing the CRU rate by 25% from the higher rate of 480 kg/ha, had the highest economic efficiency and was the best choice to achieve both yields and environmental benefits in greenhouse tomato systems. Additionally, further studies are required to explore the potential between greatly increasing yields and root system development under low N and water input conditions.
Supplemental Material
Download PDF (63.5 KB)Supplementary Data
Supplementary data can be accessed here.
Additional information
Funding
Related Research Data
References
- Badra MA, Abou-Husseinb SD, El-Tohamy WA 2016: Tomato yield, nitrogen uptake and water use efficiency as affected by planting geometry and level of nitrogen in an arid region. Agr. Water Manage. 169, 90–97 doi:10.1016/j.agwat.2016.02.012
- Chen XP, Cui ZL, Vitousek PMet al. 2011: Integrated soil–crop system management for food security. PNAS. 108, 6399–6404. doi:10.1073/pnas.1101419108
- Cui ZL, Yue SC, Wang GL, Meng QF, Wu L, Yang ZP, Zhang Q, Li SQ, Zhang FS, Chen XP 2013: Closing the yield gap could reduce projected greenhouse gas emissions: a case study of maize production in China. Glob. Change Biol. 19, 2467–2477 doi:10.1111/gcb.12213
- Declercq P, Salomez J, Hofman G 2001: Environmental pressures and national environmental legislation with respect to nutrient management in Belgium, De Clercq P, Gertsis AC, Hofman G, Jarvis SC, Neeteson JJ, Sinabell FEds, Nutrient Management Legislation in European Countries, Wageningen. the Netherlands, 56–77
- Douglas LA, Riazi A, Smith CJ 1980: A semi-micro method for determining total nitrogen in soils and plant material containing nitrite and nitrate. Soil Sci. Soc. Am. J. 442, 431–433. doi:10.2136/sssaj1980.03615995004400020047x
- Fan MS, Lu SH, Jiang RF, Liu XJ, Zhang FS 2009: Triangular transplanting pattern and split nitrogen fertilizer application increase rice yield and nitrogen fertilizer recovery. Agron. J. 101, 1421–1425 doi:10.2134/agronj2009.0009
- FAO. 2014: Food and Agriculture Organization of the United Nations, Statistics division. http://faostat3.fao.org/home/E.
- Gao B, Ju XT, Zhang Q, Christie P, Zhang FS 2011: New estimates of direct N2O emissions from Chinese croplands from 1980 to 2007 using localized emission factors. Biogeosciences. 8, 3011–3024 doi:10.5194/bg-8-3011-2011
- Geng JB, Chen JQ, Sun YB, Zheng WK, Tian XF, Yang YC, Li CL, Zhang M 2016: Controlled release urea improved nitrogen use efficiency and yield of wheat and corn. Agron. J. 108, 1666–1673 doi:10.2134/agronj2015.0468
- Guo RY, Li XL, Christie P, Chen Q, Zhang FS 2008: Seasonal temperatures have more influence than nitrogen fertilizer rates on cucumber yield and nitrogen uptake in a double cropping system. Environ. Pollut. 151, 443–451 doi:10.1016/j.envpol.2007.04.008
- Guo YJ, Li BW, Di HJ, Zhang LJ, Gao ZL 2012: Effects of dicyandiamide (DCD) on nitrate leaching, gaseous emissions of ammonia and nitrous oxide in a greenhouse vegetable production system in northern China. Soil Sci Plant Nutr. 58, 647–658 doi:10.1080/00380768.2012.726921
- He FF 2006: Studies on optimizing nitrogen management and environmental implications in greenhouse tomato cropping system. Ph.D. Dissertation. Beijing: China Agricultural University (in Chinese with English abstract).
- He FF, Jiang RF, Chen Q, Zhang FS, Su F 2009: Nitrous oxide emissions from an intensively managed greenhouse vegetable cropping system in Northern China. Environ. Pollut. 157, 1666–1672. doi:10.1016/j.envpol.2008.12.017
- Ji Y, Liu G, Ma J, Xu H, Yagi K 2012: Effect of controlled-release fertilizer on nitrous oxide emission from a winter wheat field. Nutr. Cycl. Agroecosys. 94, 111–122 doi:10.1007/s10705-012-9532-y
- Ji Y, Zhang XY, Ma J, Li XP, Xu H, Cai ZC 2011: Effects of applying controlled-release fertilizer and its combination with urea on nitrous oxide emission during rice growth period. Chin. J. Appl. Ecol. 228, 2031–2037 (in Chinese with English abstract).
- Ju XT, Liu XJ, Pan JR, Zhang FS 2007: Fate of 15N-labled urea under a winter wheat-summer maize rotation on the North China plain. Pedosphere. 171, 52–61. doi:10.1016/S1002-0160(07)60007-1
- Kiran JK, Khanif YM, Amminuddin H, Anuar AR 2010: Effects of controlled release urea on the yield and nitrogen nutrition of flooded rice. Commun. Soil Sci. Plan. 41, 811–819 doi:10.1080/00103621003592333
- Lecompte F, Bressoud F, Pares L, Bruyne FD 2008: Root and nitrate distribution as related to the critical plant N status of a fertigated tomato crop. J. Hortic. Sci. Biotech. 832, 223–231. doi:10.1080/14620316.2008.11512373
- Li PF, Lu JW, Hou WF, Pan YH, Wang Y, Khan MR, Ren T, Cong RH, Li XH 2017: Reducing nitrogen losses through ammonia volatilization and surface runoff to improve apparent nitrogen recovery of double cropping of late rice using controlled release urea. Environ Sci Pollut Res. 24, 11722–11733 doi:10.1007/s11356-017-8825-8
- Liang Q, Wang LY, Chen Q, Zhang WF 2015: Analysis and evaluation on nitrogen application status, its utilization efficiency, its influence on yield and soil fertility contribution rate to greenhouse tomato in China. China Veg. 10, 16–21 (in Chinese with English abstract).
- Min J, Zhang HL, Shi WM 2012: Optimizing nitrogen input to reduce nitrate leaching loss in greenhouse vegetable production. Agr. Water Manage. 111, 53–59 doi:10.1016/j.agwat.2012.05.003
- Rajput TBS, Neelam P 2006: Water and nitrate movement in drip-irrigated onion under fertigation and irrigation treatments. Agr. Water Manage. 79, 293–311 doi:10.1016/j.agwat.2005.03.009
- Ren T, Christie P, Wang JG, Chen Q, Zhang FS 2010: Root zone soil nitrogen management to maintain high tomato yields and minimum nitrogen losses to the environment. Sci. Hortic. 125, 25–33 doi:10.1016/j.scienta.2010.02.014
- Shaviv A 2000: Advances in controlled release of fertilizers. Adv Agron. 71, 1–49
- Simonne EH, Ozores HM 2010: Fertilizer and nutrient management for tomato. Florida Tomato Inst. Proceedings, 37–40
- Song XZ, Zhao CX, Wang XL, Li J 2009: Study of nitrate leaching and nitrogen fate under intensive vegetable production pattern in northern China. C. R. Biol. 332, 385–39210.1016/j.crvi.2008.11.005
- Soon YK, Malhi SS, Lemke RL, Lupwayi NZ, Grant CA 2011: Effect of polymer-coated urea and tillage on the dynamics of available N and nitrous oxide emission from Gray Luvisols. Nutr. Cycl. Agroecosys. 90, 267–279 doi:10.1007/s10705-011-9428-2
- Sun HJ, Zhang HL, Min J, Feng YF, Shi WM 2016: Controlled-release fertilizer, floating duckweed, and biochar affect ammonia volatilization and nitrous oxide emission from rice paddy fields irrigated with nitrogen-rich wastewater. Paddy Water Environ. 14, 105–111 doi:10.1007/s10333-015-0482-2
- Tian QY, Chen FJ, Liu JX, Zhang FS, Mi GH 2008: Inhibition of maize root growth by high nitrate supply is correlated to reduced IAA levels in roots. J. Plant Physiol. 165, 942–95. doi:110.1016/j.jplph.2007.02.011
- Tian XH, Saigusa M 2005: Response of tomato plants to a new application method of polyolefin-coated fertilizer. Pedosphere. 154, 491–498
- Wang YS, Wang YH 2003: Quick measurement of CH4, CO2 and N2O emissions from a short-plant ecosystem. Adv. Atmos. Sci. 20, 842–844 doi:10.1007/BF02915410
- Yang JG, He JD, Chen XP 2007: Investigation on crop fertilization and proposals to soil test and fertilizer application in Beijing. Beijing Agric. 26(3), 15–19 (in Chinese with English abstract).
- Yang JG, Liao SQ, Sun YX, Li YM, Zou GY 2017: Response of tomato root system to controlled release nitrogen and its ideal type construction. China Veg. 10, 23–31 (in Chinese with English abstract).
- Yang JG, Xu K, Tong EJ, Cao B, Ni XH, Xu JX 2010: Effects of applying controlled-release fertilizer blended with conventional nitrogen fertilizer on Chinese cabbage yield and quality as well as nitrogen losses. Chin. J. Appl. Ecol. 2112, 3147–3153 (in Chinese with English abstract).
- Yuan HM, Martin B, Clive R, Chen Q 2015: Fertilization and catch crop strategies for improving tomato production in North China. Pedosphere. 253, 364–371. doi:10.1016/S1002-0160(15)30004-7
- Zhang FS, Cui ZL, Fan MS, Zhang WF, Chen XP, Jiang RF 2011: Integrated soil–crop system management: reducing environmental risk while increasing crop productivity and improving nutrient use efficiency in China. J. Environ. Qual. 40, 1051–1057 doi:10.2134/jeq2010.0292
- Zhang ZX, Y E L, Hua L, Wan YF, Jiang NN 2010: Effects of different fertilizer levels on N2O flux from protected vegetable land. Trans. CSAE. 265, 269–275 (in Chinese with English abstract).
- Zhao Y, Luo JH, Chen XQ, Zhang XJ, Zhang WL 2012: Greenhouse tomato–cucumber yield and soil N leaching as affected by reducing N rate and adding manure: a case study in the Yellow River Irrigation Region China. Nutr. Cycl. Agroecosys. 94, 221–235. doi:10.1007/s10705-012-9535-8
- Zheng QX, Ying XX, Guang XX 2006: Measurments of nitrous oxide emission from vegetable production in China. Atmospheric Environ. 4012, 2225–2234. doi:10.1016/j.atmosenv.2005.12.008
- Zheng WK, Zhang M, Liu ZG, Zhou HY, Lu H, Zhang WT, Yang YC, Li CL, Chen BC 2016: Combining controlled-release urea and normal urea to improve the nitrogen use efficiency and yield under wheat-maize double cropping system. Field Crops Res. 197, 52–62 doi:10.1016/j.fcr.2016.08.004
- Zhu JY, Hui F, Li M, Ma YT, Yu HJ, Jiang WJ 2015: Effect of different nitrogen concentrations on roots architecture and nitrogen use efficiency in potting tomato seedling. Trans. CSAE. 3123, 131–137 (in Chinese with English abstract).
- Zotarelli L, Scholberg JM, Dukes MD 2009: Tomato yield, biomass accumulation, root distribution and irrigation water use efficiency on a sandy soil, as affected by nitrogen rate and irrigation scheduling. Agr. Water Manage. 96, 23–34 doi:10.1016/j.agwat.2008.06.007
- Zotarelli L, Scholberg JM, Dukes MD, Muñoz-Carpena R 2007: Monitoring of nitrate leaching in sandy soils: comparison of three methods. J. Environ. Qual. 36, 953–962 doi:10.2134/jeq2006.0292