
ABSTRACT
Quantitative evaluation of denitrification by the dual isotope approach, which measures the stable isotope ratios of nitrogen (δ15N) and oxygen (δ18O) in nitrate, has been hampered by the wide range of values reported for the ratio of enrichment factors for 15N and 18O (15ε and 18ε, respectively) during denitrification. The objectives of this study were to determine 15ε and 18ε values at different denitrification rates under controlled conditions, and to infer possible mechanisms by which the 18ε/15ε ratio is influenced under different conditions. Column experiments were conducted at 25, 15, and 10°C, which enabled determination of 15ε and 18ε at different denitrification rates, in the absence of nitrate replenishment from ammonium oxidation and other sources. The values of 15ε and 18ε ranged from −11.8 to −14.9‰ and from −8.4 to −15.9‰, respectively, with 15ε less sensitive to changes in the denitrification rates. The resultant 18ε/15ε ratio, ranging from 0.70 to 1.17, was close to the values reported for sediment incubations, and larger than those for groundwater systems. These results are consistent with the explanations that 18ε/15ε value itself is close to unity during denitrification, and that at smaller denitrification rates, concurrent reactions including re-oxidation of nitrite to nitrate lead to smaller apparent fractionation of 18O and smaller 18ε/15ε ratios. This suggests that while linear relationships between δ18O and δ15N give a strong evidence of denitrification, apparent 18ε/15ε values are site specific and depend on the ambient conditions. In evaluating denitrification in such systems, we suggest the use of 15ε in preference to 18ε because 15ε is less sensitive to denitrification rates.
1. Introduction
Nitrate (NO3−) levels in the biosphere have been increasing in recent years due to the use of fertilizers and combustion of fossil fuels (Galloway et al. Citation2004, Citation2008). Excess NO3− in terrestrial ecosystems can contribute to various environmental problems, such as nitrogen saturation in forests (Stoddard Citation1994), eutrophication in aquatic ecosystems (Vitousek and Howarth Citation1991), and the deterioration of drinking water quality, and has prompted many studies of NO3− dynamics in terrestrial ecosystems.
Denitrification is a microbial process that can decrease terrestrial NO3− levels by reduction via nitrite (NO2−) and nitrous oxide (N2O) to dinitrogen (N2) under anaerobic conditions. The identification and quantitative evaluation of denitrification processes is crucial for predicting the fate of NO3− in terrestrial ecosystems. In the last few decades, the dual isotope approach, which measures stable isotope ratios of nitrogen and oxygen in NO3− (designated by δ15NNO3 and δ18ONO3, respectively), has been used to investigate denitrification processes and their role in nitrogen cycles in terrestrial ecosystems (e.g., Campbell et al. Citation2002; Ohte et al. Citation2004; Panno et al. Citation2006; Kendall et al. Citation2007; Osaka et al. Citation2010). The approach is based on the observations that NO3− derived from different sources have different values of δ15NNO3 and δ18ONO3, and that there is a simultaneous increase in δ15NNO3 and δ18ONO3 values during denitrification process (Kendall et al. Citation2007), as expressed by the Rayleigh equations:
where C is the NO3− concentration in the solution (g N m−3), Δδ15NNO3 and Δδ18ONO3 are respective changes in δ15NNO3 and δ18ONO3 from the values at an arbitrarily chosen reference point where C = C0. The enrichment factors for 15N and 18O during denitrification are designated by 15ε and 18ε, respectively. A positive constant Δδ18ONO3/Δδ15NNO3 ratio observed in a spatial or temporal sequence is indicative of the presence of denitrification, with Δδ18ONO3/Δδ15NNO3 = 18ε/15ε if Δδ18ONO3 and Δδ15NNO3 follow Eq. (1) and (2). The method has enabled the identification of denitrification as well as NO3− sources in the environment, where the mixing of NO3− from different sources with different δ15NNO3 values could also be responsible for the spatial variation of δ15NNO3.
A challenge in the quantitative evaluation of denitrification by the dual isotope method is that a wide range of values, ranging from 0.48 to 0.76, have been reported for the Δδ18ONO3/Δδ15NNO3 (and hence 18ε/15ε) ratio for denitrification (Böttcher et al. Citation1990; Aravena and Robertson, Citation1998; Mengis et al. Citation1999; Fukada et al. Citation2003; Panno et al. Citation2006). Because of the large volume of sample solutions required for δ15NNO3 and δ18ONO3 analyses in earlier studies, the values cited above were based on watershed-scale field observations. In addition, δ18ONO3 values determined in the earlier studies were potentially biased because of the exchange of oxygen with glassware or contamination by oxygen-bearing contaminants in silver nitrate (Revesz and BöHlke Citation2002; Kendall et al. Citation2007).
The development of the denitrifier method for measuring isotopic compositions of NO3− (Sigman et al. Citation2001; Casciotti et al. Citation2002) has enabled accurate determination of δ15NNO3 and δ18ONO3 in much smaller samples than before. Using the denitrifier method, Δδ18ONO3/Δδ15NNO3 values for denitrification at watershed scales were reported to range from 0.50 to 0.76 (Lohse et al. Citation2013; Wexler et al. Citation2014; Ji et al. Citation2017). Granger et al. (Citation2008) reported that most of the denitrifiers they studied had Δδ18ONO3/Δδ15NNO3 values close to unity during pure incubation in vitro. Using aquifer, lake and marine sediment materials, Carrey et al. (Citation2013), Vidal-Gavilan et al. (Citation2013), Carrey et al. (Citation2014), and Kessler et al. (Citation2014) investigated isotopic fractionations during denitrification in laboratory columns, and reported 18ε/15ε values of 0.88–1.04, 0.68–0.88, 0.99, and 0.78, respectively. These values were larger than those reported from field observations, and reinforced the necessity to determine the 18ε/15ε values under a wider range of experimental conditions and to identify the factors affecting the apparent fractionation.
A plausible explanation for the different 18ε/15ε values between field observation and laboratory incubation is that isotope ratios at watershed scales are likely to be affected by N transformation processes other than denitrification, and could lead to an erroneous estimate of 18ε/15ε for denitrification. Osaka et al. (Citation2010) suggested that the concurrence of nitrification and denitrification led to Δδ18ONO3/Δδ15NNO3 values in the groundwater of forested watersheds lower than those expected when denitrification alone was occurring. Another plausible explanation is the differences in the denitrification rate in the field and laboratory incubation. Mariotti et al. (Citation1988) reported that 15ε in denitrification is influenced by the denitrification rate, with a larger fractionation (i.e., more negative 15ε) expected for a smaller denitrification rate.
Despite the importance of accurate measurements of 18ε/15ε values in quantitative evaluation of denitrification at field scales, there have been a limited number of studies which investigate how the 18ε/15ε value varies under different conditions. In the present study, we hypothesized that denitrification rates could exert influences of different magnitudes on 15ε and 18ε, and that this could partly explain variations of 18ε/15ε values under different conditions. The objectives of the study were (i) to determine the enrichment factors 15ε and 18ε at different denitrification rates in soil column experiments in the absence of nitrification or mixing of NO3– from different sources, and (ii) to infer possible mechanisms by which the Δδ18ONO3/Δδ15NNO3 ratio are influenced by denitrification rates. Implication of the results in the interpretation of field-measured 18ε/15ε values is also discussed.
2. Materials and methods
2.1. Soil
The soil samples used in this study were collected from the topsoil layer (0–15 cm depth) of a paddy field at the Central Region Agricultural Research Center, National Agriculture and Food Research Organization, Joetsu, Japan (37°06′58′′ N, 138°15′30′′ E). The light clayey soil, having sand (>0.02 mm), silt (2–20 μm), and clay (<2 μm) contents of 0.265, 0.382, and 0.353 kg kg−1, respectively, was classified as montmorillonitic, mesic, Typic Epiaquept (Soil Survey Staff Citation1992). The field had received 55 kg N ha−1yr−1 of ammonium chloride and 15 Mg ha−1yr−1 of rice straw compost for more than 10 years. The total nitrogen and carbon contents of the soil were 3.1 and 30.2 g kg−1, respectively, and the δ15N value of the total nitrogen was 0.7‰. The soil was air dried at room temperature, sieved with a 2.0-mm screen, and used for subsequent experiments.
2.2. Column denitrification experiments
Laboratory denitrification experiments were conducted to determine the isotope enrichment factors (18ε and 15ε) from the measurement of δ15NNO3, δ18ONO3, and NO3− concentration profiles in the pore water in soil columns, to which a solution containing NO3− was continuously loaded. The experiments were conducted at different ambient temperatures to examine possible effects of denitrification rates on isotope fractionation.
Two series of experiments, Ex-1 and Ex-2, were conducted using soil columns of different lengths. In Ex-1, the ambient temperature was maintained at 25°C, and a 15-cm length column with an inside diameter of 5.0 cm (Column A in ) was used. In Ex-2, the ambient temperature was lower, and was initially set at 15°C. After loading NO3−-containing solution for 216 h, the temperature was lowered to 10°C. A longer, 24-cm column with the same inside diameter (Column B in ) enabled a longer period of observation of slower denitrification processes. Both columns were equipped with sampling ports from which porous plastic water samplers (0.25 cm in diameter and 4.5 cm long; Rhizosphere Research Products, Wageningen, The Netherlands) were inserted to allow the collection of pore water at different distances from the column inlet using 5.0-mL plastic syringes. The columns were placed in a thermostatic chamber to control the ambient temperature.
Figure 1. Setup of laboratory soil columns used in denitrification experiments. The calcium nitrate solution was loaded from the inlet and pushed upward by a micro-tube pump. The columns were equipped with sampling ports for the collection of pore water with porous plastic tubes. Columns A and B were used in Experiments 1 and 2, respectively.
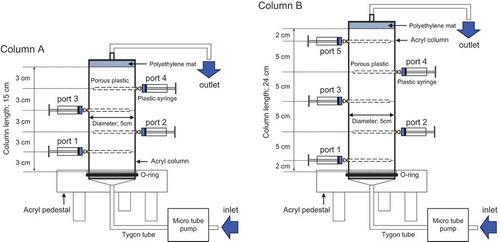
After packing air-dried soil into columns to a bulk density of 1.06–1.10 Mg m−3, a culture solution containing approximately 50 mg N L−1 of calcium nitrate and 100 mg L−1 of 2-amino-4-chloro-6-methylpyrimidine (AM), added as a nitrification inhibitor, was injected to the columns in the upward direction using a microtube pump (). The initial NO3− concentration of approximately 50 mg N L−1 was within the range typically found in agricultural soils. The AM interferes with the oxidation of NH4+ to NO2− by Nitrosomonas sp. (Prasad et al. Citation1971). The solution was supplied from a 20-L polyethylene tank through a Tygon® tube to the bottom of the columns at a constant flux of 0.60–0.66 cm h−1 (). This water flux was chosen such that there was sufficient residence time in the columns for the changes in the NO3− concentration as well as δ15NNO3 and δ18ONO3 values to be easily detected while minimizing confounding effects of NO3− diffusion on the isotopic values (Lehmann et al. Citation2003). Near-saturated conditions developed in the columns approximately 24 and 36 h after commencing the loading of the solution in Ex-1 and Ex-2, respectively. About 5 mL of pore water was collected from the sampling ports of the columns, located at 3, 6, 9, and 12 cm (Ex-1), and 2, 7, 12, 17, and 22 cm (Ex-2) distance from the column inlet, at elapsed times of t = 118, 165, and 216 h in Ex-1 and t = 121, 192, and 314 h in Ex-2. A time interval of 98 h between the switch of temperature and the third sampling in Ex-2 was large enough to make the solution in the columns completely displaced so that the effects of the earlier temperature did not persist at the third sampling. The column experiments were conducted in triplicate (Columns 1–3 in Ex-1, and Columns 4–6 in Ex-2).
Table 1. Summary of column denitrification experiments.
The collected pore water was filtered through a 0.20-μm cellulose acetate filter (25CS020AS; Advantec, Tokyo, Japan) and stored in polypropylene tubes at −25°C until analysis for dissolved ion concentrations and stable isotope ratios. The δ15NNO3 and δ18ONO3 values were determined by the denitrifier method (Sigman et al. Citation2001; Casciotti et al. Citation2002) using isotope ratio mass spectrometry (Delta V, Thermo Fisher Scientific, Waltham, MA, U.S.A). The dissolved NO3− concentration was determined with an ion chromatograph (Dionex DXi-500, Thermo Fisher Scientific).
2.3. Determination of NO3− consumption rate and nitrogen and oxygen enrichment factors
The average NO3− consumption rate per unit mass of soil, J (g N kg−1 h−1), during steady-state water flow was calculated for each column from
where Cin and Cout are NO3− concentrations (g N m−3) at the inlet and outlet of the column, respectively, q is the water flux density (m h−1), A is the cross-sectional area of the column (m2), and m is the mass of dry soil (kg) in the column. Assuming a first-order reaction, the rate constant for denitrification k1 (h−1) is given by:
where tL is the travel time of the solution through the column (h), calculated from the relationship
where L is the length of the column (m), and θ is the average volumetric soil water content (m3 m−3) in the column. In a saturated soil, θ is equal to the total porosity of soil, and calculated from
where ρs is the particle density of soil, taken as 2.60 × 10³ kg m−3 in the present study.
For each column, Δδ15NNO3 and Δδ18ONO3 of the pore water samples (i.e., changes in δ15NNO3 and δ18ONO3 from those in the incoming solution) were plotted against ln ([NO3−]/[NO3−]ini), where [NO3−] and [NO3−]ini are NO3− concentrations in the pore water and the incoming solution, respectively. The enrichment factors 15ε and 18ε were obtained as the slopes of the linear regression lines for Δδ15NNO3 and Δδ18ONO3, respectively, with C/C0 = [NO3−]/[NO3−]ini in Eq. (1) and (2). In calculating 15ε and 18ε, we assumed that NO3− diffusion had negligible effects on the distribution of NO3− concentration and isotope compositions in the columns. In our column experiments, the Peclet number (Smedt and Wierenga Citation1979), defined as Lu/D where L is the column length, u (= q/θ) is the local flow velocity, and D is the NO3− diffusion coefficient (= 1.90 × 10⁻⁵ cm2 s−1), was as high as 233–394, showing the predominance of convective transport in the NO3− transport in the columns.
3. Results
3.1. Nitrate consumption process in the columns
With increasing distance from the inlet of the columns, there were gradual decreases in NO3− concentration, accompanied by simultaneous increases in δ15NNO3 and δ18ONO3 (). Concentration of NO2− was below the limit of quantitation. The NO3− consumption rates calculated with Eq. (3) were in the range of 1.00–1.15, 0.43–0.52, and 0.28–0.41 mg N kg−1 h−1 at the ambient temperatures of 25°C, 15°C, and 10°C, respectively. Steady-state NO3− consumption was established before t = 118 h in Ex-1, and t = 121 h in Ex-2 (at 15°C). With further passage of time, only small changes in the NO3− concentration and δ15NNO3 and δ18ONO3 values were observed, and the resultant NO3− consumption depended on the temperature only. We presume that steady-state NO3− consumption had also been established in Ex-2 before the solution sampling at t = 314 h, which was conducted 98 h after resetting the temperature from 15°C to 10°C.
Figure 2. Profiles of (a) NO3− concentration and (b) δ15NNO3 and (c) δ18ONO3 values at different elapsed times in the columns.
3.2. Nitrogen and oxygen enrichment factors and Δδ18oNo3/Δδ15nNo3 in denitrification
shows plots of Δδ15NNO3 and Δδ18ONO3 against ln ([NO3−]/[NO3−]ini) at different locations in the columns. The values of 15ε and 18ε for each column, obtained from linear regression analyses using Eq. (1) and (2), ranged from −11.8 to −14.9‰ and from −8.4 to −15.9‰, respectively (). The 18ε values were less negative (i.e., smaller fractionation) at lower ambient temperatures with a smaller denitrification rate, while 15ε values were relatively insensitive to the ambient temperature (, ). presents the relationships between Δδ15NNO3 and Δδ 18ONO3 at different ambient temperatures. The difference in the temperature sensitivity between 18ε and 15ε resulted in a smaller Δδ18ONO3/Δδ15NNO3 at low ambient temperatures with lower denitrification rates. In , the isotopic enrichment factors 15ε and 18ε and the ratio 18ε/15ε are plotted against the denitrification rate constant k1 for different ambient temperatures. At ambient temperatures of 25, 15, and 10°C, with the average k1 of 0.066, 0.025, and 0.016, the average 18ε/15ε was 1.00, 0.78, and 0.80, respectively.
Figure 3. Relationships between (a) Δδ15NNO3 and (b) Δδ18ONO3 and the natural logarithms of NO3− concentration, normalized with respect to that in the incoming solution, in the column experiments. Δδ15NNO3 and Δδ18ONO3 are, respectively, the changes in δ15NNO3 and δ18O NO3 from their initial values in the solution fed to the columns. The broken and dotted lines represent the relationships expected for isotopic enrichment factors of nitrogen (15ε) and oxygen (18ε) of −5, −10, −15, and −20 ‰.
Figure 4. Relationships between Δδ15NNO3 and Δδ 18ONO3 at different ambient temperatures in the column experiments. Δδ15NNO3 and Δδ18ONO3 are, respectively, the changes in δ15NNO3 and δ18O NO3 from their initial values in the solution fed to the columns. The broken and dotted lines represent the relationships expected for enrichment factor ratio 18ε/15ε of 0.6, 0.8, 1.0, and 1.2.
Figure 5. Relationships between the denitrification rate constant k1 and (a) isotopic enrichment factors for nitrogen (15ε) and oxygen (18ε) and (b) the ratio 18ε/15ε in the column experiments.
4. Discussion
The 15ε and 18ε values obtained in this study were in the middle range of the values reported in the literature. Their dependence on denitrification rates as revealed by the column experiments at different ambient temperatures suggests the reasons why a wide range of 18ε/15ε values have been reported in the literature. The reported 15ε values ranged from −4.7 to −30‰ in groundwater systems (Vogel et al. Citation1981; Mariotti et al. Citation1988; Böttcher et al. Citation1990; Mengis et al. Citation1999; Fukada et al. Citation2003; Wexler et al. Citation2014; Ji et al. Citation2017), from −11.65 to −34.2‰ in incubated soils and sediments (Blackmer and Bremner Citation1977; Mariotti et al. Citation1981; Grischek et al. Citation1998; Carrey et al. Citation2013; Vidal-Gavilan et al. Citation2013; Kessler et al. Citation2014), and from −4.7 to −39.8 ± 4.8‰ in pure microbe incubations (Barford et al. Citation1999; Granger et al. Citation2008; Frey et al. Citation2014; Hosono et al. Citation2015; Treibergs and Granger Citation2017).
Mariotti et al. (Citation1988) argued that during denitrification, a larger fractionation (i.e., more negative 15ε) is expected for a smaller denitrification rate. In the present study, where the first-order rate constant of denitrification k1 ranged from 0.013 to 0.083, 15ε values were in a narrow range of −11.8 to −14.9‰, and relatively insensitive to the denitrification rates. We note that the variation of 15ε values in the present study was smaller than those reported by Mariotti et al. (Citation1988) for smaller denitrification rates with comparable values of k1. The narrow range of 15ε values in the present study could be partly due to suppression of NH4+ oxidation by the addition of the nitrification inhibitor AM, which should minimize confounding effects of NO3− replenished from mineralized soil N having various δ15N values different from that in the incoming NO3− solution (≈−2.9‰).
When early studies suffering from possible uncertainty of δ18ONO3 measurement were excluded, 18ε values reported in the literature range from −4.8 ± 0.1 to −31.8 ± 4.1‰ in pure microbe incubations (Granger et al. Citation2008; Frey et al. Citation2014; Hosono et al. Citation2015; Treibergs and Granger Citation2017). The 18ε values in the present study were in a range of −8.4 to −15.9‰, and in close agreement with the values of −8.9 to −15.1‰ in incubated sediments reported by Carrey et al. (Citation2013), Vidal-Gavilan et al. (Citation2013) and Kessler et al. (Citation2014). The consequent 18ε/15ε values in this study, ranging from 0.70 to 1.17 (), were larger than the values of 0.50–0.76 reported for groundwater and soilwater systems (Lohse et al. Citation2013; Wexler et al. Citation2014; Ji et al. Citation2017), and closer to the values of 0.68–0.88 observed in sediment incubations (Carrey et al. Citation2013; Vidal-Gavilan et al. Citation2013; Kessler et al. Citation2014), and 0.57–1.02 reported for a pure microbe incubation (Granger et al. Citation2008).
A plausible explanation for the variations in 18ε/15ε values under different conditions, including different temperatures in this study, is that in systems with a low denitrification rate, other processes that could decrease δ18ONO3 were operating concurrently with denitrification. Osaka et al. (Citation2010) suggested that if some of NO3− present in the system was derived from re-oxidation of NO2− produced by denitrifying bacteria, the observed Δδ18ONO3/Δδ15NNO3 would be smaller than if denitrification was the only process occurring. This is because bacterial oxidation of NO2− to NO3− involves the uptake of an additional oxygen atom from water (DiSpirito and Hooper Citation1986), which often has lower δ18ONO3 value than the original NO3− and could result in a smaller apparent fractionation during the whole process. Conducting anoxic sediment incubation experiments with nitrate-reduce microorganisms using 18O-enriched water, Wunderlich et al. (Citation2013) found that up to 5.7% of the oxygen atoms in residual dissolved NO3− was exchanged by oxygen atom from ambient water, showing simultaneous occurrence of NO2− re-oxidation and denitrification. In reviewing nitrogen and oxygen isotopic studies of marine nitrogen cycles, Casciotti (Citation2016) and concluded that simultaneous occurrence of NO2− re-oxidation and denitrification can either increase or decrease δ18ONO3 values, relative to those in the absence of NO2− re-oxidation, depending on the relative δ18O values of NO2− and NO3−. In the present study, the nitrification inhibitor AM interferes with the oxidation of NH4+ to NO2−, but not the oxidation of NO2− to NO3−. It is plausible that this allowed simultaneous occurrence of reduction of NO3− to NO2− and re-oxidation of NO2− to NO3−.
Granger and Wankel (Citation2016) conducted numerical modeling studies to explore the influence of the δ18O value of water (δ18OH2O) and relative rates of NO2− re-oxidation and NO3− reduction on Δδ18ONO3/Δδ15NNO3 values during denitrification. They reported that with high rates of NO2− re-oxidation relative to NO3− reduction together with high δ18OH2O values typical of seawater, Δδ18ONO3/Δδ15NNO3 values were higher than unity expected for denitrification in the absence of NO2− re-oxidation. In contrast, with lower NO2− re-oxidation rates and lower δ18OH2O values typical of terrestrial freshwater systems, Δδ18ONO3/Δδ15NNO3 values were lower than unity. In marine sediment incubation, Dähnke and Thamdrup (Citation2016) found Δδ18ONO3/Δδ15NNO3 values smaller than unity. The degree of deviation of Δδ18ONO3/Δδ15NNO3 from unity was more pronounced in sediments in which the ratio of NO2− pool to the total of NO2− and NO3− pools was larger, indicating the influence of NO2− re-oxidation on the observed Δδ15NNO3/Δδ18ONO3. In the present study, δ18OH2O value of the solution in column experiments was estimate to be within a range of −7 to −10‰, values reported for freshwater in the region where the experiments were conducted (Mizota and Kusakabe Citation1994). For δ18OH2O values within this range, Granger and Wankel (Citation2016) showed the possibility that Δδ18ONO3/Δδ15NNO3 lower than unity can be expected from the re-oxidation of NO2− produced by denitrifying bacteria.
A slower denitrification coupled with a slower decomposition of substrates in the columns should be accompanied by less vigorous consumption of dissolved O2 in the incoming solution, leaving more time for the re-oxidation of NO2− to NO3−. Although the accumulation of NO2− was not detected in the column experiment, this could be due to immediate re-oxidation of NO2−. A smaller Δδ18ONO3/Δδ15NNO3 (and 18ε/15ε) is thus expected with a decrease of the denitrification rate.
Concurrent reduction of NO3− to NO2− and re-oxidation of NO2− to NO3− may also explain why larger 18ε/15ε values have been reported in laboratory experiments as compared with those found in the fields. Denitrification rates in laboratory experiments are often much larger than those observed in field groundwater systems. This was the case in our column experiments, where the denitrification rates were in the range of 0.28–1.15 mg N kg−1 h−1 (with the first-order rate constant k1 of 0.012–0.078). The 18ε/15ε values of 0.70 to 1.17 in the present study, larger than those observed in groundwater systems, were likely due to higher denitrification rates relative to re-oxidation of NO2− to NO3−. As discussed above, the dependence of 18ε/15ε on the denitrification rates was likely the result of smaller apparent fractionation of oxygen when denitrification and re-oxidation of NO2− were occurring simultaneously. Oxidation of NH4+ to NO2− by ammonium oxidizing bacteria occurring in field groundwater could also contribute to lowering the apparent δ18ONO3 values, while it also affects δ15NNO3 values and could have confounding effects on observed Δδ18ONO3/Δδ15NNO3.
Alternatively, different denitrifying bacteria could be responsible for the different 18ε/15ε values. Granger et al. (Citation2008) observed different 18ε/15ε values for denitrification by different denitrifying bacteria, and hypothesized that 18ε/15ε depends on the type of nitrate reductase of individual strains. Treibergs and Granger (Citation2017) determined enzymatic N and O isotope effects during NO3− reduction in vivo, and reported 18ε/15ε of 0.57 for Nap isotope effects and 18ε/15ε of ≈ 1 for Nar and eukNR. This may explain the apparent discrepancies of 18ε/15ε values among different studies, but the explanation is not applicable to our column experiments where the same soil was used.
From the results of our column experiments together with the discussion above, we conclude that the 18ε/15ε value itself is close to unity during denitrification. Lower 18ε/15ε values reported in earlier studies as well as those observed at low ambient temperatures in the current study were likely due to concurrent reactions including re-oxidation of NO2− to NO3−, which lowered observed 18ε values. We expect high 18ε/15ε values when denitrification rates are large enough to negate the influence of other reactions on the isotope ratios as well as in the systems with a negligible supply of O2. Linear relationships between δ18ONO3 and δ15NNO3 frequently observed in the fields are a strong evidence of denitrification, but the Δδ18ONO3/Δδ15NNO3 ratio should depend on the ambient conditions which exert influences on the observed 18ε and 15ε values. The apparent 18ε/15ε values are thus site-specific. In a system where mixing effects on δ15NNO3 from multiple NO3− sources are negligible, we suggest the use of 15ε for estimating denitrification because 15ε is much less sensitive to denitrification rates than 18ε.
Acknowledgments
We thank Drs. Satoshi Ohno and Tetsuo Sekiguchi of the Central Region Agricultural Research Center, who kindly provided the soil samples used in this study, and Mrs. Hiromi Gouhara and Mrs. Emiko Sakurai for their assistance with the chemical analysis. We also acknowledge the support and suggestions provided by the members of the Institute for Agro-Environmental Sciences, National Agriculture and Food Research Organization.
References
- Aravena R, Robertson WD 1998: Use of multiple isotope tracers to evaluate denitrification in ground water: study of nitrate from a large-flux septic system plume. Ground Water, 36, 975–982. doi:10.1111/j.1745-6584.1998.tb02104.x
- Barford CC, Montoya JP, Altabet MA, Mitchell R 1999: Steady-state nitrogen isotope effects of N2 and N2O production in Paracoccus denitrificans. Appl. Environ. Microbiol., 65, 989–994.
- Blackmer AM, Bremner JM 1977: Nitrogen isotope discrimination in denitrification of nitrate in soils. Soil Biol. Biochem., 9, 73–77. doi:10.1016/0038-0717(77)90040-2
- Böttcher J, Strebel O, Voerkelius S, Schmidt H-L 1990: Using isotope fractionation of nitrate-nitrogen and nitrate-oxygen for evaluation of microbial denitrification in a sandy aquifer. J. Hydrol., 114, 413–424. doi:10.1016/0022-1694(90)90068-9
- Campbell DH, Kendall C, Chang CCY, Silva SR, Tonnessen KA 2002: Pathways for nitrate release from an alpine watershed: determination using δ15N and δ18O. Water Resour. Res., 38, 10–19. doi:10.1029/2001WR000294
- Carrey R, Otero N, Soler A, Gomez-Alday JJ, Ayora C 2013: The role of Lower Cretaceous sediments in groundwater nitrate attenuation in central Spain: column experiments. Appl. Geochem., 32, 142–152. doi:10.1016/j.apgeochem.2012.10.009
- Carrey R, Rodriguez-Escales P, Otero N, Ayora C, Soler A, Gomez-Alday JJ 2014: Nitrate attenuation potential of hypersaline lake sediments in central Spain: flow-through and batch experiments. J. Contam. Hydrol., 164, 323–337. doi:10.1016/j.jconhyd.2014.06.017
- Casciotti KL 2016: Nitrogen and oxygen isotopic studies of the marine nitrogen cycle. Annu. Rev. Mar. Sci., 8, 379–407. doi:10.1146/annurev-marine-010213-135052
- Casciotti KL, Sigman DM, Hastings MG, Böhlke JK, Hilkert A 2002: Measurement of the oxygen isotopic composition of nitrate in seawater and freshwater using the denitrifier method. Anal. Chem., 74, 4905–4912. doi:10.1021/ac020113w
- Dähnke K, Thamdrup B 2016: Isotope fractionation and isotope decoupling during anammox and denitrification in marine sediments. Limnol. Oceanogr., 61, 610–624. doi:10.1002/lno.10237
- DiSpirito AA, Hooper AB 1986: Oxygen exchange between nitrate molecules during nitrite oxidation by Nitrobacter. J. Biol. Chem., 261, 10534–10537.
- Frey C, Hietanen S, Jürgens K, Labrenz M, Voss M 2014: N and O isotope fractionation in nitrate during chemolithoautotrophic denitrification by Sulfurimonas gotlandica. Environ. Sci. Technol., 48, 13229–13237. doi:10.1021/es503456g
- Fukada T, Hiscock KM, Dennis PF, Grischek T 2003: A dual isotope approach to identify denitrification in groundwater at a river-bank infiltration site. Water Res., 37, 3070–3078. doi:10.1016/S0043-1354(03)00176-3
- Galloway JN, Dentener FJ, Capone DG et al. 2004: Nitrogen cycles: past, present, and future. Biogeochemistry, 70, 153–226. doi:10.1007/s10533-004-0370-0
- Galloway JN, Townsend AR, Erisman JW, Bekunda M, Cai Z, Freney JR, Martinelli LA, Seitzinger SP, Sutton MA 2008: Transformation of the nitrogen cycle: recent trends, questions, and potential solutions. Science, 320, 889–892. doi:10.1126/science.1136674
- Granger J, Sigman DM, Lehmann MF, Tortell PD 2008: Nitrogen and oxygen isotope fractionation during dissimilatory nitrate reduction by denitrifying bacteria. Limnol. Oceanogr., 53, 2533–2545. doi:10.4319/lo.2008.53.6.2533
- Granger J, Wankel SD 2016: Isotopic overprinting of nitrification on denitrification as a ubiquitous and unifying feature of environmental nitrogen cycling. Proc. Natl. Acad. Sci. USA, 113, 6391–6400. doi:10.1073/pnas.1601383113
- Grischek T, Hiscock KM, Metschies T, Dennis PF, Nestler W 1998: Factors affecting denitrification during infiltration of river water into a sand and gravel aquifer in Saxony, Germany. Water Res., 32, 450–460. doi:10.1016/S0043-1354(97)00208-X
- Hosono T, Alvarez K, Lin IT, Shimada J 2015: Nitrogen, carbon, and sulfur isotopic change during heterotrophic (Pseudomonas aureofaciens) and autotrophic (Thiobacillus denitrificans) denitrification reactions. J. Contam. Hydrol., 183, 72–81. doi:10.1016/j.jconhyd.2015.10.009
- Ji X, Xie R, Hao Y, Lu J 2017: Quantitative identification of nitrate pollution sources and uncertainty analysis based on dual isotope approach in an agricultural watershed. Environ. Pollut., 229, 586-–594. doi:10.1016/j.envpol.2017.06.100
- Kendall C, Elliott EM, Wankel SD 2007: Tracing anthropogenic inputs of nitrogen to ecosystems. In Stable Isotopes in Ecology and Environmental Science, ed. Michener R, Lajtha K, pp. 375–449. Blackwell Publishing, Oxford.
- Kessler AJ, Bristow LA, Cardenas MB, Glud RN, Thamdrup B, Cook PLM 2014: The isotope effect of denitrification in permeable sediments. Geochim. Cosmochim. Acta., 133, 156–167. doi:10.1016/j.gca.2014.02.029
- Lehmann MF, Reichert P, Bernasconi SM, Barbieri A, McKenzie JA 2003: Modelling nitrogen and oxygen isotope fractionation during denitrification in a lacustrine redox-transition zone. Geochim. Cosmochim. Acta., 67, 2529–2542. doi:10.1016/S0016-7037(03)00085-1
- Lohse KA, Sanderman J, Amundson R 2013: Identifying sources and processes influencing nitrogen export to a small stream using dual isotopes of nitrate. Water Resour. Res., 49, 5715–5731. doi:10.1002/wrcr.20439
- Mariotti A, Landreau A, Simon B 1988: 15N isotope biogeochemistry and natural denitrification process in groundwater—application to the chalk aquifer of northern France. Geochim. Cosmochim. Acta., 52, 1869–1878. doi:10.1016/0016-7037(88)90010-5
- Mariotti AJ, Germon JC, Hubert P, Kaiser P, Letolle R, Tardieux A, Tardieux P 1981: Experimental denitrification of nitrogen kinetic isotope fractionation: some principles: illustration for the denitrification and nitrification processes. Plant Soil, 62, 413–430. doi:10.1007/BF02374138
- Mengis M, Schiff SL, Harris M, English MC, Aravena R, Elgood RJ, MacLean A 1999: Multiple geochemical and isotopic approaches for assessing ground water NO3− elimination in riparian zone. Ground Water, 37, 448–457. doi:10.1111/j.1745-6584.1999.tb01124.x
- Mizota C, Kusakabe M 1994: Spatial distribution of δD-δ18O values of surface and shallow groundwaters from Japan, south Korea and east China. Geochem. J., 28, 387–410. doi:10.2343/geochemj.28.387
- Ohte N, Sebestyen SD, Shanley JB, Doctor DH, Kendall C, Wankel SD, Boyer EW 2004: Tracing sources of nitrate in snowmelt runoff using a high-resolution isotopic technique. Geophys. Res. Lett., 31, L21506. doi:10.1029/2004GL020908
- Osaka K, Ohte N, Koba K, Yoshimizu C, Katsuyama M, Tani M, Tayasu I, Nagata T 2010: Hydrological influences on spatiotemporal variations of δ15N and δ18O of nitrate in a forested headwater catchment in central Japan: denitrification plays a critical role in groundwater. J. Geophys. Res., 115, G02021. doi:10.1029/2009JG000977
- Panno SV, Hackley KC, Hwang HH 2006: Isotopic evidence of nitrate sources and denitrification in the Mississippi River, Illinois. J. Environ. Qual., 35, 495–504. doi:10.2134/jeq2005.0012
- Prasad R, Rajale GB, Lakhdive BA 1971: Nitrification retarders and slow-release nitrogen fertilizers. Adv. Agron., 23, 337–383. doi:10.1016/S0065-2113(08)60156-X
- Revesz K, BöHlke JK 2002: Comparison of δ18O measurements in nitrate by different combustion techniques. Anal. Chem., 74, 5410–5413. doi:10.1021/ac025854b
- Sigman DM, Casciotti KL, Andreani M, Barford C, Galanter M, Böhlke JK 2001: A bacterial method for the nitrogen isotopic analysis of nitrate in seawater and freshwater. Anal. Chem., 73, 4145–4153. doi:10.1021/ac010088e
- Smedt FD, Wierenga PJ 1979: A generalized solution for solute flow in soils with mobile and immobile water. Water Resour. Res., 15, 1137–1141. doi:10.1029/WR015i005p01137
- Soil Survey Staff 1992: Keys to Soil Taxonomy, 5th. SMSS Technical Monograph No. 19. Pocahontas Press, Blacksburg, Virginia.
- Stoddard JL 1994: Long-term changes in watershed retention of nitrogen, its causes and aquatic consequences, In Environmental Chemistry of Lake and Reservoirs, ed. Baker LA. pp. 223–284, Am. Chem. Soc., Washington, DC.
- Treibergs LA, Granger J 2017: Enzyme level N and O isotope effects of assimilatory and dissimilatory nitrate reduction. Limnol. Oceanogr., 62, 272–288. doi:10.1002/lno.10393
- Vidal-Gavilan G, Folch A, Otero N, Solanas AM, Soler A 2013: Isotope characterization of an in situ biodenitrification pilot-test in a fractured aquifer. Appl. Geochem., 32, 153–163. doi:10.1016/j.apgeochem.2012.10.033
- Vitousek PM, Howarth RW 1991: Nitrogen limitation on land and in the sea: how can it occur? Biogeochemistry, 13, 87–113. doi:10.1007/BF00002772
- Vogel JC, Talma AS 1981: Gaseous nitrogen as evidence for denitrification in groundwater. J. Hydrol., 50, 191–200. doi:10.1016/0022-1694(81)90069-X
- Wexler SK, Goodale CL, McGuire KJ, Bailey SW, Groffman PM 2014: Isotopic signals of summer denitrification in a northern hardwood forested catchment. Proc. Natl. Acad. Sci. USA, 111, 16413–16418. doi:10.1073/pnas.1404321111
- Wunderlich R, Mechenstock U, Einsiedl F 2013: A mixture of nitrite-oxidizing and denitrifying microorganisms affects the δ18O of dissolved nitrate during anaerobic microbial denitrification depending on the δ18O of ambient water. Geochim. Cosmochim. Acta., 119, 31–45. doi:10.1016/j.gca.2013.05.028