
ABSTRACT
Objective: This study aimed to evaluate the pleiotropic effects of boron stress on beet (Beta vulgaris L.) growth.
Methods: Beet seedlings were treated with varying concentrations of H3BO3 (0.05, 0.5, 2, and 30 mg/L) for 30 d for evaluation of diverse morphological parameters related to shoot and root growth. Transverse sections of beet leaves were observed under a microscope, and the leaf thickness was measured. Photosynthesis in beet was evaluated by measuring the photosynthetic rate, intercellular carbon dioxide concentration, and chlorophyll content; chloroplast morphology was observed by transmission electron microscopy. In addition, the levels of diverse endogenous hormones, as well as oxidative stress parameters, were also analyzed in beet leaves.
Results: We found that boron accumulated in different beet tissues but was observed mainly in mature leaves, followed by young leaves, mature petioles, young petioles, and roots. Boron stress (boron toxicity, 30 mg/L; boron deficiency, 0.05 mg/L) significantly inhibited beet shoot, root growth, and leaf expansion while promoting leaf thickening. Additionally, the levels of indole-3-acetic acid, gibberellin A3, and zeatin in beet leaves decreased significantly under boron stress, whereas the level of abscisic acid increased. Moreover, the levels of superoxide dismutase, peroxidase, catalase, malondialdehyde, and proline in beet leaves increased significantly under boron stress.
Conclusion: Together, our results indicate that boron stress significantly inhibited normal beet growth via the influence of endogenous hormone levels and oxidative stress responses.
1. Introduction
Boron (B) is an essential micronutrient required for the normal growth and development of higher plants (Zhou et al. Citation2017; Riaz et al. Citation2018a). Boron is the only element among the diverse and necessary micronutrients that is taken up by plants as an uncharged molecule, but not as an ion (Ahmad et al. Citation2012). Since B availability is inadequate in a large tract of land worldwide, B deficiency is a global agricultural concern (Eggert and Von Wirén Citation2017). In plants, B is involved mainly in carbohydrate metabolism and cell division (Gupta and Solanki Citation2013), and B deficiency can result in a series of phenotypic and physiological changes in plants (Riaz et al. Citation2018b). For example, B deficiency reduces plant dry mass, root number, root length, root surface area, and leaf area expansion in citrus rootstocks (Mei et al. Citation2011). Boron deficiency also decreases the leaf net photosynthetic rate (Pn), plant height, leaf area, fruiting sites, and dry matter accumulation, and increases fruit abscission in cotton (Zhao et al. Citation2003). Furthermore, B deficiency inhibits root cell elongation in Arabidopsis thaliana seedlings by regulating ethylene, auxin, and the levels of reactive oxygen species (ROS) (Camacho et al. Citation2015). Consequently, B deficiency contributes to considerable yield reductions in crops as diverse as cotton, rice, maize, wheat, soybean, groundnut, and citrus (Ahmad et al. Citation2012), making B fertilizer application necessary to improve crop yields, especially in B-deficient soils.
Many agricultural fields contain naturally high B concentrations, especially in arid and semi-arid regions (Nasim et al. Citation2015); overapplication of B fertilizers, as well as deposition of mining wastes, fly ash, and industrial chemicals also contribute to excessive B in the soil (Kato et al. Citation2009; Yau and Ryan Citation2008). Like B deficiency, B toxicity may also influence the quality and yield of plants. It has been reported that, under B toxicity, Citrus grandis exhibits reduced chlorophyll levels, inhibition of photosynthesis, irregular cell wall thickening in leaf cortex cells, and accelerated the death of phloem and root epidermal cells (Huang et al. Citation2014). Boron toxicity also inhibits the accumulation of shoot dry matter in soybean and increases the levels of superoxide dismutase (SOD), catalase (CAT), and ascorbate peroxidase (APX) (Hamurcu et al. Citation2013). Additionally, B toxicity was reported to significantly decrease leaf biomass, relative leaf growth rate, organic N and soluble protein levels, and nitrate reductase, and nitrite reductase activities in tomato leaves (Cervilla et al. Citation2010). Together, these results indicate that an appropriate B concentration in the soil is necessary for normal plant growth and development.
Sugar beet (Beta vulgaris L.) is one of the most important sucrose-producing crops and the second most prevalent sugar crop in China (Geng and Yang Citation2015). Foliar B application has been shown to increase root yield and sucrose concentration, as well as improve the seed yield and quality of sugar beet (Dordas et al. Citation2007; Armin and Asgharipour Citation2011). However, related studies on the specific roles of B stress on beet growth are still limited. In this study, beet seedlings were treated with varying concentrations of H3BO3 (0.05, 0.5, 2, and 30 mg/L) for 30 d. Morphology, photosynthesis, levels of endogenous hormones, oxidative stress response, and B accumulation were all evaluated in beet under B stress. Our findings reveal the pleiotropic inhibitory effects of both B deficiency and toxicity on beet growth that may be helpful for agricultural production.
2. Materials and methods
2.1. Plant materials and B treatments
Seeds of sugar beet Beta vulgaris ‘HI0099’ were purchased from Syngenta (Basel, Switzerland). Sterilized beet seeds (0.2% sodium hypochlorite) were planted in vermiculite until germination (fully stretched cotyledons). The germinated seeds were then moved into plastic containers containing a half-strength nutrient solution. When the cotyledons were fully stretched, the seedlings were moved into full-strength nutrient solution (236 g/L Ca(NO3)2 · 4H2O, 102 g/L KNO3, 98 g/L MgSO4 · 7H2O, 27 g/L KH2PO4, 7.45 g/L Na2-EDTA, 5.57 g/L FeSO4 · 7H2O, 0.079 g/L CuSO4 · 5H2O, 0.088 g/L (NH4)6MO7O24, 1.81 g/L MnCL2 · 4H2O, and 0.22 g/L ZnSO4 · 7H2O, pH 6.5) containing varying concentrations of H3BO3 (T1, 0.05 mg/L; T2, 0.5 mg/L; T3, 2 mg/L; T4, 30 mg/L). The nutrient solution was renewed every 5 d. After 30 d of B treatment, beet plants of different groups were assayed. All the plants were cultured in a greenhouse at the Key Laboratory of Sugar Beet Genetic Breeding of Heilongjiang Province (Harbin, Heilongjiang, China) under a 12-h light/12-h dark cycle, 26°C day/18°C night temperature, and 40–60% relative humidity.
2.2. Detection of morphological parameters
Plant height, petiole length, and root diameter (the widest section) were measured using a Vernier caliper. The petiole number was counted directly under naked eyes. The root volume was measured according to the drainage method (Zhao et al. Citation2013). Shoots and roots were dried at 105°C for 10 min and then at 70°C until constant weight, after which the dry weight was measured using an electronic analytical balance. The leaf area (the latest fully stretched leaf) was measured using an image analysis system (LA-S, Wanshen, Shenzhen, China). Root vitality was measured according to the α-naphthyl amine method (Tachibana and Nakayama Citation2009).
2.3. Microscopy
Transverse sections of beet leaves in different groups were observed under a microscope. Briefly, fresh leaves (the latest fully stretched leaves) in the widest section were cut into 1-cm pieces and fixed in FAA solution (5% formalin, 5% acetic acid, 45% ethyl alcohol, and 45% distilled water) for 24 h. The samples were then dehydrated with graded ethanol (50%, 70%, 85%, 95%, and 100%), vitrificated in xylene, embedded in paraffin, and sliced into 400-µm transverse sections. The sample sections were subsequently dewaxed with xylene, rehydrated with graded ethanol (100%, 95%, 85%, 70%, and 50%), and stained with safranin and fast green. Stained samples were observed under a microscope (BH-2, Olympus, Japan), and the leaf thickness was measured using an image analysis system (LA-S).
2.4. Photosynthesis assay
Photosynthesis in beet was evaluated in the different groups by measuring the Pn, intercellular CO2 concentration (Ci), and chlorophyll content. The latest fully stretched leaves were used for assays. Pn and Ci were detected using the LI-6400 portable photosynthetic system (Li-Cor, Lincoln, NE, USA) under a 1500 µmol∙m−2 s−1 photon flux density. Following extraction in 80% acetone in the dark overnight, the optical density (OD) was detected at 663 and 645 nm using a spectrophotometer (U4100, Hitachi, Tokyo, Japan). The chlorophyll content was calculated as 8.02(OD663) + 20.2(OD645) × V/(W × 1000), where V and W represent extract volume and sample weight, respectively (Arnon Citation1949).
2.5. Transmission electron microscopy (TEM)
Chloroplast morphology was observed in beet leaves of different groups by TEM. Briefly, fresh leaves (the latest fully stretched leaves) in the widest section were cut into pieces (1 mm × 5 mm) and fixed in 2.5% glutaraldehyde for 48 h. The samples were then fixed in 2% osmic acid for 2 h, dehydrated with graded ethanol (50%, 70%, 85%, 95%, and 100%), embedded in epoxy resin (Epon 812), and cut into 50-nm sections using an ultramicrotome (LKB, Uppsala, Sweden). Following staining with uranyl acetate and lead citrate, chloroplast morphology was observed under a transmission electron microscope (H-7650, Hitachi).
2.6. Endogenous hormone assay
Endogenous hormones, including indole-3-acetic acid (IAA), zeatin (ZT), gibberellin A3 (GA3), and abscisic acid (ABA), were detected in beet leaves (the latest fully stretched leaf) of different groups by high-performance liquid chromatography (HPLC). HPLC was performed on an HPLC system (1200, Agilent, CA, USA) using a C18 column (XDB-C18, Agilent). The detection wavelength for IAA, GA3, and ABA was 210 nm, and the mobile phase was methanol, acetonitrile, and citrate buffer solution (pH 3.0) (20:20:60). The detection wavelength of ZT was 254 nm, and the mobile phase was methanol, acetonitrile, and phosphate buffer (pH 7.0) (15:15:70).
2.7. Oxidative stress assay
Oxidative stress-related parameters, including SOD, CAT, peroxidase (POD), malondialdehyde (MDA), and proline levels, were evaluated in beet leaves (the latest fully stretched leaf) of different groups. Detection of SOD, POD, CAT, MDA, and proline was performed using the nitroblue tetrazolium photochemical reduction, guaiacol, ultraviolet absorption, thiobarbituric acid, and sulfosalicylic acid methods, respectively (Ding et al. Citation2014).
2.8. Boron accumulation assay
Boron accumulation was analyzed in different beet tissues, including the mature leaf, young leaf, mature petiole, young petiole, and root. Briefly, 0.5 g dry samples were digested with 15 mL nitric and 5 mL perchloric acids (volume ratio 3:1, pH 6.8–7.0) for 3 h, and diluted to 100 mL with ultrapure water (pH 6.8–7.0). Then, 4 mL solution samples were mixed with 4 mL ammonium acetate and 2 mL azomethine (volume ratio 2:2:1) for 1 h under darkness. The OD420 was detected using a spectrophotometer (U4100), and the B concentration was calculated according to a standard curve (established using standard boric acid).
2.9. Statistical analyses
All data are expressed as means ± standard deviation (SD). Statistical analysis was performed with SPSS version 17.0 (SPSS Inc., Chicago, IL, USA). Comparison between different groups was determined by one-way ANOVA. A p-value less than 0.05 was considered to be significantly different.
3. Results
3.1. Boron stress inhibited beet growth
The effects of different concentrations of B on beet growth were analyzed. As shown in , plant height, petiole length, petiole number, shoot dry weight, root dry weight, root volume, root diameter, and root vitality were all significantly increased in a dose-dependent manner with increasing concentrations of B, attaining the highest levels at 2 mg/L (T3) (p < 0.05). Plant height, petiole length, petiole number, shoot dry weight, and root vitality were significantly higher in beet under B toxicity (T4, 30 mg/L) than under B deficiency (T1, 0.05 mg/L) (p < 0.05); however, the root dry weight, root volume, and root diameter were significantly lower in beet under B toxicity (T4, 30 mg/L) than under B deficiency (T1, 0.05 mg/L) (p < 0.05) (, Fig. S1).
Table 1. The morphological parameters of beet under the treatment of different concentrations of boron (N = 10, from independent plants)
3.2. Boron stress inhibited leaf expansion and promoted leaf thickening
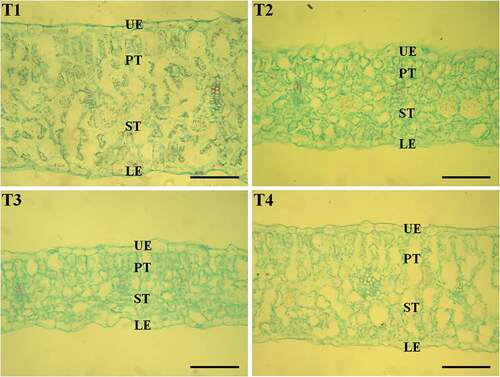
The effects of different B concentrations on leaf growth in beet were analyzed. As shown in , the leaf area increased significantly in a dose-dependent manner with increasing B concentrations, reaching a peak at 2 mg/L (T3) (p < 0.05). The beet exhibited smaller leaf area under B toxicity (T4, 30 mg/L) than under 0.5 and 2 mg/L boron treatment (T2 and T3) (p < 0.05). In addition, B deficiency (T1, 0.05 mg/L) and B toxicity (T4, 30 mg/L) in beet resulted in significantly increased leaf thickness compared to B treatments at 0.5 and 2 mg/L (T2 and T3) (p < 0.05). The palisade tissue (PT) and spongy tissue (ST) thickness were significantly reduced in a dose-dependent manner with increasing B concentrations, reaching the lowest levels at 2 mg/L (T3) (p < 0.05). The beet exhibited significantly thicker PT and ST under B toxicity (T4, 30 mg/L) than under 2 mg/L boron treatment (T3) (p < 0.05). However, upper epidermis (UE) and lower epidermis (LE) thickness decreased continuously with increasing B concentrations (p < 0.05) ( and ).
Table 2. The thickness of beet leaves under the treatment of different concentrations of boron (N = 10, from independent plants)
Figure 1. Microscopic observation of the transverse section of leaves (×400, bar = 100 µm). Beet plants were treated with different concentrations of Boron (T1, 0.05 mg/L; T2, 0.5 mg/L; T3, 2 mg/L; T4, 30 mg/L) for 30 days. The representative images are shown (N = 10, from independent plants). UE, upper epidermis; PT, palisade tissue; ST, spongy tissue; LE, lower epidermis
3.3. Boron stress inhibited photosynthesis in beet
Beet photosynthesis was analyzed under different B concentrations. As shown in , the Pn increased significantly in a dose-dependent manner with increasing B concentrations, peaking at 2 mg/L (T3) (p < 0.05); in contrast, Ci presented a significant decrease. The beet exhibited significantly lower Pn and higher Ci under B toxicity (T4, 30 mg/L) than under B treatments at 0.5 and 2 mg/L (T2 and T3) (p < 0.05). The chlorophyll content in the beet leaves exhibited a trend consistent with the Pn (). The chloroplasts in the beet leaves were observed by TEM. Chloroplast number and size both increased significantly in a dose-dependent manner with increasing B concentrations, peaking at 2 mg/L boron treatment (T3) (p < 0.05). The beet exhibited significantly lower chloroplast number and size under B toxicity (T4, 30 mg/L) than under treatments at 0.5 and 2 mg/L boron (T2 and T3) (p < 0.05) ( and ).
Table 3. The photosynthesis parameters in beet leaves under the treatment of different concentrations of boron (N = 5, from independent plants)
Figure 2. Microscopic observation of chloroplasts in beet leaves by transmission electron microscope (× 4000, bar = 10 µm). Beet plants were treated with different concentrations of Boron (T1, 0.05 mg/L; T2, 0.5 mg/L; T3, 2 mg/L; T4, 30 mg/L) for 30 days. The representative images are shown (N = 5, from independent plants). For analysis of chloroplasts, five images from five independent plants were used (five cells for each image)
3.4. Boron stress influenced endogenous hormone levels in beet leaves
Since B stress significantly inhibited leaf expansion, the levels of endogenous hormones were evaluated in beet leaves of different groups. As shown in , the levels of IAA, GA3, and ZT increased significantly in a dose-dependent manner with increasing B concentrations, peaking at 2 mg/L (T3) (p < 0.05). The beet exhibited significantly lower levels of IAA, GA3, and ZT under B toxicity (T4, 30 mg/L) than under treatments at 0.5 and 2 mg/L (T2 and T3) (p < 0.05). Meanwhile, the lowest ABA level was recorded in beet treated with 2 mg/L boron (T3) (p < 0.05). Both B deficiency (T1, 0.05 mg/L) and B toxicity (T4, 30 mg/L) significantly increased the ABA level compared to 0.5 and 2 mg/L boron treatments (T2 and T3) (p < 0.05) ().
Table 4. The endogenous hormone parameters in beet leaves under the treatment of different concentrations of boron (N = 5, from independent plants)
3.5. Boron stress activated the oxidative stress response in beet leaves
The response of beet to B stress was analyzed through the measurement of several oxidative stress parameters. As shown in , B deficiency (T1, 0.05 mg/L) and B toxicity (T4, 30 mg/L) both significantly increased SOD, POD, CAT, and MDA levels in beet leaves compared to B treatment at 0.5 and 2 mg/L (T2 and T3) (p < 0.05). No significant differences were found in SOD, POD, CAT, and MDA levels between the 0.5 and 2 mg/L boron treatments (T2 and T3). In addition, MDA and proline levels decreased significantly in a dose-dependent manner with increasing concentrations of B, reaching their lowest levels at 2 mg/L boron treatment (T3) (p < 0.05). Beet MDA and proline content were highest under B toxicity (T4, 30 mg/L) (p < 0.05) ().
Table 5. The oxidative stress parameters in beet leaves under the treatment of different concentrations of boron (N = 5, from independent plants)
3.6. Boron concentration in different beet tissues
Boron concentration in different beet tissues was further analyzed. As shown in , B accumulated mainly in mature leaves, followed by young leaves, mature petioles, young petioles, and roots. Boron concentration in these tissues increased significantly in a dose-dependent manner with increasing B concentrations (p < 0.05). With B treatment at 30 mg/L (T4), B concentration in the roots, young leaves, mature leaves, young petioles, and mature petioles was 87.70, 31.15, 1335.21, 46.03, and 62.62 µg/g, respectively ().
Table 6. Boron concentration in different tissues of beet under the treatment of different concentrations of boron (N = 5, from independent plants)
4. Discussion
Boron is an important non-metal micronutrient required for normal plant growth and development (Gupta and Solanki Citation2013). Globally, there are large tracts of arable land that are deficient in B while others are restricted by B toxicity (Reid Citation2014). Boron deficiency and toxicity can both induce diverse morphological and physiological changes in plants (Shah et al. Citation2017). In this study, we evaluated the effects of B stress on beet growth. We found that B deficiency and toxicity both significantly affected beet growth parameters, including morphology, rate of photosynthesis, endogenous hormone levels, and oxidative stress responses.
Morphology is an important indicator of plant growth status. Reduced shoot and root dry weight under B stress have been observed in diverse species such as cotton (Zhao et al. Citation2003), citrus (Huang et al. Citation2014), and soybean (Hamurcu et al. Citation2013). In this study, we found that B deficiency and toxicity both elicited significantly reduced beet plant height, petiole length, petiole number, shoot and root dry weight, root volume, root diameter, and root vitality. Our findings are consistent with previous studies, and further illustrate that B stress is detrimental to beet growth. In addition, we also found that the inhibitory effects of B deficiency on shoot growth were stronger than those of B toxicity, while the inhibitory effects of B deficiency on root growth were weaker than those of B toxicity. This result may be explained by the higher demand for B in the shoot than in the root, suggesting that the root may be more sensitive to high concentrations of B than the shoot.
We also analyzed beet leaf morphology under B stress in this study and found that the leaf area was significantly decreased with B deficiency and toxicity, whereas leaf thickness was increased. Microscopic observation showed that B deficiency and toxicity significantly increased PT and ST thickness, consistent with previous studies in citrus. It has been reported that, under B deficiency, citrus exhibits thickened leaves, big cell gaps, and increased ST number and volume (Liu et al. Citation2015). Moreover, B toxicity has been shown to increase citrus leaf thickness by increasing the numbers of PT and ST cells (Huang et al. Citation2014). We suspect that the thickened PT and ST may help to enhance beet inner tissue resistance to B stress.
Photosynthesis is vital for dry matter accumulation in plants. Numerous studies have demonstrated that B stress can inhibit photosynthesis in species such as cotton (Zhao et al. Citation2003), citrus (Huang et al. Citation2014), mung bean (Jiao et al. Citation2013), Arabidopsis thaliana (Chen et al. Citation2014), and wheat (Liu et al. Citation2017). Consistent with previous reports, we found that B deficiency and toxicity significantly decreased the Pn and increased the Ci in beet leaves. Since the chloroplast is an organelle specialized for photosynthesis, chlorophyll content and chloroplast micromorphology were also analyzed in this study. We found that B deficiency and toxicity significantly decreased chlorophyll content in beet leaves, as well as chloroplast number and size. The inhibitory effect of B deficiency on chloroplast development may have led directly to the decrease in chlorophyll content. Meanwhile, a previous study showed that high B concentrations result in reduced Fe content in apple leaves (Mouhtaridou et al. Citation2004). Since Fe is an essential element for chlorophyll synthesis, B toxicity may also contribute to the decrease in chlorophyll content by affecting the Fe content.
Endogenous hormones are important regulators of plant growth and development. The levels of both IAA and CK are reportedly reduced in pea plants under B deficiency, as is IAA export from the shoot apex (Wang et al. Citation2006). Significantly reduced levels of IAA, GA3, and indole-3-propionic acid (iPA) are observed in wheat under B deficiency, whereas the levels of ABA concentrations are increased (Yan et al. Citation2003). Consistent with previous studies, we found that, in beet, B deficiency significantly reduced IAA, GA3, and ZT levels, but increased the levels of ABA (Yan et al. Citation2003). Meanwhile, B toxicity elicited an inhibitory effect on endogenous hormone levels similar to that of B deficiency, and the changes in endogenous hormone content are consistent with the morphology of beet under B stress.
The oxidative stress response is an antioxidant defense system used by plants to actively adapt to stressful environments. The specific roles of B stress on the oxidative stress response have been identified in various studies. For example, the activities of antioxidant enzymes like CAT, POX, and SOD increase in response to B stress in Artemisia annua (Aftab et al. Citation2010), and the levels of SOD, CAT, and APX in soybean are increased under B toxicity (Hamurcu et al. Citation2013). Furthermore, the levels of antioxidant enzymes, including SOD, POD, CAT, and APX, decrease under B deficiency, and to some extent also under B toxicity, in citrange orange plants (Shah et al. Citation2017). In agreement with the above findings, we found that B deficiency and toxicity significantly increased SOD, POD, CAT, MDA, and proline content in beet, illustrating the occurrence of oxidative damage in beet under B stress. The observed increases in oxidative stress parameters may contribute to protecting cellular membranes and alleviating oxidative stress, thereby enhancing resistance to B stress.
Boron concentration varied according to plant tissue. In this study, we found that B accumulated mainly in mature leaves, followed by young leaves, mature petioles, young petioles, and roots. Our finding is consistent with a previous study showing that the total B concentration in citrus roots was substantially lower than in citrus leaves under B toxicity (Huang et al. Citation2014). Since B is transported from the root to the petiole, and then to the leaf, B accumulates in the leaves, especially mature leaves. In addition, we also found that B concentration in different beet tissues increased significantly in a dose-dependent manner with increasing B concentrations. Notably, B concentration in mature beet leaves with 30 mg/L boron treatment can reach up to 1335.21 µg/g. Since the safe B intake level for adults is 1–13 mg/d (Nielsen Citation1998), excessive B concentration in beet may be toxic to human health.
In conclusion, B deficiency and toxicity both significantly inhibited dry matter accumulation in beet shoots and roots while promoting leaf thickening. The inhibitory effects of B deficiency and toxicity on beet growth were closely associated with increasing levels of IAA, GA3, and ZT and decreasing levels of ABA. Meanwhile, SOD, POD, CAT, MDA, and proline levels were increased in beet under B stress, which may relieve B stress-induced oxidative damage.
Conflict-of-interest statement
The authors declared that they have no conflicts of interest in this work.
CERTIFICATE_OF_EHGLISH_EDITING.pdf
Download PDF (57.4 KB)Supplementary material
Supplemental data for this article can be accessed here.
Additional information
Funding
Related Research Data
References
- Aftab T, Khan MMA, Idrees M, Naeem M, Ram M 2010: Boron induced oxidative stress, antioxidant defence response and changes in artemisinin content in artemisia annua L. J. Agron. Crop. Sci., 196(6), 423–430. doi:10.1111/jac.2010.196.issue-6
- Ahmad W, Zia MH, Malhi SS, Niaz A 2012: Boron deficiency in soils and crops: a review. Crop Plant. doi:10.5772/36702
- Armin M, Asgharipour MR 2011: Effect of time and concentration of boron foliar application on yield and quality of sugar beet. Asian J. Plant Sci., 10(5), 307. doi:10.3923/ajps.2011.307.311
- Arnon DI 1949: Copper enzymes in isolated chloroplasts. polyphenoloxidase in beta vulgaris. Plant Physiol., 24(1), 1–15. doi:10.1104/pp.24.1.1
- Camacho JJBC, Mart MERN, Herrera ABMGR, Navarro TMG, Rexach SJ, Gonz NAFL 2015: Boron deficiency inhibits root cell elongation via an ethylene/auxin/ROS-dependent pathway in arabidopsis seedlings. J. Exp. Bot., 66(13), 3831. doi:10.1093/jxb/erv186
- Cervilla LM, Blasco B, Ríos JJ, Rosales MA, Rubiowilhelmi MM, Sánchezrodríguez E, Romero L, Ruiz JM 2010: Response of nitrogen metabolism to boron toxicity in tomato plants. Plant Biol., 11(5), 671–677. doi:10.1111/j.1438-8677.2008.00167.x
- Chen M, Mishra S, Heckathorn SA, Frantz JM, Krause C 2014: Proteomic analysis of Arabidopsis thaliana leaves in response to acute boron deficiency and toxicity reveals effects on photosynthesis, carbohydrate metabolism, and protein synthesis. J. Plant Physiol., 171(3–4), 235–242. doi:10.1016/j.jplph.2013.07.008
- Ding GX, Wang BM, Wang XY, Jian-Qing XU, Chen L, Qiao HQ, Guo-Ying C, Niu XY, Fei Wen P 2014: Studies on the changes of proline,MDA content and activity of POD, SOD and CAT in pericarp during huping jujube development. J. Shanxi Agric. Sci., 10, 121–125.
- Dordas C, Apostolides GE, Goundra O 2007: Boron application affects seed yield and seed quality of sugar beets. J. Agric. Sci., 145(4), 377–384. doi:10.1017/S0021859607006879
- Eggert K, Von Wirén N 2017: Response of the plant hormone network to boron deficiency. New Phytol., 216(3), 868–881. doi:10.1111/nph.14731
- Geng G, Yang J 2015: Sugar beet production and industry in China. Sugar Tech., 17(1), 13–21. doi:10.1007/s12355-014-0353-y
- Gupta U, Solanki H 2013: Impact of boron deficiency on plant growth. Int. J. Bioassays. 2(07), 1048–1050.
- Hamurcu M, Sekmen AH, Turkan İ, Gezgin S, Demiral T 2013: Induced anti-oxidant activity in soybean alleviates oxidative stress under moderate boron toxicity. Plant Growth Regul., 70(3), 217–226. doi:10.1007/s10725-013-9793-8
- Huang JH, Cai ZJ, Wen SX, Guo P, Ye X, Lin GZ, Chen LS 2014: Effects of boron toxicity on root and leaf anatomy in two citrus species differing in boron tolerance. Trees, 28(6), 1653–1666. doi:10.1007/s00468-014-1075-1
- Jiao XY, Wang JS, Ai-Lian WU, Zhao RF, Wang LG, Dong EW 2013: Effects of boron deficiency on photosynthesis and carbohydrate contents in leaves of mung bean(Phaseolus aureus Roxb). J. Plant Nutr. Fert., 19(3), 615.
- Kato Y, Kyoko M, Junpei T, Motoko W, Toru F 2009: Highly boron deficiency-tolerant plants generated by enhanced expression of NIP5;1, a boric acid channel. Plant Cell Physiol., 50(1), 58. doi:10.1093/pcp/pcn168
- Liu C, Wenkai L, Qingna M, Chengcang M 2017: Effect of silicon on the alleviation of boron toxicity in wheat growth, boron accumulation, photosynthesis activities, and oxidative responses. J. Plant Nutr., 40(17), 2458–2467. doi:10.1080/01904167.2017.1380817
- Liu LC, Jiang CC, Dong XC, Wen WUX, Liu GD, Pei LUX 2015: Effects of boron deficiency on cellular structures of maturation zone from root tips and functional leaves from middle and upper plant in trifoliate orange rootstock. Scientia Agricultura Sinica, 48, 4957–4964.
- Mei L, Sheng O, Peng SA, Zhou GF, Wei QJ, Li QH 2011: Growth, root morphology and boron uptake by citrus rootstock seedlings differing in boron-deficiency responses. Sci. Hortic., 129(3), 426–432. doi:10.1016/j.scienta.2011.04.012
- Mouhtaridou GN, Sotiropoulos TE, Dimassi KN, Therios IN 2004: Effects of boron on growth, and chlorophyll and mineral contents of shoots of the apple rootstock MM 106 cultured in vitro. Biologia Plantarum, 48(4), 617–619. doi:10.1023/B:BIOP.0000047169.13304.67
- Nasim M, Rengel Z, Tariq Aziz B, Regmi D, Saqib M 2015: Boron toxicity alleviation by zinc application in two barley cultivars differing in tolerance to boron toxicity. Pak. J. Agric. Sci., 52(1), 151–158.
- Nielsen FH 1998: The justification for providing dietary guidance for the nutritional intake of boron. Biol. Trace Elem. Res., 66(1–3), 319. doi:10.1007/BF02783145
- Reid R 2014: Understanding the boron transport network in plants. Plant Soil, 385(1–2), 1–13. doi:10.1007/s11104-014-2149-y
- Riaz M, Yan L, Xiuwen W, Hussain S, Aziz O, Wang Y, Imran M, Jiang C 2018a: Boron alleviates the aluminum toxicity in trifoliate orange by regulating antioxidant defense system and reducing root cell injury. J. Environ. Manage., 208, 149–158. doi:10.1016/j.jenvman.2017.12.008
- Riaz M, Yan L, Xiuwen W, Hussain S, Jiang C 2018b: Boron deprivation induced inhibition of root elongation is provoked by oxidative damage, root injuries and changes in cell wall structure. Environ. Exp. Bot., 156, 74–85. doi:10.1016/j.envexpbot.2018.08.032
- Shah A, Wu X, Ullah A, Fahad S, Muhammad R, Yan L, Jiang C 2017: Deficiency and toxicity of boron: alterations in growth, oxidative damage and uptake by citrange orange plants. Ecotoxicol. Environ. Saf., 145(6), 575–582. doi:10.1016/j.ecoenv.2017.08.003
- Tachibana H, Nakayama A 2009: Examination on determining physiological activities of tea roots by TTC reduction and α-naphthylamine oxidation and its application. Bull. Mie Agric. Tech. Center, 1976, 14–18.
- Wang G, RoMheld V, Li C, Bangerth F 2006: Involvement of auxin and CKs in boron deficiency induced changes in apical dominance of pea plants (Pisum sativum L.). J. Plant Physiol., 163(6), 591–600. doi:10.1016/j.jplph.2005.09.014
- Yan H, Liu N, Jin J, Sun Y, Shuping YU, Wenxiong LI 2003: Relationship between boron and IAA, GA3, iPA and ABA content in the different organs of wheat. Soils Fert., 6, 52–56.
- Yau SK, Ryan J 2008: Boron toxicity tolerance in crops: a viable alternative to soil amelioration. Crop Sci., 48(3), 854–865. doi:10.2135/cropsci2007.10.0539
- Zhao DL, Oosterhuis D, Dugger P, Richter D 2003: Cotton growth and physiological responses to boron deficiency. J. Plant Nutr., 26(4), 855–867. doi:10.1081/PLN-120018570
- Zhao Y, Wu P, Zhao S, Feng H 2013: Variation of soil infiltrability across a 79-year chronosequence of naturally restored grassland on the Loess Plateau, China. J. Hydrol., 504(22), 94–103. doi:10.1016/j.jhydrol.2013.09.039
- Zhou T, Hua Y, Zhang B, Zhang X, Zhou Y, Shi L, Xu F 2017: Low-boron tolerance strategies involving the pectin-mediated cell wall mechanical properties in Brassica napus. Plant Cell Physiol., 58(11), 1991–2005. doi:10.1093/pcp/pcx130