
ABSTRACT
Bermudagrass (Cynodon dactylon) is a salinity-tolerant turfgrass that has good use potential in the saline-alkali lands of warm regions. However, the systematic Na+ and K+ regulation mechanisms under salinity stress remain unclear at the whole plant level. Two bermudagrass cultivars differing in salinity tolerance were exposed to 0, 50, 100, 200, or 300 mM NaCl in a hydroponic system. Growth, absorption, transportation, and secretion of Na+ and K+, and gas exchange parameters were determined in both cultivars. K+ contents were decreased and Na+ contents and Na+/K+ ratios were increased in both bermudagrasses with increased salinity; however, lower Na+ content and Na+/K+ ratio and more stable K+ content were found in the leaves of the salinity-tolerant ‘Yangjiang’ than the salinity-sensitive ‘Nanjing’. Higher Na+ contents in root cortical cells were found than in the stele cells of ‘Yangjiang’, but the opposite was observed in ‘Nanjing’. Lower Na+ contents and higher K+ contents were found in vessels for ‘Yangjiang’ than for ‘Nanjing’. Salinity stress increased the selective transport of K+ over Na+ from roots to leaves and the Na+-selective secretion via salt glands, which were stronger in ‘Yangjiang’ than ‘Nanjing’. Net photosynthetic rate and stomatal conductance decreased in the two bermudagrasses with increased salinity; however, they were more stable in ‘Yangjiang’. The results suggested that bermudagrass could reduce Na+ accumulation and maintain K+ stability in leaves under salinity stress by restricting Na+ into vessels in roots, selectively transporting K+ over Na+ from roots to leaves, selectively secreting Na+ via leaf salt glands, and maintaining suitable stomatal conductance.
1. Introduction
Saline soil is a type of soil widely distributed throughout the world, and more than 800 million hectares are estimated to be salt-affected (Rengasamy Citation2010). Improper irrigation methods and the use of snow-melting salt in winter have also caused a large area of secondary salinization of soil (Li et al. Citation2014; Marcum Citation2006). The high salt content of soil inhibits the growth of turfgrasses, which causes the decline of turf quality (Huang, DaCosta, and Jiang Citation2014; Song, Wang, and Jiang Citation2017; Tang et al. Citation2013). Breeding salinity-tolerant turf cultivars is the key to solving the problem of turf planting in saline soil (Li et al. Citation2018b; Marcum Citation2006).
Bermudagrass (Cynodon dactylon (L.) Pers.), which belongs to the Chloridoideae of Poaceae, is a type of perennial herbaceous plant with well-developed rhizomes and stolons (Li et al. Citation2018a). It is a widely used warm-season turfgrass, forage and ecological restoration plant in tropical, subtropical, and warm-temperate regions. Some studies have shown that bermudagrass has good salinity tolerance (Bizhani and Salehi Citation2014; Chen et al. Citation2009b) and has good use potential in the saline-alkali lands (Singh, Pandey, and Singh Citation2013). Significant genetic variation in salinity tolerance exists among bermudagrass genotypes (Chen et al. Citation2014b; Marcum and Pessarakli Citation2006; Tran et al. Citation2018; Xiang et al. Citation2017, Citation2018). Marcum and Pessarakli (Citation2006) found salinity resulted in a 50% reduction in shoot dry weight ranging from 26 to 40 dS m–1 in thirty-five bermudagrass cultivars. Chen et al. (Citation2014b) confirmed that the coefficients of variation of relative leaf firing percentage and relative shoot weight ranged from 25.5 to 41.6% across fifty-one natural bermudagrass germplasm resources from China under salinity stress.
Under salinity stress, the Na+ content increased and K+ content decreased in the roots and leaves of bermudagrass (Chen et al. Citation2014a; Hameed and Ashraf Citation2008; Hu et al. Citation2012; Marcum and Pessarakli Citation2006). The mechanism of bermudagrass regulating sodium and potassium balance has been partially studied. As a type of salt-secreting plant, bicellular salt glands typical of plants belonging to Chloridoideae, Poaceae were found in the leaves of bermudagrass, and Na+ could be selectively secreted over K+, which may reduce Na+ accumulation and toxicity (Liphschitz and Waisel Citation1974). Marcum and Pessarakli (Citation2006) proved that Na+ secretion ability was negatively correlated with Na+ accumulation in bermudagrass leaves and was positively correlated with salinity tolerance, indicating that an increase in Na+ secretion could decrease Na+ accumulation in leaves and was an important way to improve bermudagrass salinity tolerance. However, Chen et al. (Citation2009b) noted that bermudagrass had weaker salt secretion ability than Zoysia japonica, although its salinity tolerance was stronger. At the same time, Chen et al. (Citation2009b) found that the Na+ and K+ selective transport capacity in bermudagrass was stronger than that in Z. japonica, which suggested that ion-selective transport may be one of the ion regulation mechanisms in bermudagrass under salinity stress. However, that study used only one bermudagrass genotype and lacked a comparative analysis between different salinity-tolerant genotypes. Therefore, the systematic mechanisms of how bermudagrass can reduce Na+ accumulation and maintain K+ stability in leaves at whole plant level remains unclear under salinity stress.
Understanding bermudagrass salinity tolerance mechanisms are conducive to better breeding salinity-tolerant cultivars. The effect of salinity stress on the growth and Na+ and K+ regulation from the point of ion absorption, transport, secretion, and stomatal regulation in the two bermudagrasses was determined in this study for addressing the following questions: (1) What are the different effects of salinity stress on growth and Na+ and K+ contents in different tissues in two bermudagrasses? (2) How does bermudagrass systematically cope with salinity stress at the point of ion regulation pathway at the whole plant level?
2. Materials and methods
2.1. Plant materials
Two bermudagrass cultivars with different salinity tolerances were used in this study, including salinity-tolerant ‘Yangjiang’ and salinity-sensitive ‘Nanjing’, according to previous results of salinity tolerance evaluation (Chen et al. Citation2009a). Chen et al. (Citation2009a) found ‘Yangjiang’ had significantly lower leaf firing percentage than ‘Nanjing’ under salinity stress.
2.2. Plant culture and salinity treatment
From 12 June to 4 October 2015, the experiment was conducted in a solution culture system described by Chen et al. (Citation2014b) and Marcum and Murdoch (Citation1994) with small modifications. Uniform sprigs of each grass were planted into plastic cups (5 cm diameter × 5 cm depth) with holes in the bottom filled with coarse, acid-washed silica sand. The cup was suspended in 2-cm-thick polyvinyl chloride (PVC) sheet over plastic bucket containing 2.5 L of a constantly aerated Hoagland’ No. 1 solution (Hoagland and Arnon Citation1950). The experiment was conducted in greenhouses located at the Institute of Botany, Jiangsu Province and the Chinese Academy of Sciences (north latitude 32°02ʹ, east longitude 118°28ʹ). The plants were maintained in the greenhouses at an average maximum/minimum temperature of 30.4°C/22.6°C and a 13-h photoperiod. The maximum photosynthetically active radiation (PAR) on a horizontal plane just above the canopy ranged from 1200 to 1800 μmol m–2 s–1.
To ensure complete establishment, plants were grown for 2 months before the start of NaCl treatment. During this period, water lost from the nutrient solution was supplemented on another day using tap water, and the nutrient solution was adjusted at the same time to maintain a pH of approximately 6.0 using 1 mol L–1 HCl solution. The culture solution was changed every week during the entire experiment.
Before the start of treatment, the shoots were clipped weekly to a 3 cm height, and the roots at the base of the cups were clipped; all clippings were discarded. Then, the bermudagrasses were subjected to 0 (control), 50, 100, 200, or 300 mM NaCl treatments. To avoid salt shock, the salinity level was increased by 50 mM daily until the given salinity was reached. After the highest salinity level (300 mM) was reached, the bermudagrasses were continuously exposed to each NaCl concentration for 6 weeks. After the solution had reached the highest salinity level (300 mM NaCl), the bermudagrasses were clipped and the clippings discarded; they had not clipped again until the end of the experiment.
2.3. Determination of length and dry weight of shoot and root
Shoot length (SL) and root length (RL), averages of the longest three shoots and roots per cup, were measured. Shoot clippings (> 3.0 cm height) and roots exported at the base of the cups were harvested. The harvested plant material was washed three times in tap water and three times in double-distilled water (DD water) and then oven-dried at 80°C for 24 h. Shoot dry weight (SW) and root dry weight (RW) was then measured and recorded.
2.4. Na+ and K+ contents in roots, stems, and leaves and transport capacity from roots to leaves
The dry samples of the third and fourth leaves, stems, and roots harvested above were ground to a powder, and approximately 20 mg of sample was placed into a test tube containing 15 mL of DD water and sealed. After extraction by boiling for 1 h and filtering, the Na+ and K+ contents of the extracting solution were measured by flame photometry (Jenway PFP7, UK) according to the method described by Chen et al. (Citation2014b). All ion contents were calculated on a tissue dry weight basis (mmol kg DW–1). Values for selective transport capacity for K+ over Na+ from roots to leaves (ST) were calculated according to the following equation as described by Guo et al. (Citation2012): ST = (K+/Na+ in leaf)/(K+/Na+ in root).
2.5. Na+ and K+ secretion capacity from leaves
To determine ion secretion capacity, plants were thoroughly rinsed with distilled water to remove all external salt before the end of the experiment. After 3 d, the third or fourth leaves were carefully excised and immediately washed with 10 mL of distilled water in a centrifuge tube according to the method of Marcum, Anderson, and Engelke (Citation1998), then removed, and oven-dried at 80°C for 48 hours. Leaf DW was measured and recorded. The Na+ and K+ contents in the washing solution were determined by flame photometry (Jenway PFP7, UK). Na+ and K+ secretion rates are expressed as mmol per kilogram leaf dry weight per three days (mmol kg DW–1 3 d–1).
2.6. Determination of salt gland density in leaf
Before the end of the experiment, the fresh third leaf from 200 mM NaCl treatment was cut into pieces 0.5 cm in length, washed with mixed liquor composed of alcohol and acetone (90:10 in volumes) to remove dust and the wax layer on the surface of the blade, and then washed three times with 0.1 mM phosphate buffer solution (pH 7.0). The material was fixed for 24 h with 2.5 % glutaraldehyde at room temperature and washed again with 0.1 mM phosphate buffer solution before being dehydrated in an alcohol series (30%, 50%, 70%, 80%, and 90% alcohol for 20 min and 100% alcohol for 3 h). After infiltration for 24 h with tertbutyl alcohol, the samples were dried in vacuum freeze-drying equipment, platinized with an ion sputter, and then observed and imaged with a scanning electron microscope (SEM) (S-3000N, Hitachi High-Technologies Corporation, Japan). Salt glands were observed according to the described morphology by Liphschitz and Waisel (Citation1974), Oross and Thomson (Citation1982), and Worku and Chapman (Citation1998) and counted in images obtained with an SEM using a magnification of 100-fold. Three independent blades are used in each replication for salt gland number determination.
2.7. X-ray microanalysis of Na+ and K+ in the root
X-ray analysis of Na+ and K+ contents in root cross section was conducted as described by Xie et al. (Citation2008) with some modifications. After exposure to control or 200 mM NaCl stress for 10 d, roots were washed in distilled water 3 times. Two root segments in the root hair zone of each cultivar or treatment were cut with a razor blade, wrapped with filter paper, and immediately cooled by liquid nitrogen. The fractured root segments were freeze-dried and platinized with an ion sputter. The distribution of Na+ and K+ in the samples was analyzed by a Model S-3000N SEM equipped with energy-dispersive X-ray spectrometer (Horiba Inc., Kyoto, Japan). The relative Na+ or K+ content was calculated by expressing as the percentage of the atomic number for Na+ or K+ element in a given site in the total atomic number for all the elements that can be detected.
2.8. Determination of photosynthesis-related indicators
Before the end of the experiment, the third fully expanded leaves from the top of a plant were selected for the determination of photosynthesis-related indicators, including net photosynthetic rate (Pn, µmol CO2 m–2 s–1), stomatal conductance (Cond, mol H2O m–2 s–1), intercellular CO2 concentration (Ci, µmol CO2 mol–1), and transpiration rate (Tr, mmol H2O m–2 s–1), using a portable infrared gas analyzer (Li-6400XT, LICOR, Inc.). The analyzer was set at 400 µmol mol–1 flow rate with an LI-COR 6400 lighting emitting diode external light source providing a photosynthetic photon flux density of 1000 µmol m–2 s–1. Three samples were measured respectively from each cup, and converted data according to leaf area were averaged from three determinations for advanced statistical analysis.
2.9. Experimental design and statistical analysis
All data were subjected to analysis of variance (ANOVA) using SPSS 13.0 software (SPSS Institute, Cary, NC, USA). Differences among means ± SD of treatments for each cultivar were evaluated by the Duncan test at 0.05 probability level.
3. Results
3.1. Analysis of variance
A two-factor interaction experiment, including two plant cultivars (Yangjiang and Nanjing) and five different salinity treatments (0, 50, 100, 200, and 300 mM NaCl), was conducted and indicators related to plant growth and ion regulation were determined in the study. As indicated by ANOVA analysis (), cultivar and salinity treatment all had significant effects on root dry weight, shoot length, shoot dry weight, K+ and Na+ content and Na+/K+ ratio in root, stem, and leaf, selective transport capacity for K+ over Na+ from roots to leaves, K+, and Na+ secretion rate, and Na+/K+ ratio in secretion. Salinity treatment had significant effects on root length, net photosynthetic rate, stomatal conductance, intercellular CO2 concentration, and transpiration rate, but cultivar had no significant effects on these traits. Significant cultivar × salinity treatment interactions were found for root length, root dry weight, K+ and Na+ content in leaf and stem, Na+/K+ rate in root, stem, and leaf, net photosynthetic rate, stomatal conductance, and intercellular CO2 concentration, but there were no cultivar × salinity treatment interactions for shoot length, shoot dry weight, Na+ and K+ content in root, selective transport capacity for K+ over Na+ from roots to leaves, and transpiration rate. Significant effects of cultivar, leaf surface, and cultivar × leaf surface interaction on salt gland density were also found.
Table 1. Analyses of variances for root length (RL), root dry weight (RW), shoot length (SL), shoot dry weight (SW), root Na+ content (Na+R), root K+ content (K+R), root Na+/K+ ratio (Na+/K+R), stem Na+ content (Na+S), stem K+ content (K+S), stem Na+/K+ ratio (Na+/K+S), leaf Na+ content (Na+L), leaf K+ content (K+L), leaf Na+/K+ ratio (Na+/K+L), value of selective transport K+ over Na+ from root to leaf (ST), leaf Na+ and K+ secretion rate (Na+Se and K+Se), Na+/K+ in secretion (Na+/K+Se), net photosynthetic rate (Pn), stomatal conductance (Cond), intercellular CO2 concentration (Ci), and transpiration rate (Tr) in bermudagrasses under salinity stress
3.2. Root and shoot growth
The responses of root length and weight were significantly different between the two bermudagrass cultivars under salinity stress (). The root length and weight of the salinity-tolerant cultivar ‘Yangjiang’ were significantly promoted under salinity stress; the greatest length was reached in the 200 mM NaCl treatment, at 310% of the control, and the greatest dry weight was reached in the 50 mM NaCl treatment, at 260% of the control. However, the root length of the salinity-sensitive cultivar ‘Nanjing’ was increased to some degree under salinity stress. The root length was the longest in the 50 mM NaCl treatment in ‘Nanjing’ and significantly longer than the control treatment, reaching 142% of the control. In the 100–300 mM NaCl treatments, the root length of ‘Nanjing’ was also somewhat promoted but was not significantly different from that of the control. The root weight of ‘Nanjing’ was not significantly different from the control in the 50–100 mM NaCl treatments but significantly decreased in the 200–300 mM NaCl treatments.
Figure 1. Effect of different NaCl concentrations on root and shoot growth in two bermudagrasses. Mean values (±SD, n = 4) in each cultivar followed by the different lower-case letters are significantly different between NaCl treatments at P ≤ 0.05
With increasing salinity, shoot growth declined in both bermudagrasses, but ‘Yangjiang’ was less affected than ‘Nanjing’ (). Compared with the control, the shoot length and weight decreased significantly in the 200 mM NaCl treatment in ‘Yangjiang’ and in the 100 mM and 50 mM NaCl treatments in ‘Nanjing’, respectively. Under the highest salinity treatment (300 mM NaCl), ‘Yangjiang’ could maintain higher relative shoot dry weight (at 58% of the control) than ‘Nanjing’ (at 43% of the control).
3.3. Na+ and K+ contents in root, stem, and leaf
With the increase in salinity, the K+ contents in the roots, stems, and leaves of the two bermudagrasses declined, but the Na+ contents and Na+/K+ ratios increased (). The K+ contents in ‘Yangjiang’ were higher than those in ‘Nanjing’ in roots but were lower than those in ‘Nanjing’ in stems and leaves across different salinity levels. Compared with the control, the K+ contents decreased to 33% in ‘Yangjiang’ and 35% in ‘Nanjing’ in roots, 47% in ‘Yangjiang’ and 39% in ‘Nanjing’ in stems, and 78% in ‘Yangjiang’ and 65% in ‘Nanjing’ in leaves under the 300 mM NaCl treatment, which indicated that ‘Yangjiang’ had a greater ability to maintain K+ stability in stems and leaves than did ‘Nanjing’ under high salinity stress. The Na+ contents in ‘Yangjiang’ were slightly higher than those in ‘Nanjing’ in roots and were lower than those in ‘Nanjing’ in stems and leaves. Compared with the control, the Na+ contents were 6.0 times and 9.7 times in roots, 8.0 times and 8.2 times in stems, and 13.8 times and 22.6 times in leaves in ‘Yangjiang’ and ‘Nanjing’, respectively, under 300 mM NaCl treatment. Na+/K+ ratios in ‘Yangjiang’ were lower than those in ‘Nanjing’ in roots, stems, and leaves. Na+/K+ ratios in the 300 mM NaCl treatment were 18.5 times and 27.7 times in roots, 17.0 times and 21.4 times in stems, and 13.8 times and 22.6 times in leaves in ‘Yangjiang’ and ‘Nanjing’, respectively, higher than the control. These results indicated that salinity-tolerant ‘Yangjiang’ had a greater ability to reduce Na+ accumulation in stems and leaves than did salinity-sensitive ‘Nanjing’ under high salinity stress.
Table 2. Effect of different NaCl concentrations on Na+ and K+ content and Na+/K+ ratio in root, stem, and leaf, and selective transport ability for K+ over Na+ from root to leaf (ST) of two bermudagrasses
3.4. Na+ and K+ distribution in the transection of root hair zone
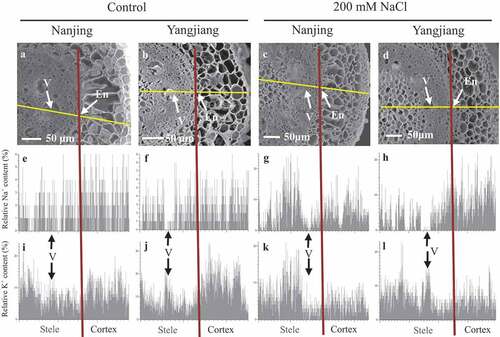
X-ray microanalysis of Na+ and K+ distribution in root transection from pith to epidermis was performed using a spectrometer combined with an SEM (). Under control condition, lower relative Na+ contents were found than relative K+ contents in the roots of two bermudagrasses (). But under 200 mM NaCl stress, relative Na+ contents increased in two bermudagrasses and relative K+ contents decreased in some tissues such as cortex (). Under 200 mM NaCl stress, the relative Na+ contents were higher in the epidermis and cortex than in the stele in ‘Yangjiang’; however, the opposite were true in ‘Nanjing’ on the whole (). In the stele, the relative Na+ contents were generally lower in vessels than in other tissues in both bermudagrasses, although they were relatively lower in ‘Yangjiang’ than in ‘Nanjing’ under control or 200 mM NaCl stress (). High relative K+ contents were found in cortex under control condition, but they decreased and were generally higher in the stele than in the epidermis and cortex in both bermudagrasses under 200 mM NaCl stress (). In the vessels, the relative K+ contents were higher than other tissues around the vessels in ‘Yangjiang’, but they were lower or similar in ‘Nanjing’ ().
Figure 2. Distribution of Na+ (e-h) and K+ (i-l) in the transection of root hair zone of salinity sensitive cultivar ‘Nanjing’ and salinity tolerant cultivar ‘Yangjiang’ from the line-scanning of an X-ray under control or 200 mM NaCl stress. Two independent samples per cultivar and treatment were used in the experiment, both of the samples showed the unanimous results, and one of the results was showed as representative in the figure. The relative Na+ or K+ content in Y axis was expressed as the percentage of the atomic number for Na+ or K+ element in a given site in the total atomic number for all the elements that can be detected. The horizontal line in the graph indicates the location of the line-scanning of an X-ray and the vertical line represents the boundary between the cortex and the stele. En, endodermis; V, vessel
3.5. Selective transport capacity for K+ over Na+ from roots to leaves
Na+ and K+ selective transport from roots to leaves reflects the ability to promote K+ but inhibit Na+ transport to the leaves by the roots. With the increase in salinity, the ST of two bermudagrasses showed an increasing trend, and the maximum ST was found in the 200 mM NaCl treatment and then decreased in the 300 mM NaCl treatment (). Between two bermudagrasses, the ST of ‘Yangjiang’ was stronger than that of ‘Nanjing’ under all treatments. Furthermore, there was no significant difference among all treatments for ‘Nanjing’, but the ST was significantly higher in the 200 mM NaCl treatment than in the other treatments in ‘Yangjiang’.
3.6. Selective Na+ and K+ secretion ability by leaf salt glands
Salt crystals or droplets were obviously found on the abaxial leaf surface and leaf sheath surface but found in less abundance on the adaxial leaf surface of the salinity-tolerant cultivar ‘Yangjiang’ under salinity stress (). However, these crystals were less found on both leaf surfaces in the salinity-sensitive cultivar ‘Nanjing’ (). Salt glands, with the typical double-cell structure of Poaceae, were observed on the leaf surface of both bermudagrasses (). Salt gland density was higher on the abaxial leaf surface than on the adaxial leaf surface in both bermudagrasses and was higher in ‘Yangjiang’ than ‘Nanjing’ on both leaf surfaces ().
Figure 3. Secretory salt crystal (a, b) and salt gland (c, d) on the leaf of bermudagrass cultivars ‘Nanjing’ (a, c) and ‘Yangjiang’ (b, d) under 200 mM NaCl treatment. White Points in leaf surface (a, b) are secretory salt crystals. The solid arrow indicates salt gland and a dotted arrow indicates stoma in figure (c) and (d)
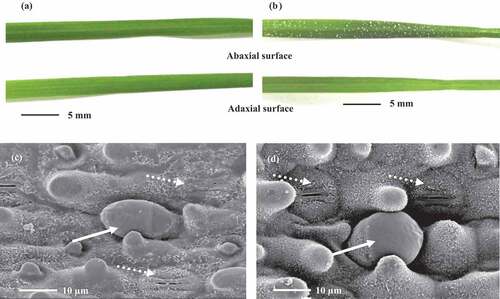
Figure 4. Salt gland number of different leaf surface in two bermudagrasses under 200 mM NaCl treatment. Mean values (±SD, n = 12) in the same leaf surface followed by the different lower-case letters are significantly different between cultivars at P ≤ 0.01. ** indicate salt gland number is significantly different at P ≤ 0.01 between leaf surfaces at the same cultivar
The secretion rates of Na+ and K+ increased in the two bermudagrasses when NaCl levels increased from 0 mM to 200 mM (). The maximum secretion rates were found in the 200 mM NaCl treatment and then decreased in the 300 mM NaCl treatment, except that the highest Na+ secretion rate of ‘Yangjiang’ was found in the 300 mM NaCl treatment. Compared to the two cultivars, the Na+ and K+ secretion rates of ‘Yangjiang’ were three times to six times and two times to three times higher than those of ‘Nanjing’, respectively. The Na+ secretion rate was more than K+ when the NaCl levels exceeded 100 mM in ‘Yangjiang’ or 200 mM in ‘Nanjing’. Furthermore, the Na+/K+ ratio was higher in ‘Yangjiang’ than in ‘Nanjing’ at all treatments, which indicated that ‘Yangjiang’ had higher selective secretion ability for Na+ over K+ than ‘Nanjing’.
Table 3. Effect of different NaCl concentrations on Na+ and K+ secretion rate and Na+/K+ in secretion in two bermudagrasses
3.7. Photosynthesis and stomatal regulation
With the increase in salinity, the net photosynthetic rate (Pn) decreased in both bermudagrasses, but the degree of reduction was lower in ‘Yangjiang’ than in ‘Nanjing’ (). Pn had decreased significantly in the 100 mM NaCl treatment in ‘Yangjiang’ and in the 50 mM NaCl treatment in ‘Nanjing’ compared with the control. However, Pn was higher in ‘Nanjing’ than in ‘Yangjiang’ under controlled conditions, which was diametrically opposite to the 300 mM NaCl treatment, indicating that ‘Yangjiang’ had a more stable photosynthetic rate under high salinity stress.
Figure 5. Effect of different NaCl concentrations on photosynthesis-related indicators in two bermudagrasses. Mean values (±SD, n = 4) in each cultivar followed by the different lower-case letters are significantly different between NaCl treatments at P ≤ 0.05
The stomatal conductance (Cond) showed a certain decline in the two bermudagrasses when the salinity was increased, except that Cond was slightly increased in ‘Yangjiang’ in the 50 mM NaCl treatment (). The Cond of ‘Nanjing’ was significantly decreased in the 50 mM NaCl treatment compared to the control and further decreased significantly in the 200 and 300 mM NaCl treatments, while the Cond of ‘Yangjiang’ decreased significantly only in the 300 mM NaCl treatment compared to the control. Moreover, the Cond was higher in ‘Yangjiang’ than in ‘Nanjing’ in the 300 mM NaCl treatment. The results illustrated that the Cond of ‘Yangjiang’ was not very sensitive to salinity stress and was significantly inhibited only under high salinity (300 mM NaCl) stress; however, the Cond of ‘Nanjing’ was very sensitive to salinity stress and significantly decreased under low salinity stress.
The intercellular CO2 concentration (Ci) of the two bermudagrasses presented different change trends with increasing salinity (). The Ci of ‘Yangjiang’ significantly increased with the increase in salinity, but the Ci of ‘Nanjing’ significantly increased in the 0 to 100 mM NaCl treatments and then decreased significantly with the further increase in salinity.
The transpiration rate (Tr) of ‘Yangjiang’ was no significant difference between all salinity treatments (), but the Tr of ‘Nanjing’ significantly peaked in the 100 mM NaCl treatment and was the lowest in the 300 mM NaCl treatment.
4. Discussion
Biomass is a good evaluation index of salinity tolerance for turfgrass, and turfgrass with higher relative biomass under salinity stress is generally considered salinity tolerant (Chen et al. Citation2014a; Hu et al. Citation2012; Marcum and Pessarakli Citation2006). Leaf firing percentage or percent green leaf canopy area is the other key evaluation index of salinity tolerance for turfgrass (Chen et al. Citation2014a; Marcum and Pessarakli Citation2006). In the previous study, Chen et al. (Citation2009a) confirmed ‘Yangjiang’ had higher salinity tolerance than ‘Nanjing’ based on leaf firing percentage. In this study, the relative shoot and root weights for ‘Yangjiang’ under NaCl stress were higher than those for ‘Nanjing’ under NaCl stress (), which further proved that ‘Yangjiang’ had greater salinity tolerance than ‘Nanjing’.
Na+ and K+ are both alkali metals, and they have close physical and chemical properties, which means that Na+ can compete with K+ at transport sites and at intracellular binding sites and result in K+ deficiency and the inhibition of metabolic processes that crucially depend on K+ (Maathuis and Amtmann Citation1999). Thus, ion imbalance, mainly Na+ accumulation and K+ deficiency, is an important toxicity factor for plants under salinity stress (Deinlein et al. Citation2014; Tanaka et al. Citation2018). In previous studies, some researchers found that Na+ content was increased and K+ content was decreased in the leaves of bermudagrass under salinity stress (Chen et al. Citation2009b; Lu et al. Citation2007), but salinity-tolerant genotypes had a lower Na+ content and higher K+ content or K+ stability in leaves than did salinity-sensitive genotypes at the same salinity level (Hameed and Ashraf Citation2008; Hu et al. Citation2012). Bermudagrass salinity tolerance was negatively correlated with leaf Na+ content (Chen et al. Citation2014b; Marcum and Pessarakli Citation2006) and was positively correlated with leaf K+ content (Chen et al. Citation2014a). Here, NaCl stress increased leaf Na+ content and decreased K+ content in both bermudagrasses, but a lower leaf Na+ content and more stable K+ content were found in the salinity-tolerant cultivar ‘Yangjiang’ with increasing salinity levels (), which indicated that the salinity-tolerant bermudagrass cultivar had a stronger ability to regulate the balance of Na+ and K+ content in leaves under salinity stress.
Na+ enters the plant cell by root absorption, moves into the root vessel, and finally arrives in the leaf mainly through the transpiration stream. Water emanates into the air through stomatal transpiration, but Na+ remains in the leaf and poisons the leaf cells when Na+ accumulates to a certain extent. Through X-ray microanalysis, the Na+ content of ‘Yangjiang’ was found to be higher in the root cortex and epidermis than in the stele under salinity stress, but that of ‘Nanjing’ was the opposite (), which indicated that ‘Yangjiang’ had a greater ability to inhibit Na+ entry into the stele by the endodermis. Peng et al. (Citation2004) also found that alkali grass (Puccinellia tenuiflora), a halophyte belonging to Poaceae, could reduce Na+ uptake through the apoplastic barrier, the Casparian bands of the endodermis, thus reducing the accumulation of Na+ in leaves. This study indicated that bermudagrass maybe had the endodermis barrier to inhibit Na+ entry into the stele and the root restriction Na+ absorption was an important salinity tolerance mechanism in the salinity-tolerant bermudagrass.
Na+ and K+ selective transport from root to leaf is another major mechanism for the regulation of Na+ and K+ homeostasis at the whole plant level under salinity stress (Deinlein et al. Citation2014). Some plants had been confirmed that the roots could gradually retrieve Na+ from the transpiration stream and indirectly promote K+ release from the xylem parenchyma to the vessel, which resulted in low Na+ accumulation and stable K+ content in leaves, thus increasing salinity tolerance (Møller et al. Citation2009; Ren et al. Citation2005). So the longer the root, the longer the retrieval path, and the retrieval effect may be better. Salinity stress more strongly promoted root growth in salinity-tolerant ‘Yangjiang’ than in salinity-sensitive ‘Nanjing’. The root length of ‘Yangjiang’ increased 210% in the 200 mM NaCl treatment compared to the control treatment (). In addition, ‘Yangjiang’ had a stronger ability of ST than ‘Nanjing’ (). Moreover, the change trend was consistent between ST and root length with the increase in salinity levels in ‘Yangjiang’, and all reached the maximum in the 200 mM NaCl treatment (, ). At the same time, according to X-ray microanalysis, ‘Yangjiang’ had a lower Na+ content and higher K+ content in vessels than did ‘Nanjing’ (). At the whole root level, we also found ‘Yangjiang’ accumulated more Na+ than ‘Nanjing’ under salinity stress (). Therefore, we speculated that when root growth was significantly enhanced in ‘Yangjiang’ under salinity stress, the ST was stronger so that it could better reduce Na+ accumulation and increase K+ stability in the leaves. This partially explained ‘Yangjiang’ had a lower Na+ content and more stable K+ content in leaves under salinity stress than did ‘Nanjing’. Stronger ST was one important reason that ‘Yangjiang’ had higher salinity tolerance.
The remaining Na+ in the transpiration stream finally enters the leaves and slowly accumulates for the duration in which plants are exposed to the salt environment. If Na+ cannot be excluded from leaves over time, it eventually leads to plant poisoning and even death. Some plants have salt glands in the leaves, and they can selectively secrete Na+ and reduce Na+ accumulation in the leaves to maintain the growth of plants under salinity stress (Céccoli et al. Citation2015; Yuan, Leng, and Wang Citation2016). Salt in secretion by salt glands form salt crystals around the salt glands in dry air environment (Oi et al. Citation2013; Worku and Chapman Citation1998). Salt glands in Poaceae usually consist of double cells, including cap cells and basal cells (Dassanayake and Larkin Citation2017). Bermudagrass has a salt gland structure typical of Poaceae and can secrete ions, such as Na+, K+, and Cl – (Liphschitz and Waisel Citation1974; Oross and Thomson Citation1982). Salt crystals were observed on the surface of the blade in both ‘Yangjiang’ and ‘Nanjing’ under salinity stress, but they were more easily found in ‘Yangjiang’. Salt crystals mainly appear on the leaf abaxial surface of bermudagrass and rarely on the adaxial surface (). This result is consistent with the discovery of Worku and Chapman (Citation1998). These authors found that the salt crystal counts were 2.1 and 13.2 for the adaxial and abaxial leaf surfaces, respectively (Worku and Chapman Citation1998). The densities of salt glands on the abaxial surfaces of the two bermudagrasses were greater than those on the adaxial surfaces; moreover, they were higher in ‘Yangjiang’ than in ‘Nanjing’ on both leaf surfaces in this experiment (). Higher densities of salt glands could partially explain the larger number of salt crystals in ‘Yangjiang’ or on the abaxial surfaces of bermudagrass. Marcum and Pessarakli (Citation2006) confirmed that salinity tolerance was negatively correlated with leaf Na+ content and positively correlated with leaf Na+ excretion rate among thirty-five bermudagrass cultivars. The salinity-tolerant cultivar ‘Yangjiang’ had a higher Na+ excretion rate and lower leaf Na+ content than the salinity-sensitive cultivar ‘Nanjing’ under all salinity levels. This result is consistent with that of Marcum and Pessarakli (Citation2006) and proved that Na+ excretion by salt gland was one of the important mechanisms to reduce Na+ accumulation in bermudagrass leaves under salinity stress.
In general, plant salt glands can selectively secrete Na+ over K+ under salinity stress (Liphschitz and Waisel Citation1974). However, selectivity varies with the salt type and concentration, air humidity, light, plant species, etc. (Liphschitz and Waisel Citation1974; Pollak and Waisel Citation1979). The selectivity was low in bermudagrasses under low salinity levels, the 0–50 mM NaCl treatment for ‘Yangjiang’ and 0–100 mM NaCl treatment for ‘Nanjing’, respectively (). The Na+ excretion rate was lower than the K+ excretion rate under these salinity levels. Only when the salinity levels were high the 100–300 mM NaCl treatment for ‘Yangjiang’ and the 200–300 mM NaCl treatment for ‘Nanjing’, was the Na+/K+ ratio in excretion over 1 (). Similar results were also observed by Liphschitz and Waisel (Citation1974). The salinity-tolerant cultivar ‘Yangjiang’ had higher selectivity in excretion than did the salinity-sensitive cultivar ‘Nanjing’ at all NaCl levels. The results suggested that maintaining a relatively higher Na+ selectivity over K+ in excretion is a crucial mechanism for ion regulation under salinity stress in bermudagrass.
Stomatal opening and closure can adjust the flow rate of the transpiration stream (Perera, Mansfield, and Malloch Citation1994). Stomata were closed in halophyte Aster tripolium but remained opened in non-halophyte A. amellus under salinity stress, which resulted in the death of A. amellus due to overaccumulation of Na+ in leaves (Robinson et al. Citation1997; Véry et al. Citation1998). Reduced stomatal conductance under salinity stress can reduce the transpiration rate and then reduce the Na+ transported into the leaves, thus reducing the accumulation of Na+ and decreasing Na+ injury in the leaves (Perera, Mansfield, and Malloch Citation1994). The stomatal conductance of the two bermudagrasses used in this experiment was decreased when the salinity levels were increased (). This indicated that bermudagrass could partially close the stomata to reduce Na+ accumulation in the leaves. However, the more salinity-tolerant cultivar ‘Yangjiang’ had higher stomatal conductance, intercellular CO2 concentration, and net photosynthetic rate under high salinity stress (300 mM NaCl treatment), although it had a higher transpiration rate (). The result was in agreement with the conclusion of Hameed and Ashraf (Citation2008).
The stomata are channels not only for water loss but also for CO2 movement into the leaves. Excessive closure of the stomata will reduce the entry of CO2 into leaves, lead to a CO2 deficiency in the mesophyll cell, subsequently inhibit photosynthesis, reduce energy accumulation and finally inhibit plant growth (Farquhar and Sharkey Citation1982). Therefore, plants must address the contradiction between the toxicity of Na+ accumulation caused by stomatal opening and the CO2 deficiency and photosynthesis decline caused by stomatal closure under salinity stress. Proper closure of stomata and maintenance of appropriate photosynthesis, along with integration with other ion regulation mechanisms to reduce saline ion accumulation in the leaves, is important for plants to survive under salinity stress. Thus, the salinity-tolerant cultivar ‘Yangjiang’ had a stronger ability to regulate stomatal closure and opening than did the salinity-sensitive cultivar ‘Nanjing’ under salinity stress and could reduce the transpiration stream and decrease saline ion accumulation in the leaves, thereby maintaining photosynthesis, which resulted in more salinity tolerance.
In conclusion, salinity stress inhibited shoot growth and promoted root growth in the two bermudagrasses, but the salinity-tolerant cultivar ‘Yangjiang’ had lower inhibition in shoots and higher promotion in roots than did the salinity-sensitive cultivar ‘Nanjing’. ‘Yangjiang’ could maintain a lower leaf Na+ content and higher leaf K+ stability than ‘Nanjing’ under salinity stress through a stronger ability to inhibit Na+ absorption in roots, selective transport of K+ over Na+ from roots to leaves, selective secretion of Na+ over K+ in leaves, and maintenance of proper stomatal conductance.
Disclosure statement
No potential conflict of interest was reported by the authors.
Additional information
Funding
Related Research Data
References
- Bizhani, S., and H. Salehi. 2014. “Physio-Morphological and Structural Changes in Common Bermudagrass and Kentucky Bluegrass during Salt Stress.” Acta Physiologiae Plantarum 36: 777–786. doi:10.1007/s11738-013-1455-y.
- Céccoli, G., J. Ramos, V. Pilatti, I. Dellaferrera, J. C. Tivano, E. Taleisnik, and A. C. Vegetti. 2015. “Salt Glands in the Poaceae Family and Their Relationship to Salinity Tolerance.” The Botanical Review; Interpreting Botanical Progress 81: 162–178. doi:10.1007/s12229-015-9153-7.
- Chen, J., Q. Jiang, J. Zong, Y. Chen, X. Chu, and J. Liu. 2014a. “Variation in the Salt-Tolerance of 13 Genotypes of Hybrid Bermudagrass (Cynodon Dactylon (L.) Pers. × C. Transvaalensis Burtt-Davy) and Its Relationship with Shoot Na+, K+ and Cl− Ion Concentrations.” The Journal of Horticultural Science and Biotechnology 89: 35–40. doi:10.1080/14620316.2014.11513045.
- Chen, J., J. Yan, Y. Jiang, H. Guo, T. Zhang, X. Chen, and J. Liu. 2009a. “Preliminary Evaluation on Salinity Tolerance of Excellent Selections and Cultivars of Warm Season Turfgrass.” ActaPrataculturae Sinica 18: 107–114.
- Chen, J., J. Yan, Y. Qian, Y. Jiang, T. Zhang, H. Guo, A. Guo, and J. Liu. 2009b. “Growth Responses and Ion Regulation of Four Warm Season Turfgrasses to Long-Term Salinity Stress.” Scientia Horticulturae 122: 620–625. doi:10.1016/j.scienta.2009.07.004.
- Chen, J., J. Zong, Y. Gao, Y. Chen, Q. Jiang, Y. Zheng, and J. Liu. 2014b. “Genetic Variation of Salinity Tolerance in Chinese Natural Bermudagrass (Cynodon Dactylon (L.) Pers.) Germplasm Resources.” Acta Agriculturæ Scandinavica. Section B, Soil and Plant Science 64: 416–424. doi:10.1080/09064710.2014.919349.
- Dassanayake, M., and J. C. Larkin. 2017. “Making Plants Break a Sweat: The Structure, Function, and Evolution of Plant Salt Glands.” Frontiers in Plant Science 8: 406. doi:10.3389/fpls.2017.00406.
- Deinlein, U., A. B. Stephan, T. Horie, W. Luo, G. Xu, and J. I. Schroeder. 2014. “Plant Salt-Tolerance Mechanisms.” Trends in Plant Science 19: 371–379. doi:10.1016/j.tplants.2014.02.001.
- Farquhar, G. D., and T. D. Sharkey. 1982. “Stomatal Conductance and Photosynthesis.” Annual Review of Plant Physiology 33: 317–345. doi:10.1146/annurev.pp.33.060182.001533.
- Guo, Q., P. Wang, Q. Ma, J. Zhang, A. Bao, and S. Wang. 2012. “Selective Transport Capacity for K+ over Na+ Is Linked to the Expression Levels of PtSOS1 in Halophyte Puccinellia Tenuiflora.” Functional Plant Biology : FPB 39: 1047–1057. doi:10.1071/FP12174.
- Hameed, M., and M. Ashraf. 2008. “Physiological and Biochemical Adaptations of Cynodon Dactylon (L.) Pers. From the Salt Range (Pakistan) to Salinity Stress.” Flora 203: 683–694. doi:10.1016/j.flora.2007.11.005.
- Hoagland, D. R., and D. I. Arnon. 1950. “The Water-Culture Method for Growing Plants without Soil.” California Agricultural Experiment Station Publications 347: 1–32.
- Hu, L., Z. Huang, S. Liu, and J. Fu. 2012. “Growth Response and Gene Expression in Antioxidant-Related Enzymes in Two Bermudagrass Genotypes Differing in Salt Tolerance.” Journal of the American Society for Horticultural Science 137: 134–143. doi:10.21273/JASHS.137.3.134.
- Huang, B., M. DaCosta, and Y. Jiang. 2014. “Research Advances in Mechanisms of Turfgrass Tolerance to Abiotic Stresses: From Physiology to Molecular Biology.” Critical Reviews in Plant Sciences 33: 141–189. doi:10.1080/07352689.2014.870411.
- Li, D., J. Zong, J. Chen, H. Guo, Y. Wang, J. Li, and J. Liu. 2018a. “Effects of Low Nitrogen Nutrition on Plant Growth Characteristics and Nitrogen Accumulation in Chinese Natural Bermudagrass (Cynodon Dactylon (L.) Pers.) Germplasm Resources.” Journal of Soil Science and Plant Nutrition 64 (6): 736–745. doi:10.1080/00380768.2018.1510716.
- Li, J., J. Ma, H. Guo, J. Zong, J. Chen, Y. Wang, D. Li, L. Li, J. Wang, and J. Liu. 2018b. “Growth and Physiological Responses of Two Phenotypically Distinct Accessions of Centipedegrass (Eremochloa Ophiuroides (Munro) Hack.) To Salt Stress.” Plant Physiology and Biochemistry 126: 1–10. doi:10.1016/j.plaphy.2018.02.018.
- Li, Z., Y. Liang, J. Zhou, and X. Sun. 2014. “Impacts of De-Icing Salt Pollution on Urban Road Greenspace: A Case Study of Beijing.” Frontiers of Environmental Science & Engineering 8: 747–756. doi:10.1007/s11783-014-0644-2.
- Liphschitz, N., and Y. Waisel. 1974. “Existence of Salt Glands in Various Genera of the Gramineae.” The New Phytologist 73: 507–513. doi:10.1111/j.1469-8137.1974.tb02129.x.
- Lu, S., X. Peng, Z. Guo, G. Zhang, Z. Wang, C. Wang, C. Pang, Z. Fan, and J. Wang. 2007. “In Vitro Selection of Salinity Tolerant Variants from Triploid Bermudagrass (Cynodon Transvaalensis × C. Dactylon) and Their Physiological Responses to Salt and Drought Stress.” Plant Cell Reports 26: 1413–1420. doi:10.1007/s00299-007-0339-2.
- Maathuis, F. J. M., and A. Amtmann. 1999. “K+ Nutrition and Na+ Toxicity: The Basis of Cellular K+/Na+ Ratios.” Annals of Botany 84: 123–133. doi:10.1006/anbo.1999.0912.
- Marcum, K. B. 2006. “Use of Saline and Non-Potable Water in the Turfgrass Industry: Constraints and Developments.” Agricultural Water Management 80: 132–146. doi:10.1016/j.agwat.2005.07.009.
- Marcum, K. B., S. J. Anderson, and M. C. Engelke. 1998. “Salt Gland Ion Secretion: A Salinity Tolerance Mechanism among Five Zoysiagrass Species.” Crop Science 38: 806–810. doi:10.2135/cropsci1998.0011183X003800030031x.
- Marcum, K. B., and C. L. Murdoch. 1994. “Salinity Tolerance Mechanisms of Six C4 Turfgrasses.” Journal of the American Society for Horticultural Science 119: 779–784. doi:10.21273/JASHS.119.4.779.
- Marcum, K. B., and M. Pessarakli. 2006. “Salinity Tolerance and Salt Gland Excretion Efficiency of Bermudagrass Turf Cultivars.” Crop Science 46: 2571–2574. doi:10.2135/cropsci2006.01.0027.
- Møller, I. S., M. Gilliham, D. Jha, G. M. Mayo, S. J. Roy, J. C. Coates, J. Haseloff, and M. Tester. 2009. “Shoot Na+ Exclusion and Increased Salinity Tolerance Engineered by Cell Type–Specific Alteration of Na+ Transport in Arabidopsis.” The Plant Cell 21: 2163–2178. doi:10.1105/tpc.108.064568.
- Oi, T., K. Hirunagi, M. Taniguchi, and H. Miyake. 2013. “Salt Excretion from the Salt Glands in Rhodes Grass (Chloris Gayana Kunth) as Evidenced by Low-Vacuum Scanning Electron Microscopy.” Flora 208: 52–57. doi:10.1016/j.flora.2012.12.006.
- Oross, J. W., and W. W. Thomson. 1982. “The Ultrastructure of the Salt Glands of Cynodon and Distichlis (Poaceae).” American Journal of Botany 69: 939–949. doi:10.1002/j.1537-2197.1982.tb13337.x.
- Peng, Y., Y. Zhu, Y. Mao, S. Wang, W. Su, and Z. Tang. 2004. “Alkali Grass Resists Salt Stress through High K+ and an Endodermis Barrier to Na+.” Journal of Experimental Botany 55: 939–949. doi:10.1093/jxb/erh071.
- Perera, L. K. R. R., T. A. Mansfield, and A. J. C. Malloch. 1994. “Stomatal Responses to Sodium Ions in Aster Tripolium: A New Hypothesis to Explain Salinity Regulation in Above-Ground Tissues.” Plant, Cell & Environment 17: 335–340. doi:10.1111/j.1365-3040.1994.tb00300.x.
- Pollak, G., and Y. Waisel. 1979. “Ecophysiology of Salt Excretion in Aeluropus Litoralis (Graminae).” Physiologia Plantarum 47: 177–184. doi:10.1111/j.1399-3054.1979.tb06304.x.
- Ren, Z. H., J. P. Gao, L. G. Li, X. L. Cai, W. Huang, D. Y. Chao, M. Z. Zhu, Z. Y. Wang, S. Luan, and H. X. Lin. 2005. “A Rice Quantitative Trait Locus for Salt Tolerance Encodes A Sodium Transporter.” Nature Genetics 37: 1141–1146. doi:10.1038/ng1643.
- Rengasamy, P. 2010. “Soil Processes Affecting Crop Production in Salt-Affected Soils.” Functional Plant Biology : FPB 37: 613–620. doi:10.1071/FP09249.
- Robinson, M. F., A. Very, D. Sanders, and T. A. Mansfield. 1997. “How Can Stomata Contribute to Salt Tolerance?” Annals of Botany 80: 387–393. doi:10.1006/anbo.1996.0435.
- Singh, K., V. C. Pandey, and R. P. Singh. 2013. “Cynodon Dactylon: An Efficient Perennial Grass to Revegetate Sodic Lands.” Ecological Engineering 54: 32–38. doi:10.1016/j.ecoleng.2013.01.007.
- Song, X., S. Wang, and Y. Jiang. 2017. “Genotypic Variations in Plant Growth and Nutritional Elements of Perennial Ryegrass Accessions under Salinity Stress.” Journal of the American Society for Horticultural Science 142: 476–483. doi:10.21273/JASHS04258-17.
- Tanaka, H., S. Yamada, T. Masunaga, S. Yamamoto, W. Tsuji, and B. Murillo-Amador. 2018. “Comparison of Nutrient Uptake and Antioxidative Response among Four Labiatae Herb Species under Salt Stress Condition.” Journal of Soil Science and Plant Nutrition 64: 589–597. doi:10.1080/00380768.2018.1492334.
- Tang, J., X. Yu, N. Luo, F. Xiao, J. J. Camberato, and Y. Jiang. 2013. “Natural Variation of Salinity Response, Population Structure and Candidate Genes Associated with Salinity Tolerance in Perennial Ryegrass Accessions.” Plant, Cell & Environment 36: 2021–2033. doi:10.1111/pce.12112.
- Tran, V. T., F. Shu, H. E. Giles, and C. J. Lambrides. 2018. “Salinity Tolerance among a Large Range of Bermudagrasses (Cynodon Spp.) Relative to Other Halophytic and Non-Halophytic Perennial C4 Grasses.” Environmental and Experimental Botany 145: 121–129. doi:10.1016/j.envexpbot.2017.10.011.
- Véry, A., M. F. Robinson, T. A. Mansfield, and D. Sanders. 1998. “Guard Cell Cation Channels are Involved in Na+–Induced Stomatal Closure in a Halophyte.” The Plant Journal : for Cell and Molecular Biology 14: 509–521. doi:10.1046/j.1365-313X.1998.00147.x.
- Worku, W., and G. P. Chapman. 1998. “The Salt Secretion Physiology of Chloridoid Grass, Cynodon Dactylon (L.) Pers., And Its Implications.” SINET: Ethiopian Journal of Science 21: 1–16. doi:10.4314/sinet.v21i1.18108.
- Xiang, M., J. Q. Moss, D. L. Martin, K. Su, B. L. Dunn, and Y. Wu. 2017. “Evaluating the Salinity Tolerance of Clonal-Type Bermudagrass Cultivars and an Experimental Selection.” HortScience 52: 185–191. doi:10.21273/HORTSCI10773-16.
- Xiang, M., J. Q. Moss, D. L. Martin, and Y. Wu. 2018. “The Salinity Tolerance of Seeded-Type Common Bermudagrass Cultivars and Experimental Selections.” HortTechnology 28: 276–283. doi:10.21273/HORTTECH03975-18.
- Xie, Y., T. Ling, Y. Han, K. Liu, Q. Zheng, L. Huang, X. Yuan, et al. 2008. “Carbon Monoxide Enhances Salt Tolerance by Nitric Oxide-Mediated Maintenance of Ion Homeostasis and Up-Regulation of Antioxidant Defence in Wheat Seedling Roots.” Plant, Cell & Environment 31: 1864–1881. doi:10.1111/j.1365-3040.2008.01888.x.
- Yuan, F., B. Leng, and B. Wang. 2016. “Progress in Studying Salt Secretion from the Salt Glands in Recretohalophytes: How Do Plants Secrete Salt?” Frontiers in Plant Science 7: 977. doi:10.3389/fpls.2016.00977.