
 ?Mathematical formulae have been encoded as MathML and are displayed in this HTML version using MathJax in order to improve their display. Uncheck the box to turn MathJax off. This feature requires Javascript. Click on a formula to zoom.
ABSTRACT
In the present study, two volcanic ash soils (soil A and B) from a temperate broad-leaved forest in eastern Japan were aerobically incubated under repeated dry-wet cycles and continuously constant moisture conditions. The primary aims were to quantify the potential for enhancement of carbon dioxide (CO2) release owing to increased water fluctuation and to examine differences in the responses of volcanic ash soils with different physicochemical properties. Soil B, rather than soil A, was a typical Andosol. During incubation at 20°C for 120 days with five dry-wet cycles, the CO2 release rate was measured periodically. Abundance of the stable carbon isotope in CO2 (δ13C-CO2) was measured to capture changes in the origin of decomposed soil organic matter (SOM) owing to the dry-wet cycles. The CO2 release rate under the dry-wet cycles was up to 49% higher than the values predicted from a parabolic relationship between CO2 release and water content during incubation under the continuously constant moisture condition. The magnitude of CO2 release enhancement was 2.7-fold higher in soil B relative to that in soil A. The δ13C-CO2 value in the dry-wet cycles was enriched by 0.3–2.3‰ compared to that during incubation under the continuously constant moisture conditions, suggesting that the decomposition of well-metabolized and/or old SOM was enhanced by the dry-wet cycles. Thus, the present study suggests that Andosols, which have been believed to have a strong SOM stabilization ability, are vulnerable to dry-wet cycles. Then, increased water fluctuation in a future warmer world would have significant potential to stimulate CO2 release from soils.
1. Introduction
Microbial decomposition of soil organic matter (SOM) and the resulting release of carbon dioxide (CO2) from the soil to the atmosphere is a major component of the global carbon (C) cycle (Davidson, Belk, and Boone Citation1998; Davidson, Janssens, and Lou Citation2006; Luo et al. Citation2016; Sierra et al. Citation2015). The size of the soil C pool is estimated to be 2–3-fold greater than that of the atmospheric C pool (IPCC Citation2013), and therefore, even a small change in the size and decomposition rate of the soil C pool could significantly influence the atmospheric CO2 concentration and the global C cycle (Trumbore Citation2006).
Soil moisture, in addition to temperature, is a major environmental factor controlling SOM decomposition (Davidson, Belk, and Boone Citation1998; Davidson, Janssens, and Lou Citation2006; Luo et al. Citation2016; Sierra et al. Citation2015). In general, SOM decomposition and the consequent release of CO2 from soil respond parabolically to transitional changes in soil moisture, as follows (Sierra et al. Citation2015): Under low soil moisture conditions, SOM decomposition is suppressed via reduction of substrate availability and microbial activity. Under increased and optimized moisture conditions, substrate availability and microbial statuses are enhanced. However, microbial statuses and SOM decompositions are diminished by reduced oxygen diffusivity under excessively saturated soil moisture conditions. This parabolic relationship between SOM decomposition and soil moisture has been well documented and incorporated into a number of models simulating SOM decomposition and the global C cycle (Davidson, Belk, and Boone Citation1998; Davidson, Janssens, and Lou Citation2006; Luo et al. Citation2016; Sierra et al. Citation2015).
A further implication is, however, needed for capturing the soil CO2 release under dry-wet cycles (e.g. Birch Citation1958; Broken and Matzner, Citation2009; Kim et al. Citation2012). Rapid rewetting of dry soil is known to drastically enhance SOM decomposition and CO2 release, also called the ‘Birch effect’ (e.g. Birch Citation1958; Borken and Matzner Citation2009; Lee et al. Citation2004; Kim et al. Citation2012). According to a synthesis study of the effects of soil rewetting on soil gas flux (Kim et al. Citation2012), many field-based studies have shown that soil CO2 release immediately after rewetting is 1.5–110-fold greater than that before rewetting. The increased CO2 release rate decreases gradually along with soil moisture depletion by drying and approaches zero when the soil is dried completely (Kim et al. Citation2012). Quantification of the effects of the dry-wet cycle on soil CO2 release beyond the parabolic relationship between CO2 release and soil moisture is especially important for predicting the possible influence of soil CO2 release on climate change (Frank et al. Citation2015; Kim et al. Citation2012; Luo et al. Citation2016) because climate change affects the hydrologic cycle as well and causes large fluctuations in soil moisture conditions in many ecosystems through extended drought periods and increased precipitation intensity (IPCC Citation2013; Knapp et al., Citation2008).
Comparing the amounts of CO2 released under the dry-wet cycles and the continuously constant moisture conditions (Lee et al. Citation2002; Miller et al. Citation2005; Xiang et al. Citation2008) is a possible approach for quantifying potential underestimation of the continuously constant moisture-based prediction of soil CO2 release under increased water fluctuation. Through a comparison of the CO2 release models with and without consideration of soil water fluctuations, Lee et al. (Citation2002) estimated that the annual soil CO2 efflux in a cool temperate forest in central Japan increased by 16–22% owing to soil CO2 release during soil water fluctuations after rainfall. Using chaparral soils from semi-arid environments within the Elk Creek Watershed of Sequoia National Park, Miller et al. (Citation2005) reported that the amount of CO2 released from soils incubated under repeated dry-wet cycles was 2.2–3.7-fold greater than that from the soils maintained continuously at equivalent mean soil moisture. In an incubation experiment involving a surface soil from a California grassland, Xiang et al. (Citation2008) reported that soil CO2 release under dry-wet cycles was up to 50% greater than that under continuously constant moisture conditions.
Volcanic ash soils in Japanese temperate forests are among the soil types that should be paid more attention for the impact of increased water fluctuation on CO2 release. Large CO2 pulses after rainfall events have been observed in volcanic ash soils underlying Japanese forests (e.g. Lee et al. Citation2002; Liang et al. Citation2010; Teramoto et al. Citation2017 and 2018b). Soil water fluctuations in the Asian monsoon region, including the Japanese islands, have been increasing since the twentieth century owing to the decreased frequency and increased year-by-year variation of precipitation, accompanied by the progression of climate change (Endo et al. Citation2007). Moreover, a great potential for soil CO2 release under the upcoming warmed environments has been postulated for Japanese temperate forest soils (Teramoto et al. Citation2016, Citation2017, Citation2018) because the amount of carbon stored in the soils is estimated to be 70% greater than the global average (Morisada, Ono, and Kanomata Citation2004). Nevertheless, the impact of increased water fluctuation on soil CO2 release from volcanic ash soils in Japan has not been quantified extensively to date, except for a field-based study by Lee et al. (Citation2002).
In the present study, two volcanic ash soils from a temperate broad-leaved forest ecosystem in eastern Japan were incubated under repeated dry-wet cycles and continuously constant moisture conditions in order to answer the following questions:
To what extent do the repeated dry-wet cycles increase the amount of CO2 released from volcanic ash soils in comparison with the amount of CO2 released under the corresponding continuously moisture condition?
To what extent does the dry-wet-cycle-induced enhancement of CO2 release differ between two volcanic ash soils with different physicochemical properties?
Moreover, abundance of the stable carbon isotope in the CO2 (δ13C-CO2) released during the incubation was measured to gain insights into the mechanisms in force under increased soil water fluctuations (Unger et al. Citation2010, Citation2012).
2. Materials and methods
2.1. Soil sampling
Volcanic ash soils were collected from two locations (A and B) within a single water catchment of a temperate forest (36.9347° N, 140.5903° E) in eastern Japan (Mizoguchi et al., Citation2002; Nakashizuka and Matsumoto Citation2002; Suzuki Citation2002; Yoshinaga, Takahashi, and Aizawa Citation2002). This forest (103.51 ha) includes an experimental plot (6 ha) registered as a semi-core site in JaLTER (Ogawa forest, http://www.jalter.org/en/researchsites/ogawa/), while soil sampling in the present study was conducted in locations outside the JaLTER plot. Dominant trees at this forest include deciduous broad-leaved trees, such as Fagus crenata, Fagus japonica, and Quercus serrata (i.e. C3 vegetation). This forest is an old secondary forest without significant disturbance since the Meiji era (ca. 150 years ago). Before the Meiji era, this area was dominated with Poaceae grasslands (i.e. C4 vegetation) with artificial fires for agricultural purposes (Suzuki Citation2002). Mean annual temperature and precipitation are 11°C and 1900 mm, respectively. The highest and lowest monthly temperatures (28 and −5°C) are usually observed in August and January, respectively. The maximum monthly precipitation (340 mm) is observed in August. The soils in the region have been affected greatly by volcanic ash, mainly from the Abukuma mountains expanding over a large northern area of the forest, while soil characteristics in this forest is very heterogeneous in terms of specific landforms and amounts of volcanic ash. Most of the surface soils in this forest have Andic properties, which imply a substantial contribution of volcanic ash to the parent material of the soils. Detailed information related to this forest is available in Mizoguchi et al. (Citation2002), Yoshinaga, Takahashi, and Aizawa (Citation2002), Suzuki (Citation2002), and other chapters in a book by Nakashizuka and Matsumoto (Citation2002).
Soil sampling was conducted on 13 September 2017. The distance between locations A and B was 130 m across a small valley. Both locations were on ridges. At each location, four soil core samples were collected at depths of 0–20 cm after removing forest-floor organic (i.e. litter) layers (Koarashi et al. Citation2009). The collected soil core samples were transferred to the lab within a day and were stored subsequently at 4°C.
2.2. Preparation of soil samples
Four soil core samples per location were well mixed with gloved hands and gently passed through a 2-mm sieve for removing gravel and plant tissues. Fine roots were then removed from the sieved samples by using tweezers. The pretreated soils were air-dried for 4 weeks at room temperature to achieve the soil water content of 5% or less of water-holding capacity (hereinafter % WHC). These air-dried soils (hereinafter soil A and soil B) were used for further analysis and incubation experiments.
2.3. Analysis of soil property
The analyzed fundamental properties of the soil samples were pH (H2O), size distributions of mineral particles, water-holding capacity (i.e. WHC), total carbon (C) and nitrogen (N) contents, stable isotope abundances of C and N (δ13C and δ15N), and phosphate absorption coefficient (). The pH (H2O) was measured for a soil and water mixture consisting of 1 g soil and 2.5 mL water. The size distribution of mineral particles (clay, silt, and sand with diameters of <2, 2–50, and >50 μm, respectively) was determined using the Stokes’ law-based sedimentation method (Miller, Radcliffe, and Miller Citation1988; Nakai Citation1997). The WHC was determined from the difference in soil weight before and after water saturation. Soil total C and N contents, as well as their δ13C and δ15N values, were measured for well-grinded soil samples by using an isotope ratio mass spectrometer (IsoPrime 100, Elementar, Manchester, UK) equipped with an elemental analyzer (vario PYRO cube, Elementar) (Muto et al. Citation2017). The phosphate absorption coefficient was determined by placing soils in 13.44 g P2O5 L−1 phosphate ammonium solution for 24 h (Nanzyo Citation1997). A soil with a phosphate absorption coefficient greater than 15 mg P2O5 g−1 dry soil is generally recognized as an Andosol, a typical volcanic ash soil (Obara et al. Citation2015). These physicochemical properties of two soils are summarized in . Of the two volcanic ash soils considered in the present study, soil B was recognized as a typical Andosol owing to its higher values of fine mineral particle content, WHC, total carbon content, and phosphate absorption ability ().
Table 1. Fundamental properties of volcanic ash soils used in incubation experiment
2.4. Incubation experiment
Six mason jars (1.0 L volume, Ball, NY, USA) (five for continuously constant moisture conditions and one for the repeated dry-wet cycles) containing soil samples were prepared for individual volcanic ash soils. The lids of these jars were equipped with tube fitting systems for gas sample collection (Koarashi et al. Citation2012). The amount of soil sample in a jar was 68 g for soil A and 47 g for soil B to achieve the same drying duration for the same moisture condition. Water was added to four of the five jars prepared for the continuously constant moisture conditions, and the soil moisture conditions were adjusted to 20%, 40%, 60%, and 80% WHC, respectively. No water was added to the remaining jars to maintain the soil moisture condition of <5% WHC. The jar prepared for the repeated dry-wet cycles was initially adjusted to 40% WHC. All jars were flushed with CO2-free air for 15 min at a rate of 0.5 L min−1, and they were then pre-incubated at 20°C for a week. Two replicates of each of the six treatments were prepared for the two volcanic ash soils; thus, a total of 24 jars were prepared for the incubation experiment.
The soils were aerobically incubated under repeated dry-wet cycles and continuously constant moisture conditions at 20°C for 120 days after 1-week of pre-incubation and re-flushing of the jars with CO2-free air (). The lid of the jar for repeated dry-wet cycles was removed to start drying the soil to <5% WHC. After 7 days, the jar subjected to repeated dry-wet cycles was flushed with CO2-free air and sealed with the lid for measurements of the CO2 release rate and δ13C-CO2. On day 14 of incubation, 15 mL of gas sample from the jar was collected using a 20 mL plastic syringe (Terumo, Kyoto, Japan), and the collected sample was stored in a 5 mL vacuumed glass vial (SVG−5, Nichiden Rika, Osaka, Japan). Thereafter, water was added to the jar to rewet the soil to 80% WHC; the jar was flushed with CO2-free air and sealed with the lid. On day 17 of incubation, a gas sample was collected from the sealed jar and stored in the same manner as before. Then, the lid of the jar was removed to start drying the soil again. On day 20 of incubation, the jar was flushed and sealed, and on day 24 of incubation, a gas sample was collected and stored for CO2 measurement under a moderate moisture condition. This 24-day cycle was repeated five times. Soil water content during the repeated dry-wet cycles was measured on days 1, 3, 7, 14, 17, and 20 of incubation in each of the cycles.
Figure 1. Schematic time course of soil moisture during incubations with repeated dry wet cycles (a) and continuously constant moisture conditions (b). Gas samples from the gas collection periods in the wet and the moderate conditions were also applied to the analysis of stable carbon isotope abundances in CO2 (δ13C-CO2) released during the period
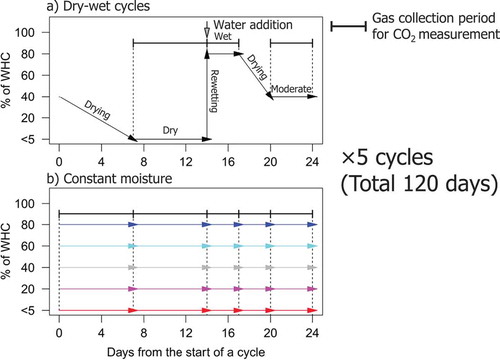
The jars prepared for the continuously constant moisture incubation were continuously sealed with lids to maintain the moisture level, except the case of flushing with CO2-free air after gas sample collection (). Gas sample collections from the jars under continuously constant moisture incubation were conducted on days 7, 14, 17, 20, and 24 of incubation of the corresponding 24-day cycles.
2.5. CO2 release rate
In the present study, soil CO2 release rate was expressed as the amount of carbon in the CO2 released from 1 g dry-weight equivalent soil in a day (i.e. in μg C g−1 dry soil day−1). The CO2 concentration in the gas samples was measured using a gas chromatograph (GC-2014, Shimadzu, Kyoto, Japan) equipped with a thermal conductivity detector. The CO2 release rate was determined as an average rate during the period of sealing the jars, using the increase in the CO2 concentration during the period. For the repeated dry-wet treatment, the CO2 release rate during the drying periods (i.e. days 1−7 and days 17−20 of incubation in each cycle) could not be measured because the jars were opened; therefore, it was estimated as the mean value of the CO2 release rates measured before and after the period of interest.
The relationship between the CO2 release rate and % WHC level under the continuously constant moisture conditions was fitted to a parabolic curve with nonlinear regression. Nonlinear regression was executed using the nls function in CRAN R software (ver. 3.2, R Core Team Citation2017). The fitted parabolic curve was used to predict the CO2 release rate under a water content equivalent to the durational mean % WHC during the repeated dry-wet cycles. Fitting of the parabolic curve and estimation of the CO2 release rate was conducted for the individual 24-day cycles and the total 120-day incubation period. The CO2 release rates predicted in this way were then compared with the CO2 release rates measured during the repeated dry-wet cycles.
The deviation (hereafter referred to as [dCO2]) of the measured CO2 release rate from the predicted rate was evaluated for each cycle. The mean values of [dCO2] obtained for the two volcanic ash soils were compared by conducting a pairwise t-test by using the t.test function in CRAN R software (n = 5 per a soil type per a water treatment). The [dCO2] normalized by the content of soil organic carbon (SOC) was determined as a proxy for substrate carbon availability in the soils and was compared between the two soils in the same manner as before.
2.6. δ13C-CO2
The abundance of stable carbon isotope in the released CO2 (δ13C-CO2) was measured using an IsoPrime 100 (Elementar) equipped with a Multiflow prep-system (Elementar). The analysis of δ13C-CO2 data was conducted for the wettest condition after rewetting (i.e. around 80% WHC) and the moderately wet condition by re-drying (i.e. around 40% WHC) because of the sizeable contributions (around 50% each) of these two conditions to total CO2 release during the incubation (with a negligible contribution (around 1%) of the driest condition (i.e. <5% WHC)). The precision of repeated measurements of δ13C-CO2 was 0.1‰.
A two-way ANOVA test using the aov function in CRAN R software was applied to compare the δ13C-CO2 values across soil types (i.e. soil A vs. soil B) and water treatments (i.e. dry-wet vs. continuously constant moisture) (n = 5 per a soil type per a water treatment). The comparison of δ13C-CO2 was conducted separately for the wettest condition (80% WHC) and for the moderately wet condition (40% WHC). In the moderately wet condition, we calculated the δ13C-CO2 values for the continuously constant moisture conditions having soil water contents equivalent to that under the repeated dry-wet cycles. The measured δ13C-CO2 values under the continuously constant moisture conditions of 20%, 40%, and 60% WHC were used for the calculation of corresponding δ13C-CO2. If the mean water content in the repeated dry-wet cycle (WDW) was 40% WHC or lower, the following equation was solved for parameter a:
Then, δ13C-CO2 values under the continuously constant moisture condition with the equivalent water content (d13const) were calculated as follows:
where d1340cont and d1320const denote the δ13C-CO2 values for 40% and 20% WHC under the continuously constant moisture conditions. In cases where WDW was greater than 40% WHC, equation 1 was modified as follows:
Then, d13const was determined as follows:
where d1360const denotes the δ13C-CO2 value for 60% WHC under the continuously constant moisture condition.
3. Results
3.1. CO2 release rates
Under the repeated dry-wet cycles, the CO2 release rates of both volcanic ash soils were observed to fluctuate along the dry-wet cycles; the rates decreased as the soils were dried and increased dramatically after re-wetting (). The initial water content was 44 ± 6% WHC (mean ± standard deviation), and it decreased to 3 ± 1% WHC by day 7 of incubation. The CO2 release rates of the soils under the dried conditions were <1 μg C g−1 dry soil day−1. After rewetting of the soils to 80 ± 1% WHC, their CO2 release rates increased to 20 − 39 μg C g−1 dry soil day−1 (range for all five cycles) for soil A and 30 − 65 μg C g−1 dry soil day−1 for soil B. These increases in the CO2 release rates were observed consistently over all five dry-wet cycles. Then, the soils were dried again. Under moderate moisture conditions (47 ± 7% WHC) in the middle of the drying processes, the CO2 release rates were 14 − 23 μg C g−1 dry soil day−1 for soil A and 16 − 28 μg C g−1 dry soil day−1 for soil B. During incubation, the average moisture level for the individual dry-wet cycle periods (24 days) was estimated to be 29 − 35% WHC. The average moisture level for the entire incubation period (120 days with five dry-wet cycles) was 33 ± 1% WHC for both soils.
Figure 2. Time course of soil CO2 release rates during 120-day incubation with repeated dry-wet cycles and continuously constant moisture conditions. Two volcanic ash soils (soils A and B) collected from a single water catchment in a Japanese temperate forest were incubated individually with six different soil moisture treatments (i.e. dry-wet cycle (D-W) and five different levels of constant moisture from <5% to 80% of water-holding capacity (hereinafter abbreviated as % WHC)). The time course of % WHC during incubation with dry-wet cycles is shown by dashed lines. The experiment was conducted with two replicates per soil per treatment. The circles and error bars are means and standard deviations of the measured CO2 release rates for the two replicate samples
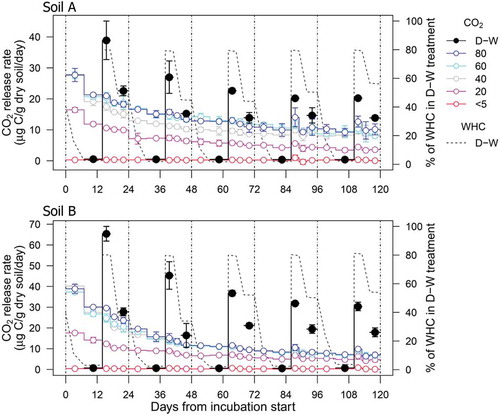
The CO2 release rates of the soils under the continuously moist conditions varied depending on the WHC levels, from <1 μg C g−1 dry soil day−1 (observed under the most dried conditions of <5% WHC) to 40 μg C g−1 dry soil day−1 (observed under the 40% WHC condition for soil B at the start of incubation), and they generally decreased with time (). The dependency of the CO2 release rate on soil moisture was well represented by a parabolic curve for each of the five periods corresponding to the dry-wet cycles ().
Figure 3. Relationships between CO2 release rate and % WHC for soils A and soil B incubated with five levels of constant soil moisture conditions. The soil CO2 release under the constant moisture conditions were fitted to the parabolic curves as a function of % WHC. The determined curves are presented with 95% confidence intervals (solid lines for soil A, dashed lines for soil B). The circles and error bars are means and standard deviations of the measured CO2 release rates for the two replicate samples
The measured CO2 release rates of the soils under the repeated dry-wet cycles were up to 1.5 times greater than those predicted values assuming the corresponding constant moisture condition (33% WHC) for the same period (), which was evaluated based on the parabolic curves in . A larger increase in the CO2 release rate due to the repeated dry-wet cycles was observed for soil B (49%) compared with soil A (18%).
Table 2. Summary of measured and predicted CO2 release rates for incubation under repeated dry-wet cycles
In the five dry-wet cycles, the difference ([dCO2]) between the measured and predicted (for the corresponding constant moisture content) CO2 release rates were 1.4 − 2.3 μg C g−1 dry soil day−1 for soil A and 5.3 − 6.9 μg C g−1 dry soil day−1 for soil B (), and the difference was significantly larger (p < 0.01, n = 5 per a soil type per a water treatment) for soil B than for soil A. The [dCO2] normalized by SOC was 0.02 − 0.03 μg C mg−1 SOC day−1 for soil A and 0.04–0.05 μg C mg−1 SOC day−1 for soil B, and it was significantly larger (p < 0.01, n = 5) for soil B than for soil A. Thus, the repeated dry-wet cycles had a greater influence on the CO2 release rate and substrate availability of soil B compared with those of soil A.
Figure 4. Deviation of measured CO2 release from predicted CO2 release ([dCO2]) for soils A and B incubated with repeated dry-wet cycles. Upper panel (a) shows [dCO2], and lower panel (b) shows [dCO2] normalized by soil organic C content (i.e. 89 and 134 mg C g−1 dry soil for soils A and B, respectively, as in ). The predicted CO2 release rates were computed using the parabolic curves shown in . The circles and error bars from cycle 1 to cycle 5 are means and standard deviations for two replicate samples. The circles and error bars for all cycles are means and standard deviations for five cycles. The statistically significant probability (p by pair-wised t-test, n = 5 per a soil type per a water treatment) for differences between two soils are presented
![Figure 4. Deviation of measured CO2 release from predicted CO2 release ([dCO2]) for soils A and B incubated with repeated dry-wet cycles. Upper panel (a) shows [dCO2], and lower panel (b) shows [dCO2] normalized by soil organic C content (i.e. 89 and 134 mg C g−1 dry soil for soils A and B, respectively, as in Table 1). The predicted CO2 release rates were computed using the parabolic curves shown in Figure 3. The circles and error bars from cycle 1 to cycle 5 are means and standard deviations for two replicate samples. The circles and error bars for all cycles are means and standard deviations for five cycles. The statistically significant probability (p by pair-wised t-test, n = 5 per a soil type per a water treatment) for differences between two soils are presented](/cms/asset/41b6f781-9f5d-4038-bd12-c31666df1fd2/tssp_a_1649976_f0004_b.gif)
3.2. δ13C-CO2
The CO2 released from the soils under the repeated dry-wet cycles was enriched with 13C by 0.3–2.3 ‰ compared with that released from the soils under the constant moisture conditions (). The differences in the δ13C-CO2 values between the two treatments were statistically significant (p < 0.01, n = 5, per a soil type per a water treatment) at every stage of the dry-wet cycle. When the soils reached the wettest conditions owing to rewetting, δ13C-CO2 for the repeated dry-wet cycles was enriched to −25.5 and −24.8‰ for soils A and B, respectively. Under the moderate moisture conditions caused by drying, the values of δ13C-CO2 were −25.8 and −25.0‰ for soils A and B, respectively, and these values were similar to those under the wettest conditions. The difference in δ13C-CO2 enrichment between the two volcanic ash soils was negligible because the interactions between soil types and water treatments were not statistically significant (p = 0.27 or greater, n = 5) while the differences in δ13C-CO2 values between the two soils were significant (p < 0.01, n = 5).
Figure 5. δ13C-CO2 during the incubations with repeated dry-wet cycles and continuously constant moisture conditions. δ13C-CO2 values are presented separately for the wettest condition (a) and the moderately wet condition (b). In the moderately wet condition, δ13C-CO2 for constant soil moisture are values estimated for soil moisture levels of dry-wet cycle incubation using δ13C-CO2 data obtained under constant soil moisture incubation with 20%, 40%, and 60% WHC (see text for details). The points (triangles and circles) and error bars for all cycles are means and standard deviations for five cycles. The statistically significant probability (p by two-way ANOVA, n = 5 per a soil type per a water treatment) for water treatment (W), soil (S), and their interactions (W × S) are presented. Triangles and circles represent the continuously constant moisture conditions and the repeated dry-wet cycles, respectively
4. Discussion
A comparison of the CO2 release rates between the dry-wet cycle and constant moisture treatments ( and ) showed that the repeated dry-wet cycles increased the microbial decomposition of SOM in both the tested volcanic ash soils. Thus, evaluation of the CO2 release rate based on its dependency on soil moisture under the continuously moist conditions, which is usually employed in current soil C dynamic models, underestimates the real CO2 release rates under the repeated dry-wet cycle situations. The enhancement of CO2 release rates (18% and 49%) induced by the repeated dry-wet cycles in the present study were comparable with the post-rainfall enhancement observed for CO2 efflux from a volcanic ash soil in a temperate forest in central Japan (16–21%, Lee et al. Citation2002). A similar magnitude of the dry-wet effect on CO2 release was observed for a California grassland soil in a laboratory incubation experiment (Xiang et al. Citation2008). By contrast, Miller et al. (Citation2005) reported a larger increase (120–270%) in the CO2 release rate of chaparral soils in semi-arid environments owing to episodic rewetting.
The δ13C-CO2 enrichment under the dry-wet cycles compared with that under the constant moisture conditions () suggested that well-metabolized and/or older SOM was decomposed preferentially during the dry-wet cycles compared with the constant moisture condition. A possible origin of the 13C-enriched SOM was C4 grass-derived SOM (labeled with δ13C value of around −14‰), which is expected to be aged 150 years or older than C3 plant-derived SOM (labeled with δ13C value of around −28‰) based on the succession history from C4 grass to the current C3 species in this forest (Suzuki Citation2002). Another possible origin is microbially metabolized SOM, which is known to be abundant in 13C owing to isotope fractionation during metabolization (e.g. Cotrufo, Drake, and Ehleringer Citation2005; Werth and Kuzyakov Citation2010; Unger et al. Citation2012). The metabolized SOM tends to be less bioavailable and can be stored in soils longer than less-metabolized SOM (Lützow et al. Citation2006; Six et al. Citation2002; Wagai et al. Citation2018). The shift toward old SOM decomposition was observed by Schimel et al. (Citation2011), who used radiocarbon to show that repeated dry-wet cycles promoted the release of old SOM from a California grassland soil. However, further investigations on the ages, metabolized levels, and degradability of SOM that was decomposed under the dry-wet cycle conditions are still needed to fully understand the response of SOM decomposition to dry-wet cycles.
There are two possible mechanisms to explain the release of well-metabolized and/or old SOM under repeated dry-wet cycles. One is that the dry-wet cycles disrupt weak aggregates and make available previously protected SOM to microbes (Denef et al. Citation2001; Fierer and Schimel Citation2003; Xiang et al. Citation2008). Another mechanism is that the rewetting-induced bulk movement of water through the soil desorbs and redistributes SOM, making it available to microbes (Xiang et al. Citation2008). These mechanisms have been postulated previously for non-volcanic ash soils. Our results demonstrate that the well-metabolized and/or old SOM decomposition stimulated by such mechanisms is possible under dry-wet cycles, even for volcanic ash soils, while further analysis is needed for definitive understanding of the mechanisms underlying the large CO2 pulse after rewetting.
The finding of the present study that soil B is more vulnerable to dry-wet cycles than soil A was slightly surprising because the SOM in soil B, a typical Andosol, was expected to be highly stabilized owing to interactions with soil minerals (Shoji, Nanzyo, and Dahlgren Citation1993; Imaya et al. Citation2007; Asano and Wagai Citation2014; Wagai et al. Citation2018). In soil B, the dry-wet cycles increased the CO2 release rate by 49%. The magnitude of CO2 release enhancement was equivalent to the maximum warming effect on soil CO2 efflux (50% increase by 2°C warming) observed for other volcanic ash soils in Japanese temperate forests (Teramoto et al. Citation2016, Citation2017, Citation2018). Thus, the inferred vulnerability of the Andosol against the dry-wet cycles implies that simultaneous increases in temperature and water fluctuation in the future can double the CO2 release rate, even for soils with high carbon storage capabilities.
Changes in decomposing organic substrates in soils are possible over the incubation period, which may bring an uncertainty in quantifying the dry-wet-cycle-induced enhancement of soil CO2 release in the present study. Changes in carbon substrates available for soil microbes are likely to be more rapid under incubation experiment conditions (without any input of bioavailable organic substrates) than under field conditions where vegetation continuously supplies fresh organic materials to the soil. In the present study, it was found that CO2 release rate and δ13C-CO2 decreased over the incubation period especially under the continuously constant moisture conditions ( and ). Thus, the quantity and quality of substrates available for microbes in soils might have changed over the incubation period even in the same treatment. Therefore, a field-based examination for assessing the impact of increased water fluctuation on soil CO2 release is also needed in conjunction with the laboratory experiment, in order to gain a more reliable insight into vulnerability of volcanic ash soils against the increased water fluctuations.
Table 3. Statistical significance of linear relationship between δ13C-CO2 and incubation cycles 1 − 5 (n = 5)
Acknowledgments
The authors thank T. Ishii, M. Kaminaga, K. Yoshigaki, and M. Ohta for support with the laboratory work. The authors also thank the Ibaraki District Forest Office for granting permission to use the Ogawa Forest Reserve site.
Disclosure statement
No potential conflict of interest was reported by the authors.
Additional information
Funding
References
- Asano, M., and R. Wagai. 2014. “Evidence of Aggregate Hierarchy at Micro- to Submicron Scales in an Allophanic Andisol.” Geoderma 216: 62–74. doi:10.1016/j.geoderma.2013.10.005.
- Birch, H. F. 1958. “The Effect of Soil Drying on Humus Decomposition and Nitrogen Availability.” Plant and Soil 10: 9–31. doi:10.1007/BF01343734.
- Borken, W., and E. Matzner. 2009. “Reappraisal of Drying and Wetting Effects on C and N Mineralization and Fluxes in Soils.” Global Change Biology 15: 808–824. doi:10.1111/j.1365-2486.2008.01681.x.
- Cotrufo, M. F., B. Drake, and J. R. Ehleringer. 2005. “Palatability Trials on Hardwood Leaf Litter Grown under Elevated CO2: A Stable Carbon Isotope Study.” Soil Biology & Biochemistry 37: 1105–1112. doi:10.1016/j.soilbio.2004.11.009.
- Davidson, E. A., E. Belk, and R. D. Boone. 1998. “Soil Water Content and Temperature as Independent or Confounded Factors Controlling Soil Respiration in a Temperate Mixed Hardwood Forest.” Global Change Biology 4: 217–227. doi:10.1046/j.1365-2486.1998.00128.x.
- Davidson, E. A., I. A. Janssens, and Y. Lou. 2006. “On the Variability of Respiration in Terrestrial Ecosystems: Moving beyond Q10.” Global Change Biology 12: 154–164. doi:10.1111/j.1365-2486.2005.01065.x.
- Denef, K., J. Six, H. Bossuyt, S. D. Frey, E. T. Elliott, R. Merckx, and K. Paustian. 2001. “Influence of Dry-wet Cycles on the Interrelationship between Aggregate, Particulate Organic Matter, and Microbial Community Dynamics.” Soil Biology & Biochemistry 33: 1599–1611. doi:10.1016/S0038-0717(01)00076-1.
- Endo, N., J. Matsumoto, N. Yamamoto, A. Fukushima, and I. Akasaka. 2007. “Recent Changes of Precipitation Amount and Its Characteristics in the World.” Journal of Geography (chigaku Zasshi) 116: 824–835. doi:10.5026/jgeography.116.6_824.
- Fierer, N., and J. P. Schimel. 2003. “A Proposed Mechanism for the Pulse in Carbon Dioxide Production Commonly Observed following the Rapid Rewetting of A Dry Soil.” Soil Science Society of America Journal 67: 798. doi:10.2136/sssaj2003.0798.
- Frank, D., M. Reichstein, M. Bahn, K. Thonicke, D. Frank, M. D. Mahecha, P. Smith, et al. 2015. “Effects of Climate Extremes on the Terrestrial Carbon Cycle: Concepts, Processes and Potential Future Impacts.” Global Change Biology 21: 2861–2880. doi:10.1111/gcb.12916.
- Imaya, A., Y. Inagaki, N. Tanaka, and S. Ohta. 2007. “Free Oxides and Short-range Ordered Mineral Properties of Brown Forest Soils Developed from Different Parent Materials in the Submontane Zone of the Kanto and Chubu Districts, Japan.” Soil Science and Plant Nutrition 53: 621–633. doi:10.1111/j.1747-0765.2007.00175.x.
- IPCC. 2013. Climate Change 2013: The Physical Science Basis. Contribution of Working Group I to the Fifth Assessment Report of the Intergovernmental Panel on Climate Change. T. F. Stocker, D. Qin, G.-K. Plattner, M.M.B. Tignor, S.K. Allen, J. Boschung, A. Nauels, et al. eds. New York, NY: Cambridge University Press.
- Kim, D. G., R. Vargas, B. Bond-Lamberty, and M. R. Turetsky. 2012. “Effects of Soil Rewetting and Thawing on Soil Gas Fluxes: A Review of Current Literature and Suggestions for Future Research.” Biogeosciences 9: 2459–2483. doi:10.5194/bg-9-2459-2012.
- Knapp, A.K., C. Beier, D.D. Briske, A.T. Classen, Y. Luo, M. Reichstein, M.D. Smith, et al. 2008. “Consequences of More Extreme Precipitation Regimes for Terrestrial Ecosystems.” Bioscience 58 :811–821. doi: 10.1641/B580908.
- Koarashi, J., M. Atarashi-Andoh, S. Ishizuka, S. Miura, T. Saito, and K. Hirai. 2009. “Quantitative Aspects of Heterogeneity in Soil Organic Matter Dynamics in A Cool-temperate Japanese Beech Forest: A Radiocarbon-based Approach.” Global Change Biology 15: 631–642. doi:10.1111/j.1365-2486.2008.01745.x.
- Koarashi, J., W. C. Hockaday, C. A. Masiello, and S. E. Trumbore. 2012. “Dynamics of Decadally Cycling Carbon in Subsurface Soils.” Journal of Geophysical Research Biogeosciences 117: 1–13. doi:10.1029/2012JG002034.
- Lee, M., K. Nakane, T. Nakatsubo, W. Mo, and H. Koizumi. 2002. “Effects of Rainfall Events on Soil CO2 Flux in a Cool Temperate Deciduous Broad-leaved Forest.” Ecological Research 17: 401–409. doi:10.1046/j.1440-1703.2002.00498.x.
- Lee, X., H. J. Wu, J. Sigler, C. Oishi, and T. Siccama. 2004. “Rapid and Transient Response of Soil Respiration to Rain.” Global Change Biology 10: 1017–1026. doi:10.1111/j.1365-2486.2004.00787.x.
- Liang, N., T. Hirano, Z. M. Zheng, J. Tang, and Y. Fujinuma. 2010. “Soil CO2 Efflux of a Larch Forest in Northern Japan.” Biogeosciences 7: 3447–3457. doi:10.5194/bg-7-3447-2010.
- Luo, Y., A. Ahlström, S. D. Allison, N. H. Batjes, V. Brovkin, N. Carvalhais, A. Chappell, et al. 2016. “Toward More Realistic Projections of Soil Carbon Dynamics by Earth System Models.” Global Biogeochemical Cycles 30: 40–56. doi:10.1002/2015GB005239.
- Lützow, M. V., I. Kögel-Knabner, K. Ekschmitt, E. Matzner, G. Guggenberger, B. Marschner, and H. Flessa. 2006. “Stabilization of Organic Matter in Temperate Soils: Mechanisms and Their Relevance under Different Soil Conditions - A Review.” European Journal of Soil Science 57: 426–445. doi:10.1111/j.1365-2389.2006.00809.x.
- Miller, A. E., J. P. Schimel, T. Meixner, J. O. Sickman, and J. M. Melack. 2005. “Episodic Rewetting Enhances Carbon and Nitrogen Release from Chaparral Soils.” Soil Biology & Biochemistry 37: 2195–2204. doi:10.1016/j.soilbio.2005.03.021.
- Miller, W. P., D. E. Radcliffe, and D. M. Miller. 1988. “An Historical Perspective on the Theory and Practice of Soil Mechanical Analysis.” Journal of Agronomy Education 17: 24–28.
- Moriguchi, Y., T. Morishita, and Y. Ohtani. 2002. “Climate in Ogawa Forest Reserve.” In Diversity and Interaction in a Temperate Forest Community – Ogawa Forest Reserve of Japan, edited by T. Nakashizuka, Y. Matsumoto, 11–18. Springer, Tokyo. doi:10.1007/978-4-431-67879-3_2.
- Morisada, K., K. Ono, and H. Kanomata. 2004. “Organic Carbon Stock in Forest Soils in Japan.” Geoderma 119: 21–32. doi:10.1016/S0016-7061(03)00220-9.
- Muto, K., M. Atarashi-Andoh, J. Koarashi, E. Takeuchi, S. Nishimura, K. Tsuduki, and T. Matsunaga. 2017. “Sources of 137cs Fluvial Export from a Forest Catchment Evaluated by Stable Carbon and Nitrogen Isotopic Characterization of Organic Matter.” Journal of Radioanalytical and Nuclear Chemistry 314: 403–411. doi:10.1007/s10967-017-5350-7.
- Nakai, M. 1997. “Soil Particle Distribution [the Pipette Method].” Dojo-Kankyo-Bunseki-Ho (analytical Methods for Soil Environment), Ed. Editorial Committee for Analytical Methods for Soil Environment, 24–29. Tokyo: Hakuyusha.
- Nakashizuka, T., and Y. Matsumoto. 2002. “Diversity and Interaction in a Temperate Forest Community: Ogawa Forest Reserve of Japan.” Tokyo, Japan: Springer Japan.
- Nanzyo, M. 1997. “Phosphate Absorption Coefficient.” In Dojo-Kankyo-Bunseki-Ho (analytical Methods for Soil Environment), Ed. Editorial Committee for Analytical Methods for Soil Environment. 262–267. Tokyo: Hakuyusya.
- Obara, H., Y. Maejima, K. Kohyama, T. Ohkura, and Y. Takata. 2015. “Outline of the Comprehensive Soil Classification System of Japan - First Approximation.” Japan Agricultural Research Quarterly 49: 217–226. doi:10.6090/jarq.49.217.
- R Core Team. 2017. “R: A Language and Environment for Statistical Computing.” Vienna, Austria. https://www.r-project.org/.
- Schimel, J. P., J. Å. M. Wetterstedt, P. A. Holden, and S. E. Trumbore. 2011. “Drying/rewetting Cycles Mobilize Old C from Deep Soils from a California Annual Grassland.” Soil Biology & Biochemistry 43: 1101–1103. doi:10.1016/j.soilbio.2011.01.008.
- Shoji, S., M. Nanzyo, and R. A. Dahlgren. 1993. Volcanic Ash Soils: Genessi, Properties and Utilization. New York, US: Elsevier.
- Sierra, C. A., S. E. Trumbore, E. A. Davidson, S. Vicca, and I. Janssens. 2015. “Sensitivity of Decomposition Rates of Soil Organic Matter with respect to Simultaneous Changes in Temperature and Moisture.” Journal of Advances in Modeling Earth Systems 7: 335–356. doi:10.1002/2014MS000358.
- Six, J., R. T. Conant, E. A. Paul, and K. Paustian. 2002. “Stabilization Mechanisms of Soil Organic Matter: Implications for C-saturation of Soils.” Plant and Soil 241: 155–176. doi:10.1023/A:1016125726789.
- Suzuki, W. 2002. “Forest Vegetation in and around Ogawa Forest Reserve in Relation to Human Impact.” In Diversity and Interaction in a Temperate Forest Community – Ogawa Forest Reserve of Japan, 27–42. Tokyo: Springer. doi:10.1007/978-4-431-67879-3_4.
- Teramoto, M., N. Liang, J. Zeng, N. Saigusa, and Y. Takahashi. 2017. “Long-term Chamber Measurements Reveal Strong Impacts of Soil Temperature on Seasonal and Inter-annual Variation in Understory CO2 Fluxes in a Japanese Larch (larix Kaempferi Sarg.) Forest.” Agricultural and Forest Meteorology 247: 194–206. doi:10.1016/j.agrformet.2017.07.024.
- Teramoto, M., N. Liang, M. Takagi, J. Zeng, and J. Grace. 2016. “Sustained Acceleration of Soil Carbon Decomposition Observed in a 6-year Warming Experiment in a Warm Temperate Forest in Southern Japan.” Scientific Reports 6: 35563. doi:10.1038/srep35563.
- Teramoto, M., N. Liang, S. Ishida, and J. Zeng. 2018. “Long-term Stimulatory Warming Effect on Soil Heterotrophic Respiration in a Cool-temperate Broad-leaved Deciduous Forest in Northern Japan.” Journal of Geophysical Research Biogeosciences 123: 1161–1177. doi:10.1002/2018JG004432.
- Trumbore, S. 2006. “Carbon Respired by Terrestrial Ecosystems - Recent Progress and Challenges.” Global Change Biology 12: 141–153. doi:10.1111/j.1365-2486.2006.01067.x.
- Unger, S., C. Máguas, J. S. Pereira, T. S. David, and C. Werner. 2010. “The Influence of Precipitation Pulses on Soil Respiration - Assessing the ‘ Birch Effect’ by Stable Carbon Isotopes.” Soil Biology & Biochemistry 42: 1800–1810. doi:10.1016/j.soilbio.2010.06.019.
- Unger, S., C. Máguas, J. S. Pereira, T. S. David, and C. Werner. 2012. “Interpreting Post-drought Rewetting Effects on Soil and Ecosystem Carbon Dynamics in a Mediterranean Oak Savannah.” Agricultural and Forest Meteorology 154–155. doi:10.1016/j.agrformet.2011.10.007.
- Wagai, R., M. Kajiura, M. Uchida, and M. Asano. 2018. “Distinctive Roles of Two Aggregate Binding Agents in Allophanic Andisols: Young Carbon and Poorly-crystalline Metal Phases with Old Carbon.” Soil Systems 2: 29. doi:10.3390/soilsystems2020029.
- Werth, M., and Y. Kuzyakov. 2010. “13C Fractionation at the Root-microorganisms-soil Interface: A Review and Outlook for Partitioning Studies.” Soil Biology & Biochemistry 42: 1372–1384. doi:10.1016/j.soilbio.2010.04.009.
- Xiang, S. R., A. Doyle, P. A. Holden, and J. P. Schimel. 2008. “Drying and Rewetting Effects on C and N Mineralization and Microbial Activity in Surface and Subsurface California Grassland Soils.” Soil Biology & Biochemistry 40: 2281–2289. doi:10.1016/j.soilbio.2008.05.004.
- Yoshinaga, S., M. Takahashi, and S. Aizawa. 2002. “Landforms and Soil Characteristics in Ogawa Forest Reserve.” In Diversity and Interaction in a Temperate Forest Community: Ogawa Forest Reserve of Japan, edited by T. Nakashizuka, Y. Matsumoto, 19–26. Tokyo: Springer. doi:10.1007/978-4-431-67879-3_3.