
 ?Mathematical formulae have been encoded as MathML and are displayed in this HTML version using MathJax in order to improve their display. Uncheck the box to turn MathJax off. This feature requires Javascript. Click on a formula to zoom.
ABSTRACT
Present climate and socioeconomic issues would threaten the global food and environmental security. Smart farming (SF) based on advances in sensing, robotic, and information and communication technologies is a promising approach to support the efficient, sustainable, and profitable crop production. This paper discusses the background needs for SF and the role of remote sensing. Recent advances in remote sensing technology (platforms, sensors, algorithms) for diagnostic information of crops and soils are reviewed based on some leading case studies. The operation of a bundle of similar satellites (constellation) allows timely or frequent observations, and their spatial resolution (1 ~ 10 m) is applicable to agricultural regions of relatively small farmlands. The efficient use of high-resolution satellite sensors would strongly support the diagnostics and decision-making in SF on regional scales. Drone-based remote sensing would allow low-cost, high resolution, and flexible observations of crops and soils. Diagnostic information on crop growth, water stress, soil fertility, weed, disease, lodging, and 3D topography can be created from the optical, thermal and/or video images. The linkage between the remote sensing function and drone-based application of seeds, pesticides, fertilizes would greatly enhance the efficiency of labor and material applications and profitability.
1. Introduction
The world population is predicted to reach 9.7 billion in 2050 after reaching 7.7 billion in 2019 (United Nations Citation2019). However, the total arable-land area is not increasing; thus, the per capita food production has been decreasing in the past decades (FAOSTAT Citation2018). On the other hand, the negative impacts of climate change on crop productivity have been recognized in various crops and areas (Way and Long Citation2015; IPCC Citation2019). For example, the sterility of rice grain increases due to high air temperature during the heading stage. The grain quality of rice is lowered via immaturity or cracking due to high air temperature (e.g., Hasegawa et al. Citation2009). In the meantime, various evidences indicated that the conversion of land-use for agriculture and fertilizing are responsible for the emission of GHG (IPCC Citation2019). Therefore, the mitigation and adaptation strategies of agriculture to climate change are critical for food and environmental security. Technological innovation of agriculture is strongly required for the solution of these issues. So-called climate-smart agriculture is one of the concepts in this context (Way and Long Citation2015; IPCC Citation2019).
On the other hand, in the aspects of agricultural policy and economics, several issues strongly require technological innovations in agricultural management. The total number of farmers has been decreasing drastically while the average age of farmers has been increasing consistently. For example in Japan, the number of farmers has reduced by 50% in the past 20 years while the average age has increased from 59.1 to 66.3 (MAFF Citation2015). Consequently, a relatively small number of farmers have to manage a large number of small farmlands while the size of individual farmland remains unchanged (e.g., 0.3 ha). In addition, recent globalization of food market forces the agricultural sector to be more efficient and competitive. Under these circumstances, the smart farming that systematically utilizes the advanced technologies such as robotic, sensing, information, and communication technologies would play critical roles to support the efficient, labor-saving, sustainable, and profitable farming.
After the launch of Landsat satellite in 1972, great efforts have been spent worldwide for diverse applications of remote sensing to agriculture (Weiss, Jacob, and Duveiller Citation2020). As we reviewed the opportunities and limitations of image-based remote sensing in 1997 (Moran, Inoue, and Barnes Citation1997), the precision farming has been one of the most advanced applications of remote sensing to agriculture. Due to the limitations of spatial resolution and frequency of observations, such applications had been limited to the regions with large farm-fields such as in US and EU countries. For example in Japan, middle-resolution satellite such as Landsat was applied in Hokkaido region with moderate success (e.g., Asaka and Shiga Citation2003). However, it is a pity that most of these applications have been based on the empirical calibration of simple spectral indices such as normalized difference vegetation index (NDVI) despite the great technological achievements in sensor specifications, image processing methods, spectral algorithms, and biophysical modeling (Moran, Inoue, and Barnes Citation1997; Weiss, Jacob, and Duveiller Citation2020).
However, recent advances in high-resolution satellites with a larger number of wavebands and the advent of constellation satellites and drone systems would greatly facilitate the application of the technological achievements of remote sensing studies (Weiss, Jacob, and Duveiller Citation2020). In combination with the concurrent advances in artificial intelligence (AI), information and communication technology (ICT), big-data science, and robotics, remote sensing would greatly contribute to the innovative phase of new agriculture, i.e., smart farming. Smart farming is the intelligent management system seeking the higher productivity and quality with less labor and less input of energy and agrochemicals making the most of four technologies, i.e., sensing, ITC, big-data and AI, and robotics as well as their synergy. Remotely sensed information would be a unique source of ‘big data for agriculture.’ Systematic linkages of remote sensing with robotics and AI tools would enhance the efficiency and precision of crop and soil management.
On the basis of the above background, this paper provides an overview of the latest technological situation (e.g., new platforms and sensors, ICT infrastructure, algorithms) rather than an exhaustive collection of related studies or applied examples in the past. That is, the recent advances of remote sensing for smart farming are discussed based mainly on the latest case studies by the authors.
2. Technological challenges toward smart farming
2.1. Smart farming
Precision agriculture (PA) has been one of the advanced styles of agriculture in the past decades (Stafford Citation2000). The GPS and agricultural machinery equipped with sensors and variable-rate apparatus were key technologies for PA. Since the site-specific management in response to the spatial heterogeneity within each field is the central issue for PA, remote sensing could play an important role in PA (Moran, Inoue, and Barnes Citation1997; Zhang and Kovacs Citation2012). Now, thanks to the recent advances in sensor technologies and infrastructures for telecommunications, smart farming (SF) is a promising strategy beyond the PA. SF is an advanced farming style that seeks higher yield and quality as well as the efficient use of labor, agrochemicals, and energy inputs by making the most of advanced sensing and robotic technologies as well as the ICT (; Inoue and Yokoyama Citation2017; Wolfert et al. Citation2017). SF would enable a fewer number of people to manage a large number of fields much more efficiently than traditional farming. SF is strongly needed especially in such countries as Japan which suffers unprecedented issues as discussed in the previous section.
Figure 1. Overview of ‘Smart Farming’ concept. Four technologies, i.e., ❶ Sensing, ❷ ITC, ❸ Big-data and AI, ❹ Robotics, and their synergy will enable innovation of Smart Farming toward higher productivity and quality with less labor and less input of energy and agrochemicals. Satellite- and drone-based remote sensing has a critical role in ❶ and ❸
Therefore, the geoinformation by remote sensing would have an even more critical role in SF as a unique source of spatial data and diagnostic information for optimization of planning and management practices. The diagnostic information on crop growth and/or soil fertility will play important roles for the optimization of fertilizer application, irrigation management, harvest scheduling, and soil management, as well as yield prediction (). Remote sensing utilizes various types of sensors in optical, thermal, and microwave spectral domains that are mounted on a range of platforms such as satellite, aircraft, drone (UAV/UAS), or tractor. In general, spatial resolution and timeliness of observation have been most critical in practical applications for smart farming, but recent advances in high-resolution satellites and drones would greatly improve these constraints as discussed below.
Table 1. Main diagnostic information for smart farming that can be estimated by remote sensing
2.2. Recent advances in remote sensing of crops and soils
2.2.1. Sensors and platforms
While various platforms have been used for remote sensing (e.g., satellite, aircraft, balloon, helicopter, unmanned aircraft, tower), micro-satellites and multirotor-drones would be the most promising platforms for smart farming (e.g., Inoue Citation2017; Inoue and Yokoyama Citation2017; Inoue et al. Citation2020).
1) Optical domain
A wide range of sensors can be used for remote sensing of crops and soils. In optical domain (visible, near-infrared, and shortwave-infrared wavelength regions; 400 ~ 2500 nm), multispectral and hyperspectral data can be acquired. In general, hyperspectral sensors obtain high-resolution (1 ~ 10 nm) and continuous spectra while multispectral sensors acquire reflectance signatures in a few number of broad spectral bands (10 ~ 100 nm).
At present, many high-resolution optical satellite sensors can already be used for smart farming (). Most satellite sensors have at least four spectra bands in visible to near-infrared regions although hyperspectral satellite sensors are not available yet for operational use. Operation of a bundle of similar satellites (constellation) allows frequent (nearly daily) observation of the global surface (Planet Labs Inc. Citation2019). Their spatial resolutions (1 ~ 10 m) are applicable to wide agricultural regions in the world. The most essential constraints for optical sensors, i.e., frequent or timely observation, are now less critical thanks to such constellation satellites. In addition, an increasing number of wavebands are equipped in recent satellite sensors such as WorldView-3 and Venµs (), which would allow the application of advanced algorithms from hyperspectral analysis (e.g., Thenkabail, Lyon, and Huete Citation2019; Inoue et al. Citation2020).
Table 2. High-resolution satellite sensors applicable to smart farming
Drone-based remote sensing would allow low-cost, high spatial resolution, and flexible observations of crops and soils (Zhang and Kovacs Citation2012). Rapid progress in drone technologies would facilitate the advanced use of drones in smart farming while the legal frameworks for industrial use of drones have been improved worldwide (Stöcker et al. Citation2017). Accordingly, diagnostic information on crops, weeds, irrigation systems, or soils can be acquired automatically from the low-altitude (~150 m). Several commercial hyperspectral and multispectral sensors are available for drone-based remote sensing. Although most of such sensors are rather simple in structure and easy to operate, they have to be operated carefully for the acquisition of high-quality images (Kelcey and Lucieer Citation2012; Zhang and Kovacs Citation2012; Rasmussen et al. Citation2016; Inoue and Yokoyama Citation2019). Some of the low-cost commercial cameras such as small high-resolution video cameras or digital cameras can be used to take natural color images for simple observations or generation of 3D surface models (Verhoeven Citation2011; Inoue and Yokoyama Citation2019).
2) Thermal domain
Thermal sensors such as thermography and infrared thermometer can be used to measure the brightness temperature and emissivity of the target surfaces from a distance by detecting the thermal emission (3 ~ 15 μm). A few satellites such as Landsat-8 carry thermal sensors, but spatial resolution and revisit frequency are insufficient for application to smart farming (). Handheld infrared thermometer is a simple tool for measuring the surface temperature of leaves, canopy, or soils (Jackson et al. Citation1981). Portable thermography has been used for filed observation of plant canopy to detect water stress and diseases (e.g., Inoue Citation1990; Chiwaki, Nagamori, and Inoue Citation2005). Recently, compact and light thermal cameras are available for drone-based remote sensing (see a case study below; Inoue and Yokoyama Citation2019).
3) Microwave domain
Microwave satellite sensors (SAR: synthetic aperture radar) are quite attractive for agricultural applications especially in monsoon regions since they are scarcely affected by clouds (). Electromagnetic signatures, i.e., backscattering coefficient, emission, and polarimetric signatures in microwave domain (300 ~ 0.3 GHz, wavelength: 1 mm ~ 1 m) can be used to detect the differences in crop growth or soil conditions (Brisco and Brown Citation1998; Le Toan et al. Citation1997). For example, an experimental study by Inoue et al. (Citation2002) revealed the detailed seasonal changes in polarimetric backscattering signatures of multi-frequency bands (Ka, Ku, X, C, and L) in response to rice growth. Biophysical canopy properties can be estimated from satellite backscattering signatures since such signatures are sensitive to the structural difference of canopies (Bouvet and Le Toan Citation2011; Santi et al. Citation2012). Soil water content may be estimated from active or passive microwave signatures since such signatures are sensitive to the dielectric constant of the soil (Brisco and Brown Citation1998; Martínez-Fernández et al. Citation2016). At present, the spatial resolution of satellite SAR sensors is high (1 ~ 10 m), but the operational application of SAR sensors to smart farming is still at a research stage (Lopez-Sanchez, Hajnsek, and Ballester-Berman Citation2012; Inoue, Sakaiya, and Wang Citation2014; Baup et al. Citation2019).
2.2.2. Methodologies – overview of approaches and algorithms
As shown in , remote sensing can provide a wide range of useful information for smart farming. Nevertheless, it is essential to extract or generate such information from various physical signatures acquired by remote sensors. Detection, discrimination, and/or quantification of various crop and soil variables are enabled by semi-empirical algorithms and physically based models using remotely sensed data (Inoue, Morinaga, and Shibayama Citation1993; Liang Citation2005; Garbulsky et al. Citation2010; Gitelson et al. Citation2019; Weiss, Jacob, and Duveiller Citation2020). In addition to simple or multivariable regression algorithms, machine-learning methods such as artificial neural net (ANN) can be used for such predictive applications.
On the other hand, remotely estimated primary variables such as leaf area index (LAI) or fraction of absorbed photosynthetically active radiation (fAPAR) can be used as inputs to growth models and/or for tuning the model parameters for prediction of canopy functioning and productivity (Inoue, Moran, and Horie Citation1998; Inoue Citation2003; Olioso et al. Citation2005). Major analytical and predictive approaches in optical and thermal domains are discussed in detail below.
2.2.3. Optical domain
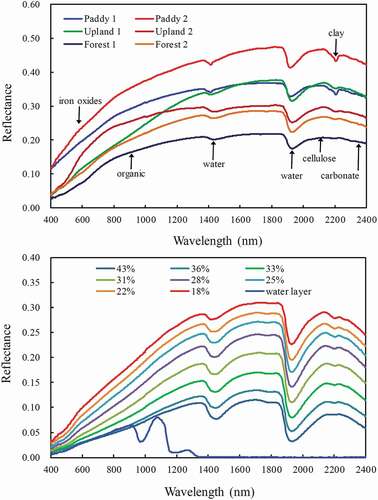
shows the typical seasonal change of hyperspectral reflectance of a rice paddy (Inoue et al. Citation2008). These seasonal changes depict the overall response of reflectance to the mixed biophysical and ecophysiological differences such as in leaf area, biomass, canopy structure, and water and chlorophyll contents. depicts the typical spectral reflectance of bare soils with different soil carbon and water contents (Zhi and Inoue Citation2012). Obviously, carbon and water contents strongly affect the reflectance spectra although soil is a complex mixture of various chemical materials (Ben-Dor and Banin Citation1995).
Figure 2. Typical seasonal change of hyperspectral reflectance in a rice paddy. Date (MM/DD) indicates month and date. (Inoue et al. Citation2008)
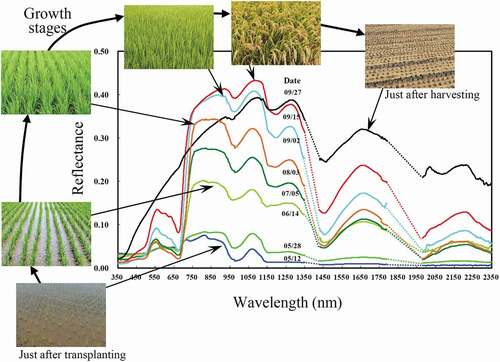
Figure 3. Typical hyperspectral reflectance of diverse soils (a) and a soil with different water content (b). (Zhi and Inoue et al. Citation2012)
For spectral assessment of crop and soil variables, the optimal algorithms utilize the reflectance data of selected narrow wavebands in the hyperspectral data (e.g., and ). Usually, the best combination of wavebands is unique to each target variable because each variable differently affects the spectral absorption, transmission, and reflection processes. Therefore, here, four types of analytical approaches are explained using hyperspectral data. Note that the majority of present sensors, especially space-borne ones, are not hyperspectral but multispectral (i.e., equipped with only a few broad wavebands), so that most algorithms using such wavebands do not always have the best predictive capability. Nevertheless, the knowledge and algorithms based on hyperspectral data would greatly contribute to the selection of optimal sensors and/or wavebands.
1) Generalized spectral index approach
Historically, a number of spectral indices have been proposed with specific names such as NDVI, EVI, SAVI using a few broad wavebands. The normalization using the reflectance values in multiple wavebands is effective to reduce the influence of errors or uncertainty due to atmospheric and background differences, as well as to enhance and/or linearize the spectral response to target vegetation (Huete Citation1988; Gitelson et al. Citation2019). However, the wavelengths and bandwidths are often specific to sensors, and predictive models are also sensor specific (e.g., Liu et al. Citation2003; Gitelson and Merzlyak Citation1997; Gitelson et al. Citation2005; Mutanga and Skidmore Citation2004). Thus, the generalized spectral index approach using hyperspectral data has been proposed (Inoue et al. Citation2008) and evaluated (Inoue et al. Citation2012, Citation2016, Citation2019).
The most typical formulations and expressions of generalized spectral indices are Normalized Difference Spectral Index (NDSI) and Ratio Spectral Index (RSI). The definitions of these indices are given by the following equations.
where x and y are reflectance (Ri and Rj) or first derivative (Di and Dj) values at i and j nm over the whole hyperspectral range. Note that R or D should be denoted with the number of central wavelength in units of nanometers. The derivative processing is effective to enhance weak spectral features and extracting critical wavelengths by reducing the influence of trends or low-frequency noise (Demetriades-Shah, Steven, and Clark Citation1990). Similarly, another transformation, RSI, is defined as
where both R and D values were also used for x and y.
The contour maps of predictive ability (r2, RMSE, etc.) for all NDSI or RSI indices using the thorough combinations of two wavebands can provide overview information on the optimal wavebands and bandwidths. This approach would allow a more precise and flexible application of knowledge on the relationships between hyperspectral data and ecophysiological variables (Inoue, Darvishzadeh, and Skidmore Citation2019). The generalized expressions would be more suitable for standardization, comprehensive comparisons or operational applications for wider applications.
2) Multivariable regression approach
Hyperspectral data are suitable for multivariable statistical analysis owing to the large number of wavebands (Spiegelman et al. Citation1998). However, note that the multi-collinearity due to the high correlation between wavebands is the inherent problem for the approach (Grossman et al. Citation1996). Principal component regression (PCR) and partial least-squares regression (PLSR) are effective to reduce the impact of multi-collinearity. However, some theoretical and experimental considerations (Spiegelman et al. Citation1998; Inoue et al. Citation2008, Citation2012, Citation2016) suggested that PLSR method may not always provide the best solutions. Alternatively, the interval PLSR (iPLSR: PLS with iterative waveband selection) would be more feasible for predictive modeling using hyperspectral data (Norgaard et al. Citation2000; Leardi and Norgaard Citation2004; Inoue et al. Citation2016).
3) Machine-learning approach
Thanks to the increased computing power, machine-learning methods such as artificial neural network (ANN) and support vector machine (SVM) can be applied to hyperspectral modeling. These methods require no assumptions on the statistical data distribution and linearity of the relationship between variables (Hansen and Schjoerring Citation2003; Ali et al. Citation2015). These approaches have been applied not only to classification problems but also to quantitative modeling for prediction of crop and soil variables (Ali et al. Citation2015; Durbha, King, and Younan Citation2007; Notarnicola, Angiulli, and Posa Citation2008; Zhi and Inoue Citation2012).
However, both accuracy and applicability of such data-driven methods are highly dependent on the size and quality of the training datasets (Doktor et al. Citation2014; Ali et al. Citation2015). In addition, note that predictive models based on data-driven methods are basically site and sensor specific (Meroni, Colombo, and Panigada Citation2004).
Artificial intelligence (AI) would be a powerful tool to solve various problems provided that large training and validation datasets (so-called ‘big data’) are available (Ali et al. Citation2015). This approach might provide useful solutions for decision-making in smart farming because many biological, environmental, and management factors are involved and because their relationships are often inexplicit or non-linear (Wolfert et al. Citation2017). However, scientific knowledge and expertise would become even more important for appropriate use of AI, because this approach needs an appropriate selection of input variables, optimization of the quantity and quality of training data, evaluation of the soundness of results, and insights on the underlying causal relationships.
4) Use of physically based reflectance models
As far as target ecophysiological variables are incorporated explicitly in canopy reflectance models, such variables might be retrieved through inversion of such models using hyperspectral measurements. For example, a physically based reflectance model PROSAIL can simulate the hyperspectral reflectance (1-nm resolution) of a canopy as a function of several ecophysiological variables such as leaf chlorophyll a + b concentration, equivalent water thickness, leaf structural parameter, LAI, and mean leaf inclination angle (LAD) in addition to sun zenith angle and soil reflectance (Jacquemoud et al. Citation2009). Iterative optimization methods (Meroni, Colombo, and Panigada Citation2004), look-up table approaches (Combal et al. Citation2003), or artificial neural networks (Schlerf and Atzberger Citation2006) have been applied to the inversion of the model with certain success.
The inversion approach is attractive because the models describe the underlying mechanisms of canopy reflectance. However, the approach has some inherent or technical constraints such as the uncertainty in finding an optimum solution (ill-posed problem), strong needs for accurate reflectance, and availability of data for model training or parameterization (Combal et al. Citation2003; Darvishzadeh et al. Citation2008). Nevertheless, physically based models are quite useful for investigating the possible effects of changes though simulations (Inoue et al. Citation2016). It would be useful to incorporate some additional variables such as leaf nitrogen content, light use efficiency, and grain protein content as explicit state variables in physically based models.
2.2.4. Thermal domain
Since the leaf temperature is sensitive to the ecophysiological conditions of the leaf, the leaf temperature can be used to detect or quantify the biotic and abiotic stresses by thermal remote sensing. Thermography can be used to detect diseases before the symptoms become visible (Nilsson Citation1991; Chiwaki, Nagamori, and Inoue Citation2005).
For quantitative assessment of stress conditions, both index and physically based approaches have been studied. Degree of water stress can be quantified by the crop water stress index (CWSI) based on infrared thermometry (Jackson et al. Citation1981; Gerhards et al. Citation2018). The CWSI represents the relative severity of water stress by normalizing the actual canopy temperature using the canopy temperature of healthy plant transpiring at potential rate. Moran, Inoue, and Barnes (Citation1997) extended the capability of CWSI to composite plant-soil surfaces under wider micrometeorological conditions by the water deficit index (WDI).
Since the canopy temperature is determined by the energy balance of leaves, the transpiration and stomatal conductance can be quantified remotely by incorporating the canopy temperature into the energy balance model (Inoue et al. Citation1990, Citation1994; Inoue and Moran Citation1997). These methods and algorithms can be applied to early detection of disease and optimization of irrigation scheduling in smart farming. However, we have to be careful about the influence of environmental conditions (e.g., solar radiation, wind) to assure the consistency and applicability of derived information.
3. Advanced use of high-resolution satellite sensors – case studies -
The most attractive merit of satellite remote sensing is the capability to acquire the high-resolution image data over large areas at an instant. Accordingly, in the US and EU countries where the farm size is large (typically 5 ~ 20 ha), satellite remote sensing has been applied to farm management on a commercial basis (e.g., FARMSTAR). The operational service of FARMSTAR in France, for example, is used by 18,000 farmers (800,000 ha) in 2017. The service includes the acquisition and processing of satellite imagery, creation of diagnostic information, and consultation for optimizing practical management of wheat, rapeseed, and other crops. Reportedly, farmers’ income increased by 150 ~ 250 Euro ha−1 yr−1 through the increases in yield (10 ~ 15%) and grain protein content (0.8%), as well as the reduced use of fertilizer (10 ~ 17%). The annual cost was 10 Euro ha−1 yr−1. The renewal ratio of the contract for the service reaches 90% (Arvalis and Airbus Defense and Space Citation2020). Another example of practical application of satellite imagery in Hokkaido region (Japan) to crop monitoring suggests that the large field size and relatively uniform cropping systems favored the operational applications of middle-resolution satellite sensors (e.g., Asaka and Shiga Citation2003; Asaka, Hayashi, and Shiga Citation2006).
Contrarily, in most Asian countries including the main island of Japan, a large number of small fields (typically 0.1 ~ 0.5 ha) are owned or managed by different farmers. Accordingly, practical applications of satellite imagery to farming have been hampered mainly by the constraints in the spatial resolution and cost-benefit. However, in such regions, strategic guidelines for stable production and/or local-branding of high-quality crops are strongly required. Hence, the latest satellite and information technologies would strongly support the smart farming on a regional scale with high-resolution diagnostic information. A larger number of wavebands equipped in recent satellites would facilitate the application of advanced spectral algorithms and methodologies. Therefore, the brief explanations of our recent case studies below would be useful to extend the advanced applications of high-resolution optical satellite remote sensing to smart farming in wider regions (Inoue Citation2017). Exhaustive reviews of related research studies are available in the literature (e.g., Moran, Inoue, and Barnes Citation1997; Inoue Citation2003; Baret and Buis Citation2008; Ali et al. Citation2015; Weiss, Jacob, and Duveiller Citation2020).
1) Canopy chlorophyll content in wheat
Canopy chlorophyll content (CCC) is the most important photosynthetic variable of crops and can be accurately estimated by using red-edge wavebands (Inoue et al. Citation2016). Here, such algorithm was applied to estimate the spatial distribution of wheat growth in farmer’s wheat fields. High-resolution satellites WorldView-2 and −3 were used to map the CCC at the critical diagnostic stage for top-dressing. These satellites were equipped with the red-edge bands, so the spectral algorithm using the red-edge band derived from hyperspectral analysis (see section 2.2.2) was applied to the satellite images after atmospheric correction to calculate CCC. The predicted CCC values were validated indirectly using in-situ green biomass because the CCC algorithm had been calibrated sufficiently with diverse datasets. The comparative results (r2 = 0.79 in 2015 and 0.87 in 2016, respectively) proved that the CCC maps represented the between and within-field spatial variability with sufficient accuracy.
In wheat cultivation, top-dressing of nitrogen fertilizer at stem-elongation and anthesis stages is critical for higher yield and protein content. In this case study, the diagnostic CCC map was used for optimizing the amount of fertilizer. Additionally, the digital map was given to a scattering machine to realize the variable application of fertilizer in response to the spatial variability of CCC. The experimental case study demonstrated the significant role of diagnostic geoinformation obtained by remote sensing (Inoue Citation2017).
2) Canopy nitrogen content in rice
In rice cultivation in Japan, it is recommended to keep the grain protein content (GPC) below a certain level (e.g., <7.5%) for better taste. Therefore, in the guidelines of rice cultivation in most parts of Japan, the amount of nitrogen fertilizer is restricted to avoid overdose. However, an appropriate amount of nitrogen fertilizer should be applied to assure the desired level of yield. Accordingly, the fertilizer management of rice is not simple because of these contradictory demands. Diagnostic information on the nitrogen status rice canopy in individual paddy fields is quite useful for optimizing the amount of basal and/or top-dressing fertilizer. Traditionally, in-situ measurements of canopy height, stem number, and leaf greenness in a small number of selected paddies have been used for diagnosis. However, the method is laborious and time-consuming, and the data are not always representative of each paddy. Implementation of such diagnostic methods would become impossible due to the serious labor situation in Japan as discussed in Introduction.
In order to replace such traditional method with remote sensing, we applied satellite remote sensing to the mapping of canopy nitrogen content (CNC) (Inoue Citation2017). The CNC map in one of the largest rice-growing areas in Japan (Shonai Plain) was created from the WorldView-2 imagery at the important growth stage (panicle initiation stage). Since the satellite sensor was equipped with the red-edge band, nearly optimal algorithm determined from hyperspectral analysis (Inoue et al. Citation2012) was applied. In general, in-situ validation is not always needed in individual applications since the algorithm has been calibrated and validated sufficiently. In this case study, a simple validation with in-situ data proved that the satellite-based CNC map was reasonable (r2 = 0.8 ~ 0.9). The basic hyperspectral analysis allows to provide second-best algorithm such as NDVI when the spectral specifications of usable satellite are not suitable for the best algorithm.
In this case, the diagnostic map of CNC over a few hundred thousands paddies at 1.6 m resolution was created. While the spatial variability within each field can be assessed in the map, the average CNC values for individual paddy fields were calculated by using GIS system. The data are translated to determine the actual amount of nitrogen to be applied taking the predicted response of final yield and grain protein content.
3) Grain protein content in rice
As discussed in the previous section, GPC is usually used in Japan as an indicator to infer the taste of rice. For the local branding of high-quality rice, the prediction of GPC on a regional scale is useful for segmented harvesting or recommendation of fertilizer application for the next season to assure the high quality of local products (Sakaiya and Inoue Citation2012). The pioneering application of satellite imagery to an assessment of GPC in rice was done in Hokkaido region using Landsat imagery (Asaka and Shiga Citation2003). Nevertheless, the application of this simple technique was not extended to the other regions because of the limited applicability of low-resolution satellites. In addition to the small size of farm-fields, more diverse cropping conditions in the other regions were also a critical constraint. The recent advances in spatial resolution, constellation, and waveband specifications would allow extension of such applications to wider regions and the adoption of better algorithms. In this application (Tsugaru Plain), the satellites SPOT-6/7 and RapidEye with somewhat lower spatial resolutions () were used to cover the wide area (~3,000 km2) with reasonable costs. Due to the constraints in spectral specifications, the NDSI using green and near-infrared bands was applied to create the operational GPC maps with reasonable accuracy (r2 = 0.5 ~ 0.6) were obtained (Inoue Citation2017).
4) Optimal harvesting date in rice
It is well known that high temperature during the ripening period would cause the degradation of grain quality in rice such as in sufficient filling or cracking. The risk of grain cracking increases rapidly after the physiological maturity, so that timely harvesting is strongly recommended to avoid the damage. Actually, the between-filed variability of physiological maturity, i.e., optimal harvesting date, is large even in the same districts. However, the traditional method based on accumulated temperature was able to provide only the rough prediction of harvesting date at coarse resolutions (district scales). Therefore, the information on the physiological maturity in individual paddy fields is quite useful to avoid the delay of harvesting (Sakaiya and Inoue Citation2013). This application may be a typical example that information-based smart farming is effective to avoid the negative impacts of high temperature on yield and quality of crops.
In this case study, SPOT 6 was acquired during the mid-maturity periods for prediction of the optimal harvesting date over the whole plain (~3,000 km2). NDSI index using the red and near-infrared bands was applied in combination with the records of average harvesting date in the past few years to calculate the date of physiological maturity in all paddy fields. The comparison of predicted date by remote sensing and ground-based observations proved the operational applicability of the method (r2 = 0.6 ~ 0.8). This method has been used practically by the local agricultural agencies and farmers.
5) Maturity of wheat
Geospatial assessment of maturity in individual wheat fields can be used for harvest scheduling many fields distributed over the wide area and to reduce the drying cost by timely harvesting. For example in Hokkaido region (Japan), NDVI is used operationally to predict the degree of wheat maturity. It is based on the close relationship between NDVI and the loss of chlorophyll associated with maturity. However, recent multiband high-resolution sensors would allow the use of advanced algorithms for higher accuracy and/or robustness. In this case study, we employed the quasi-constellation of three high-resolution satellites (WorldView-2/3 and GeoEye-1) to acquire the timely data during the mid-maturity stage. Timely observation is more critical in wheat because the progress of physiological maturity in wheat is much faster compared to rice. Spectral algorithm using three bands (green, red, near-infrared) was applied to estimate the water content of heads to represent the physiological maturity (Inoue Citation2017). High correlation between satellite-based and ground-based data of water contents (r2 = 0.8) suggested that the relative maturity stage can be estimated with sufficient accuracy over the area of interest (~100 km2).
6) Soil fertility
Soil fertility is one of the most important properties of farmland because the substantial part of nutrition for crops is provided from the soil. Accordingly, the information on the present level of fertility in individual farm parcels is useful for better soil and fertilizer management. The soil fertility is represented by the humus content which is proportional to the soil carbon content (SCC). Since the chemical analysis with soil sampling is laborious and costly, a number of studies attempted to estimate the SCC by spectral sensing methods (Ben-Dor and Banin Citation1995; Ladoni et al. Citation2010; Angelopoulou et al. Citation2019). Accordingly, satellite sensors have been applied to relative soil fertility within a scene. For example, a case study showed that the soil organic matter would be estimated using Landsat TM imagery in a district of Hokkaido region, Japan where such an attempt was favored by relatively large field size and uniform bare surface conditions (Shiga, Fukuhara, and Ogawa Citation1989). However, since the predictive models are highly dependent on soil types, measuring conditions, and waveband availability (Stevens et al. Citation2008; Angelopoulou et al. Citation2019), the accuracy and robustness (i.e., applicability to a wider range of soil types and soil surface conditions) have to be further investigated. The results of the hyperspectral analysis suggest that the use of high-resolution satellites with a larger number of narrow wavebands would allow higher accuracy and wider applicability (Inoue et al. Citation2020; Zhi and Inoue Citation2012). Recent satellite environment (), especially such satellites with high frequency, high-resolution, and/or many narrow wavebands would provide further opportunities to improve the regional assessment of soil fertility.
Several wavebands in shortwave-infrared wavebands are closely correlated with the SCC due to the weak overtones and combinations of these vibrations caused by stretching and bending of the N-H, O-H, and C-H bonds in the spectral regions (Ben-Dor and Banin Citation1995; Zhi and Inoue Citation2012; Angelopoulou et al. Citation2019). However, some wavebands in visible spectral region (400–700 nm) are also correlated with the SCC because of the absorption by chromophores included in the soil organic matter. Therefore, here, we applied a high-resolution satellite WorldView-2 to the estimation of the SCC in farmers’ fields (). The SCC was estimated by a normalized spectral index using a few wavebands in visible and near-infrared wavebands (Inoue Citation2017). A spectral algorithm suitable for multispectral satellite sensor was chosen from several useful indices derived by laboratory hyperspectral analysis (Zhi and Inoue Citation2012). The SCC values estimated from satellite imagery were closely related to the SCC determined by the chemical analysis of soil samples (r2 = 0.63). Results suggest that this approach would be useful for an overall assessment of soil fertility of individual fields over a wide area of interest. Since the surface vegetation such as crops and weeds affects the accuracy of prediction, the soil surface has to be bare at the time of satellite observations. However, a complete SCC map for an area can be created by using multi-temporal images because the SCC is relatively stable soil property under the normal farm management.
4. Advanced use of drone-based remote sensing
4.1. Advanced drone-based remote sensing system – a case study -
Drone-based remote sensing is useful for timely acquisition of high-resolution diagnostic information for farm management especially in farms with a large number of small size farmlands as in Japan and most Asian countries. However, during the recent boom of application of drones to agriculture, the integrated knowledge or achievement of remote sensing studies have not always been used effectively (Snow Citation2016; Zhang and Kovacs Citation2012; Aasen et al. Citation2018). At present, spectral remote sensing is recognized as one of the most challenging industrial applications of drones. Therefore, a study by the authors on the development and applications of drone sensing system would provide useful insights for practical applications in smart farming (Inoue and Yokoyama Citation2017, Citation2019). The function and performance of the system were verified through applications to farmers’ fields.
1) Platform and sensing system
The overall structure of the sensing system, as well as the basic workflow for data-processing and generation of diagnostic information, is depicted in . The platform was a customized model of the high-performance multicopter drone ACSL-PF1 developed by ACSL (Chiba, Japan). The overall diameter was 110 cm. The total payload was up to 6 kg, and the flight time was up to 50 min. The flight routes for observation can be pre-designed on PC, and all flights from take-off to landing can be automatically controlled based on GPS and altimeter. The operation of the system can be fully controlled remotely from a tablet-PC. We developed this original sensing system using fully domestic drones in order to ensure the superiority in data security and flexibility of customization and to encourage the domestic drone industry.
Figure 4. Advanced drone remote sensing system and function. (Inoue and Yokoyama Citation2019)
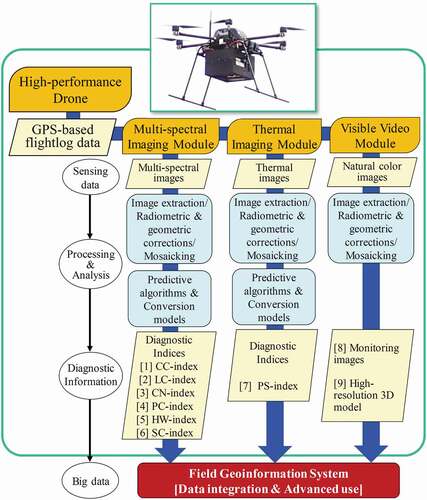
Three imaging modules, i.e., multispectral, thermal, and video imaging modules, were mounted on the drone platform. The original multispectral imaging module developed by the authors was equipped with five bands in a 400–900 nm wavelength region. The central wavelength and width for each waveband were selected based on the analysis of diverse hyperspectral datasets. The size of the multispectral image was 2016 × 2016 pixels (8 bit) with the FOV of 43° x 43°. A portable ground-based data logging system was devised to record the incidence irradiance in the same spectral bands, air temperature, and humidity (rotoronic, HC2-S3 H), and GPS data at 10 Hz.
The thermal imaging module consisted of thermal infrared imager (Optris, PI-LW), the micrometeorological sensor (rotoronic, HC2-S3 H) and mini-PC for controlling, recording, and calculation. The color video module (SONY, FDR-X3000) was used to record high-resolution movies (1920 x 1080) with GPS data.
Basically, the standard flight condition was at an altitude of 100 m and a speed of 4 m sec-1. A large volume of image data were obtained by using the drone-based remote sensing system under various farming conditions in local farms in Japan. Radiometric and geometric calibrations, as well as the orthomosaic processing of such image-data, were conducted semi-automatically using GPS and calibration-source data by our integrated data-processing system which included the core part of PhotoScan (Agisoft).
2) Algorithms and functions
Physically consistent images data (i.e., spectral reflectance images) were created from raw images by automated image processing, and converted to the diagnostic maps. Optimum algorithms (spectral indices) and predictive models for most important diagnostic variables in SF were derived from a comprehensive analysis of hyperspectral datasets (Inoue et al. Citation2012, Citation2016; Inoue, Darvishzadeh, and Skidmore Citation2019; Inoue and Yokoyama Citation2019). For example, canopy and leaf chlorophyll content (CC-index, LC-index), canopy nitrogen content (CN-index), photosynthetic capacity (PC-index), head water content (HW-index), and soil carbon content (SC-index) could be assessed from the multispectral module.
Plant stress indicator (PS-index) was also derived based on biophysical analysis of infrared thermal data and micrometeorological data. The PS-index (0–1) represents the relative degree of stress between the most severe stress condition (PS-index = 1) and non-stress condition (PS-index = 0). This algorithm is a simplified version of the crop water stress index (Jackson et al. Citation1981) and water deficit index (Moran, Inoue, and Barnes Citation1997).
The 3D models of farmland surfaces were created semi-automatically from the overlapped frame images extracted from the video imagery and GPS data based on SfM algorithm (Verhoeven Citation2011).
3) Applications and verifications
The applicability of these algorithms were also directly validated with the datasets obtained by the drone-system in farmers’ fields. The statistical significance was somewhat lower compared to those using hyperspectral datasets (r2 = 0.65 ~ 0.98), but useful for diagnostic applications in smart farming. For example, the normalized RMSE for the canopy nitrogen content was around 10%, while the practical levels of fertilizer application, at present, are as rough as three or four classes. The results would be applicable to high-precision variable fertilizers. The plant stress-indicator (PS-index) proved to be correlated well to the stomatal conductance data in wheat (r2 = 0.76). Nevertheless, more sophisticated normalization of environmental influences would be needed for wider applicability.
High-resolution maps of those diagnostic indices were created semi-automatically by the integrated processing system and used in operational case studies in wheat and rice fields of farmers. For example, the CC-index was effective for diagnostics of fertilizer management in wheat. This information is effective for optimizing the application dose of nitrogen fertilizer needed for higher grain yield and quality. The PS-index was calculated at a real-time basis during a flight, and the diagnostic information could be sent via wireless communication to the ground to remotely control the actuators. The 3D surface models were useful for the assessment of plant height or surface irregularity of farmland. The automated bird’s eye observation from the low altitudes is the most simple application but provides useful information on weeds, irrigation facilities, plant lodging, diseases, and so on.
In summary, our case study proved that an advanced drone-based remote sensing would be useful for the timely and efficient monitoring of crops, soils, weeds, diseases, etc., mainly in farms on the scale of ~100 ha (Inoue and Yokoyama Citation2019).
4.2. Recommendations – Good practices for drone-based remote sensing of crops and soils
Drone-based remote sensing systems can be used by local agencies or farm managers thanks to the low-cost and easy handling. Acquisition of color pictures or multispectral images is relatively easy, so simple maps of spectral indices such as NDVI are often produced. However, it is not well recognized that the creation of reliable and consistent diagnostic maps requires careful measuring and processing steps. For example, the quality of spectral images is affected by various sensor and environmental conditions such as sensitivity and solar illumination. In practical applications, speedy operation of drone systems is critical for efficient data acquisition over large farm areas. Obtained images of digital number (DN) have to be converted to physically consistent reflectance images. Such reflectance or thermal images have to be processed using appropriate algorithms to create agronomically meaningful images (Zhang and Kovacs Citation2012; Inoue and Yokoyama Citation2017, Citation2019).
Accordingly, the good practices are required for the whole workflow from flight planning, acquisition and processing of image data to the creation of diagnostic maps. Here, some essential steps of the workflow are discussed.
1) Flight planning for efficient acquisition of high-quality imagery
The altitude, route, speed of flight strongly affect the quality of data (e.g., spatial resolution, overlapping rate) and efficiency of data acquisition (e.g., area per hour). In most drone systems, automated flight along the planned routes is possible by using GPS data. Therefore, flight routes and specifications should be designed carefully beforehand taking the size/topography of farmland, spatial resolution and overlapping rate of images, and ground conditions into consideration. Note that the time of day for the image acquisition is also important because the elevation and direction of the sun affects the data quality.
2) Acquisition of high-quality spectral imagery
The quality of spectral imagery is affected by the flight performance of drone, sensor specifications, and environmental conditions. In addition to vibration and attitude of drone, the electromagnetic wave can influence the performance of sensors, controllers, and recorders. The use of dumper and global shutter would reduce the impact of vibration. Windy conditions should be avoided because fluctuation in the direction of the optical axis would cause radiometric error. Exposure time, dynamic range, sensitivity, and vignetting of the image sensor should be considered carefully. The fluctuation of sun illumination due to clouds and sun elevation is the most critical factor among the environmental conditions (Jackson, Clarke, and Moran Citation1992). Basically, radiometric correction is necessary to obtain physically consistent reflectance images. Nevertheless, operations under stable sky conditions would ease the subsequent image processing.
3) Image processing for sufficient radiometric accuracy
In order to create reliable diagnostic maps, digital number (DN) images recorded by multispectral sensors have to be converted to physically consistent spectral reflectance images. A series of grayscales with known reflectance values can be used for calibration of DN images. In this approach, the grayscales must be included within at least some of the multispectral images, then DN images are converted to reflectance images assuming that the illumination conditions were similar for all acquired images during a flight. However, note that fluctuation of solar illumination during a flight could result in significant uncertainty. Another calibration method is to measure the intensity of reference light at the acquisition time of DN images. Such reference data can be recorded continuously by onboard or ground-based spectral sensors. The reflectance images can be calculated by using the reference data and calibrated coefficients. Spatial nonuniformity within an image is caused by vignetting and difference in sensitivity of the detector. Since the basic information of physical details of such optical devices is not disclosed, overall calibration of the optical system is recommended to quantify the effect of these complex errors on the DN-reflectance relationship at individual pixels.
4) Image processing for sufficient geometrical accuracy
The size of individual images is usually inadequate to cover the area of interest. Accordingly, a large number of overlapped images are taken to create wider orthomosaic images. The orthomosaic and/or 3D surface images can be created semi-automatically by using SfM method (see section 4.1). The overlapping ratios have to be optimized (usually 60% to 90%) to allow the creation of a sufficient point cloud. Note that accurate GPS data for individual images are helpful for accurate and speedy SfM orthomosaic processing. Accurate georectification is critical because diagnostic maps are used by GPS-based agricultural machinery and because the georeferenced images will be integrated as big data.
5) Generation and systematic use of diagnostic information
A wide range of algorithms can be applied to generate diagnostic maps. As explained in section 2.2.2, hyperspectral data of crops and soils would be useful sources for robust and flexible algorithms. However, data-processing steps, conversion algorithms, and the format of diagnostic maps should be customized based on the conditions and preferences of end-users. Already, diagnostic maps can be transferred to the end-users quickly via network infrastructure, so more user-friendly web-GIS applications are desirable. Standardization of the usage of digital maps by robotic machines would enhance the linkage between remote sensing and agricultural machinery toward smart farming.
5. Perspectives
Potential capability of remote sensing for agricultural applications has been investigated extensively in the past five decades. Some of the research achievements have been applied operationally to crop management or regional surveillance of crop area and yield (Moran, Inoue, and Barnes Citation1997; Weiss, Jacob, and Duveiller Citation2020).
While most practical local applications to date have been the simple application of NDVI, the recent improvements in sensor specifications and the number of high-resolution satellites () allow various applications and algorithms to be realized in commercial farming (e.g., Inoue and Yokoyama Citation2017; Inoue Citation2017; Defourny et al. Citation2019; Weiss, Jacob, and Duveiller Citation2020). High-resolution images provided by the increasing number of commercial satellites and the free satellite images provided by official agencies (e.g., Sentinel series) would enhance further opportunities for various applications to smart farming (). New satellite sensors with hyperspectral or directional specifications will improve the predictive accuracy and/or expand the range of useful information (e.g., Loizzo et al. Citation2019; Habermeyer et al. Citation2019). Global dissemination of the information and communication technologies (ICT) is accelerating the direct, speedy, and systematic transfer of digital images or diagnostic maps to analysts and end users. From our experiences, it is strongly suggested that the satellite-based diagnostic systems for local agricultural applications should be designed, developed, and operated through the intimate collaborations between business sectors, local agricultural agencies, and remote sensing specialists in public sectors.
Drone is a new type of promising platform for agricultural remote sensing, and the drone technology is still progressing rapidly. Therefore, while the good practices are needed for robust applications for smart farming, drones would further facilitate the timely, high-resolution, easy, and low-cost acquisition of imagery. In addition, drones can be used for crop and soil management practices. For example, a large number of unmanned helicopters and multi-rotor drones are used for the application of pesticides in Japan (Inoue and Yokoyama Citation2017). Some of the hard and laborious management tasks such as application of fertilizer, pesticides or herbicides, seeding, weeding, pollination, irrigation management, and so forth would be replaced by automated drones. Not only remote sensing information but also the combination of the remote sensing function and such management tasks would greatly enhance the efficiency of labor and material applications and profitability in smart farming. For example, the site-specific weed control enabled by the combination of diagnostic imagery and drone-based precision spraying would support farmers to reduce the consumption of pesticide, health risk of applicators, and the impacts on natural environment.
Disclosure Statement
No potential conflict of interest was reported by the author.
Additional information
Funding
References
- Aasen, H., E. Honkavaara, A. Lucieer, and P. J. Zarco-Tejada. 2018. “Quantitative Remote Sensing at Ultra-high Resolution with UAV Spectroscopy. A Review of Sensor Technology, Measurement Procedures, and Data Correction Workflows.” Remote Sensing 10: 1091.
- Ali, I., F. Greifeneder, J. Stamenkovic, M. Neumann, and C. Notarnicola. 2015. “Review of Machine Learning Approaches for Biomass and Soil Moisture Retrievals from Remote Sensing Data.” Remote Sensing 7: 16398–16421.
- Angelopoulou, T., N. Tziolas, A. Balafoutis, G. Zalidis, and D. Bochtis. 2019. “Remote Sensing Techniques for Soil Organic Carbon Estimation: A Review.” Remote Sensing 11: 676. doi:https://doi.org/10.3390/rs11060676.
- Arvalis & Airbus Defense and Space. 2020. “FARMSTAR.” Accessed 15 January 2020. https://www.myfarmstar.com/en/technology/
- Asaka, D., and H. Shiga. 2003. “Estimating Rice Grain Protein Content with SPOT/HRV Data Acquired at Maturing Stage.” Journal of the Remote Sensing Society of Japan 23: 451–457. (In Japanese with English summary).
- Asaka, D., T. Hayashi, and H. Shiga. 2006. “The Map of Grain Protein Content of Winter Wheat Using Satellite Observed NDVI at Maturing Stage.” Journal of the Japanese Agricultural Systems Society 22: 89–98. (In Japanese with English summary).
- Baret, F., and S. Buis. 2008. “Estimating Canopy Characteristics from Remote Sensing Observations: Review of Methods and Associated Problems.” In Advances in Land Remote Sensing, edited by S. Liang, 173–201. Netherlands: Springer.
- Baup, F., M. Ameline, R. Fieuzal, F. Frappart, S. Corgne, and J.-F. Berthoumieu. 2019. “Temporal Evolution of Corn Mass Production Based on Agro-meteorological Modelling Controlled by Satellite Optical and SAR Images.” Remote Sensing 11: 1978.
- Ben-Dor, E., and A. Banin. 1995. “Near-infrared Analysis as a Rapid Method to Simultaneously Evaluate Several Soil Properties.” Soil Science Society of America Journal 59: 364–372.
- Bouvet, A., and T. Le Toan. 2011. “Use of ENVISAT/ASAR Wide-swath Data for Timely Rice Fields Mapping in the Mekong River Delta.” Remote Sensing of Environment 115: 1090–1101.
- Brisco, B., and R. J. Brown. 1998. “Agricultural Applications with Radar.” In Principles and Applications in Imaging Radar, edited by F. M. Henderson and A. J. Lewis, 381–406. New York: John Wiley & Sons, Inc.
- Chiwaki, K., S. Nagamori, and Y. Inoue. 2005. “Predicting Bacterial Wilt Disease of Tomato Plants Using Remotely Sensed Thermal Imagery.” Journal of Agricultural Meteorology 61: 153–163.
- Combal, B., F. Baret, M. Weiss, A. Trubuil, D. Macé, A. Pragnère, R. Myneni, Y. Knyazikhin, and L. Wang. 2003. “Retrieval of Canopy Biophysical Variables from Bidirectional Reflectance Using Prior Information to Solve the Ill-posed Inverse Problem.” Remote Sensing of Environment 84: 1–15.
- Darvishzadeh, R., A. Skidmore, M. Schlerf, and C. Atzberger. 2008. “Inversion of a Radiative Transfer Model for Estimating Vegetation LAI and Chlorophyll in a Heterogeneous Grassland.” Remote Sensing of Environment 112: 2592–2604.
- Defourny, P., S. Bontemps, N. Bellemans, C. Cara, G. Dedieu, E. Guzzonato, O. Hagolle, et al. 2019. “Near Real-time Agriculture Monitoring at National Scale at Parcel Resolution: Performance Assessment of the Sen2-Agri Automated System in Various Cropping Systems around the World.” Remote Sensing of Environment 221: 551–568.
- Demetriades-Shah, T. H., M. D. Steven, and J. A. Clark. 1990. “High Resolution Derivative Spectra in Remote Sensing.” Remote Sensing of Environment 33: 55–64.
- Doktor, D., A. Lausch, D. Spengler, and M. Thurner. 2014. “Extraction of Plant Physiological Status from Hyperspectral Signatures Using Machine Learning Methods.” Remote Sensing 6: 12247–12274.
- Durbha, S. S., R. L. King, and N. H. Younan. 2007. “Support Vector Machines Regression for Retrieval of Leaf Area Index from Multiangle Imaging Spectroradiometer.” Remote Sensing of Environment 107: 348–361.
- FAOSTAT. 2018. “Food and Agriculture Organization Corporate Statistical Database (FAOSTAT) 29.” Accessed 30 August 2019. http://www.fao.org/faostat/en/#home
- Garbulsky, M. F., J. Peñuelas, J. Gamon, Y. Inoue, and I. Filella. 2010. “The Photochemical Reflectance Index (PRI) and the Remote Sensing of Leaf, Canopy and Ecosystem Radiation Use Efficiencies.” Remote Sensing of Environment 115: 281–297.
- Gerhards, M., M. Schlerf, U. Rascher, T. Udelhoven, R. Juszczak, G. Alberti, F. Miglietta, and Y. Inoue. 2018. “Analysis of Airborne Optical and Thermal Imagery for Detection of Water Stress Symptoms.” Remote Sensing 10: 1139.
- Gitelson, A., A. Viña, A. Solovchenko, T. Arkebauer, and Y. Inoue. 2019. “Derivation of Canopy Light Absorption Coefficient from Reflectance Spectra.” Remote Sensing of Environment 231. doi:https://doi.org/10.1016/j.rse.2019.111276.
- Gitelson, A. A., A. Viña, D. C. Rundquist, V. Ciganda, and T. J. Arkebauer. 2005. “Remote Estimation of Canopy Chlorophyll Content in Crops.” Geophysical Research Letters 32: L08403. doi:https://doi.org/10.1029/2005GL022688.
- Gitelson, A. A., and M. N. Merzlyak. 1997. “Remote Estimation of Chlorophyll Content in Higher Plant Leaves.” International Journal of Remote Sensing 18: 2691–2697.
- Grossman, Y. L., S. L. Ustin, S. Jacquemoud, E. W. Sanderson, G. Schmuck, and J. Verdebout. 1996. “Critique of Stepwise Multiple Linear Regression for the Extraction of Leaf Biochemistry Information from Leaf Reflectance Data.” Remote Sensing of Environment 56: 182–193.
- Habermeyer, M., N. Pinnel, T. Storch, H. P. Honold, P. Tucker, L. Guanter, K. Segl, and S. Fischer 2019. “The EnMAP Mission: From Observation Request to Data Delivery.” Proceedings of the IEEE International Geoscience and Remote Sensing Symposium (IGARSS) 2019, 4507–4510. Yokohama.
- Hansen, P. M., and J. K. Schjoerring. 2003. “Reflectance Measurement of Canopy Biomass and Nitrogen Status in Wheat Crops Using Normalized Difference Vegetation Indices and Partial Least Squares Regression.” Remote Sensing of Environment 86: 542–553.
- Hasegawa, T., T. Kuwagata, M. Nishimori, Y. Ishigooka, M. Murakami, M. Yoshimoto, and H. Matsuzaki. 2009. “Recent Warming Trends and Rice Growth and Yield in Japan.” In Proceedings of MARCO Symposium WS2 Crop Production under Heat Stress: Monitoring, Impact Assessment and Adaptation, WS2-07: 1–7. National Institute for Agro-Environmental Sciences, Tsukuba, Japan, October 5-7, 2009.
- Huete, A. R. 1988. “A Soil Vegetation Adjusted Index (SAVI).” Remote Sensing of Environment 25: 295–309.
- Inoue, Y. 1990. “Remote Detection of Physiological Depression in Crop Plants with Infrared Thermal Imagery.” Japanese Journal of Crop Science 59: 762–768.
- Inoue, Y. 2003. “Synergy of Remote Sensing and Modeling for Estimating Ecophysiological Processes in Plant Production.” Plant Production Science 6: 3–16.
- Inoue, Y. 2017. “Remote Sensing of Plant and Soil Information by High-resolution Optical Satellite Sensors and Its Applications to Smart Agriculture.” Journal of the Remote Sensing Society of Japan 37: 213–223.
- Inoue, Y., R. Darvishzadeh, and A. Skidmore. 2019. “Hyperspectral Assessment of Ecophysiological Functioning for Diagnostics of Crops and Vegetation.” In Hyperspectral Remote Sensing of Vegetation, edited by P. S. Thenkabail, J. Lyon, and A. Huete, 2nd ed, Vol. 3. 25–72. London: CRC Press-Taylor and Francis group.
- Inoue, Y., B. A. Kimball, R. D. Jackson, P. J. Pinter, and R. J. Reginato. 1990. “Remote Estimation of Leaf Transpiration Rate and Stomatal Resistance Based on Infrared Thermometry.” Agricultural and Forest Meteorology 51: 21–33.
- Inoue, Y., E. Sakaiya, and C. Wang. 2014. “Capability of C-band Backscattering Coefficients from High-resolution Satellite SAR Sensors to Assess Biophysical Variables in Paddy Rice.” Remote Sensing of Environment 140: 257–266.
- Inoue, Y., E. Sakaiya, Y. Zhu, and W. Takahashi. 2012. “Diagnostic Mapping of Canopy Nitrogen Content in Rice Based on Hyperspectral Measurements.” Remote Sensing of Environment 126: 210–221.
- Inoue, Y., G. Dedieu, Y. Yoshida, T. Saito, A. Iwasaki, and E. Sakaiya 2020. “Assessing Crop Productivity in Decontaminated Farmland in Fukushima Using Micro-satellite Venµs and Hyperspectral Sensing.” Proceedings of the IEEE International Goescience and Remote Sensing Symposium 2020. Hawaii. (in press).
- Inoue, Y., J. Peñuelas, A. Miyata, and M. Mano. 2008. “Normalized Difference Spectral Indices for Estimating Photosynthetic Efficiency and Capacity at a Canopy Scale Derived from Hyperspectral and CO2 Flux Measurements in Rice.” Remote Sensing of Environment 112: 156–172.
- Inoue, Y., M. Guérif, F. Baret, A. Skidmore, A. Gitelson, M. Schlerf, R. Darvishzadeh, and A. Olioso. 2016. “Simple and Robust Methods for Remote Sensing of Canopy Chlorophyll Content: A Comparative Analysis of Hyperspectral Data for Different Types of Vegetation.” Plant, Cell & Environment 39: 2609–2623.
- Inoue, Y., and M. Yokoyama. 2017. “Drone-based Remote Sensing of Crops and Soils and Its Application to Smart Agriculture.” Journal of the Remote Sensing Society of Japan 37: 224–235.
- Inoue, Y., and M. Yokoyama 2019. “Drone-based Optical, Thermal, and 3D Sensing for Diagnostic Information in Smart Farming - Systems and Algorithms.” Proceedings of the IEEE International Geoscience and Remote Sensing Symposium (IGARSS) 2019, 7266–7269. Yokohama.
- Inoue, Y., and M. S. Moran. 1997. “A Simplified Method for Remote Sensing of Daily Canopy Transpiration- A Case Study with Direct Measurements of Canopy Transpiration in Soybean Canopies-.” International Journal of Remote Sensing 18: 139–152.
- Inoue, Y., M. S. Moran, and T. Horie. 1998. “Analysis of Spectral Measurements in Rice Paddies for Predicting Rice Growth and Yield Based on a Simple Crop Simulation Model.” Plant Production Science 1: 269–279.
- Inoue, Y., S. Morinaga, and M. Shibayama. 1993. “Non-destructive Estimation of Water Status of Intact Crop Leaves Based on Spectral Reflectance Measurements.” Japanese Journal of Crop Science 62: 462–469.
- Inoue, Y., T. Kurosu, H. Maeno, S. Uratsuka, T. Kozu, K. Dabrowska-Zielinska, and J. Qi. 2002. “Season-long Daily Measurements of Multifrequency (Ka, Ku, X, C, and L) and Full-polarization Backscatter Signatures over Paddy Rice Field and Their Relationship with Biological Variables.” Remote Sensing of Environment 81: 194–204.
- Inoue, Y., T. Sakuratani, M. Shibayama, and S. Morinaga. 1994. “Remote and Real-time Sensing of Canopy Transpiration and Conductance -comparison of Remote and Stem Flow Gauge Methods in Soybean Canopies as Affected by Soil Water Status-.” Japanese Journal of Crop Science 63: 664–670.
- IPCC. 2019. Special report on climate change, desertification, land degradation, sustainable land management, food security, and greenhouse gas fluxes in terrestrial ecosystems. Chapter 5: Climate Change and Land, The Intergovernmental Panel on Climate Change (IPCC), 1–200.
- Jackson, R. D., S. B. Idso, R. J. Reginato, and P. J. Pinter Jr. 1981. “Canopy Temperature as a Crop Water Stress Indicator.” Water Resources Research 17: 1133–1138.
- Jackson, R. D., T. R. Clarke, and M. S. Moran. 1992. “Bidirectional Calibration Results for 11 Spectralon and 16 BaSO4 Reference Reflectance Panels.” Remote Sensing of Environment 40: 231–239.
- Jacquemoud, S., W. Verhoef, F. Baret, C. Bacour, P. J. Zarco-Tejada, G. P. Asner, C. Franҫois, and S. L. Ustin. 2009. “PROSPECT+SAIL: A Review of Use for Vegetation Characterization.” Remote Sensing of Environment 113: S56–S66.
- Kelcey, J., and A. Lucieer. 2012. “Sensor Correction of a 6-band Multispectral Imaging Sensor for UAV Remote Sensing.” Remote Sensing 4: 1462–1493.
- Ladoni, M., H. A. Bahrami, S. K. Alavipanah, and A. A. Norouzi. 2010. “Estimating Soil Organic Carbon from Soil Reflectance: A Review.” Precision Agriculture 11: 82–99.
- Le Toan, T., F. Ribbes, L. Wang, Floury, N. K. Ding, J. A. Kong, M. Fujita, and T. Kurosu. 1997. “Rice Crop Mapping and Monitoring Using ERS-1 Data Based on Experiment and Modeling Results.” IEEE Transactions on Geoscience and Remote Sensing 35: 41–56.
- Leardi, R., and L. Norgaard. 2004. “Sequential Application of Backward Interval Partial Least Squares and Genetic Algorithms for the Selection of Relevant Spectral Regions.” Journal of Chemometrics 18: 486–497.
- Liang, S. 2005. Quantitative Remote Sensing of Land Surfaces, 560. New Jersey: John Wiley & Sons.
- Liu, W., F. Baret, X. Gu, B. Zhang, Q. Tong, and L. Zheng. 2003. “Evaluation of Methods for Soil Surface Moisture Estimation from Reflectance Data.” International Journal of Remote Sensing 24: 2069–2083.
- Loizzo, R., M. Daraio, R. Guarini, F. Longo, R. Lorusso, L. Dini, and E. Lopinto 2019. “PRISMA Mission Status and Perspective.” Proceedings of the IEEE International Geoscience and Remote Sensing Symposium (IGARSS) 2019, 4503–4506. Yokohama.
- Lopez-Sanchez, J. M., I. Hajnsek, and J. D. Ballester-Berman. 2012. “First Demonstration of Agriculture Height Retrieval with PolInSAR Airborne Data.” Geoscience and Remote Sensing Letters 9: 242–246.
- MAFF-Japan (Ministry of Agriculture, Forestry and Fisheries of Japan). 2015. Census of Agriculture and Forestry 2015, Ministry of Agriculture, Forestry and Fisheries of Japanese Government, 594–661.
- Martínez-Fernández, J., A. González-Zamora, N. Sánchez, A. Gumuzzio, and C. M. Herrero-Jiménez. 2016. “Satellite Soil Moisture for Agricultural Drought Monitoring: Assessment of the SMOS Derived Soil Water Deficit Index.” Remote Sensing of Environment 177: 277–286.
- Meroni, M., R. Colombo, and C. Panigada. 2004. “Inversion of a Radiative Transfer Model with Hyperspectral Observations for LAI Mapping in Poplar Plantations.” Remote Sensing of Environment 92: 195–206.
- Moran, M. S., Y. Inoue, and E. M. Barnes. 1997. “Opportunities and Limitations for Image-based Remote Sensing in Precision Crop Management.” Remote Sensing of Environment 61: 319–346.
- Mutanga, O., and A. K. Skidmore. 2004. “Narrow Band Vegetation Indices Overcome the Saturation Problem in Biomass Estimation.” International Journal of Remote Sensing 25: 3999–4014.
- Nilsson, H. E. 1991. “Hand-held Radiometry and IR-thermography of Plant Diseases in Field Plot Experiments.” International Journal of Remote Sensing 12: 545–557.
- Norgaard, L., A. Saudland, J. Wagner, J. P. Nielsen, L. Munck, and S. B. Engelsen. 2000. “Interval Partial Least-squares Regression (Ipls): A Comparative Chemometric Study with an Example from Near-infrared Spectroscopy.” Applied Spectroscopy 54: 413–419.
- Notarnicola, C., M. Angiulli, and F. Posa. 2008. “Soil Moisture Retrieval from Remotely Sensed Data: Neural Network Approach versus Bayesian Method.” IEEE Transactions on Geoscience and Remote Sensing 46: 547–557.
- Olioso, A., Y. Inoue, S. Ortega-Farias, J. Demarty, J. P. Wigneron, T. Braud, F. Jacob, et al. 2005. “Future Directions for Advanced Evapotranspiration Modeling: Assimilation of Remote Sensing Data into Crop Simulation Models and SVAT Models.” Irrigation and Drainage Systems 19: 377–412.
- Planet Labs Inc. 2019. Planet Imagery Product Specifications, 1–91.
- Rasmussen, J., G. Ntakos, J. Nielsen, J. Svensgaard, R. N. Paulsen, and S. Christensen. 2016. “Are Vegetation Indices Derived from Consumer-grade Cameras Mounted on UAVs Sufficiently Reliable for Assessing Experimental Plots?” European Journal of Agronomy 74: 75–92.
- Sakaiya, E., and Y. Inoue. 2012. “Investigating Error Sources in Remote Sensing of Protein Content of Brown Rice Towards Operational Applications on a Regional Scale.” Japanese Journal of Crop Science 81: 317–331.
- Sakaiya, E., and Y. Inoue. 2013. “Operational Use of Remote Sensing for Harvest Management of Rice.” Journal of the Remote Sensing Society of Japan 33: 185–199.
- Santi, E., G. Fontanelli, F. Montomoli, M. Brogioni, G. Macelloni, S. Paloscia, S. Pettinato, and P. Pampaloni 2012. “The Retrieval and Monitoring of Vegetation Parameters from COSMO-SkyMed Images.” Proceeding of the IEEE International Geoscience and Remote Sensing Symposium (IGARSS) 2012, 7031–7034. Munich, July 22-27, 2012.
- Schlerf, M., and C. Atzberger. 2006. “Inversion of a Forest Reflectance Model to Estimate Structural Canopy Variables from Hyperspectral Remote Sensing Data.” Remote Sensing of Environment 100: 281–294.
- Shiga, H., M. Fukuhara, and S. Ogawa. 1989. “Mapping Soil Organic Matter of Submerged Paddy Using Landsat TM Data.” Japanese Journal of Soil Science and Plant Nutrition 60: 432–436.
- Snow, C. 2016. “The Truth about Drones in Precision Agriculture.” Skylogic Research, 1–6, http://droneanalyst.com/2016/06/27/the-truth-about-drones-in-precision-agriculture/(2017.6.6)
- Spiegelman, C. H., M. J. McShane, M. J. Goetz, M. Motamedi, Q. L. Yue, and G. L. Coté. 1998. “Theoretical Justification of Wavelength Selection in PLS Calibration: Development of a New Algorithm.” Analytical Chemistry 70: 35–44.
- Stafford, J. V. 2000. “Implementing Precision Agriculture in the 21st Century.” Journal of Agricultural Engineering Research 76: 267–275.
- Stevens, A., B. van Wesemael, H. Bartholomeus, D. Rosillon, B. Tychon, and E. Ben-Dor. 2008. “Laboratory, Field and Airborne Spectroscopy for Monitoring Organic Carbon Content in Agricultural Soils.” Geoderma 144: 395–404.
- Stöcker, C., R. Bennett, F. Nex, M. Gerke, and J. Zevenbergen. 2017. “Review of the Current State of UAV Regulations.” Remote Sensing 9: 459–484. doi:https://doi.org/10.3390/rs9050459.
- Thenkabail, P. S., G. J. Lyon, and A. Huete, eds. 2019. Hyperspectral Remote Sensing of Vegetation. 2nd ed. New York: CRC Press-Taylor and Francis group. Vol.1: 449p, Vol.2: 296p, Vol.3: 348p, Vol.4: 386p.
- United Nations, Department of Economic and Social Affairs, Population Division. 2019. World Population Prospects 2019: Data Booklet(ST/ESA/SER.A/424), United Nations, 1–28.
- Verhoeven, G. 2011. “Taking Computer Vision aloft—Archaeological Three-dimensional Reconstructions from Aerial Photographs with PhotoScan.” Archaeological Prospection 18: 67–73.
- Way, D. A., and S. P. Long. 2015. “Climate-smart Agriculture and Forestry: Maintaining Plant Productivity in a Changing World while Minimizing Production System Effects on Climate.” Plant, Cell & Environment 38: 1683–1685.
- Weiss, M., F. Jacob, and G. Duveiller. 2020. “Remote Sensing for Agricultural Applications: A Meta-review.” Remote Sensing of Environment 236. doi:https://doi.org/10.1016/j.rse.2019.111402.
- Wolfert, S., L. Ge, C. Verdouw, and M. J. Bogaardt. 2017. “Big Data in Smart Farming – A Review.” Agricultural Systems 153: 69–80.
- Zhang, C., and J. M. Kovacs. 2012. “The Application of Small Unmanned Aerial Systems for Precision Agriculture: A Review.” Precision Agriculture 13: 693–712.
- Zhi, X., and Y. Inoue 2012. “Hyperspectral Assessment of Soil Carbon Content in Diverse Ecosystems - Comprehensive Analysis of Spectral-index and Multivariable Regression Approaches.” Proceedings of 53rd Conference of the Remote Sensing Society of Japan, 177–178. Tokyo.