
 ?Mathematical formulae have been encoded as MathML and are displayed in this HTML version using MathJax in order to improve their display. Uncheck the box to turn MathJax off. This feature requires Javascript. Click on a formula to zoom.
ABSTRACT
Farmland in the Fukushima region of Japan experienced unprecedented radioactive contamination as a result of the Fukushima Nuclear Power Plant disaster in 2011. Many fields (4,950 ha; over 30,000 fields to date) have been decontaminated by replacing the top surface soil with non-contaminated soil. However, the fertility of these fields is quite low and within-field heterogeneity is marked. Accordingly, appropriate management of soil and fertilizer is required for recovery of crop productivity in these decontaminated fields. Remote sensing can play a critical role in rapid spatial assessment of soil fertility. This preliminary study investigated the potential of spectral sensing approaches based on hyperspectral reflectance measurements (400–2500 nm) of soil samples from a decontaminated paddy field in the Fukushima region. Spectral index algorithms (the ratio spectral index [RSI] and normalized difference spectral index [NDSI]) and multivariate regression methods (partial least-squares regression [PLSR] and interval PLSR [iPLSR]) were used to identify accurate, robust predictive models. The iPLSR and PLSR showed higher predictive accuracy than the other methods (r2val = 0.937 and 0.802, respectively). The best spectral indices explored using RSI and NDSI have good potential for assessing the spatial variability of soil carbon content (SC; r2val = 0.730 ~ 0.844), despite using only two wavebands. The results from the RSI map (or NDSI map) approach provided useful information for creating optimal algorithms for assessing SC values using various sensors, including high-resolution optical satellite sensors. Although we must note that optimal algorithms and their applicability are often site-specific depending on soil type and surface conditions, our results imply that these spectral sensing methods can contribute to the recovery of soil fertility of decontaminated fields in the Fukushima region through careful calibration/validation procedures with sufficient in situ data.
1. Introduction
Farmland in the Fukushima region experienced unprecedented radioactive contamination as a result of the Fukushima Nuclear Power Plant disaster in 2011. Public agencies have made various efforts to decontaminate the farmland soils (MAFFJ Citation2013; MEJ Citation2019). The most effective decontamination method is to replace the top surface soil with non-contaminated soil, because more than 90% of the radioactive cesium proved to be within the top 5 cm of soil (MAFFJ Citation2013). The top 5 cm of soil was removed using backhoes and the removed soil was packed in bags and stacked in designated areas. Non-contaminated soil from nearby non-agricultural areas was transported to the fields and used for soil dressing. This method has been, and will have to be, applied to a large number of fields in the heavily polluted area.
By the end of March 2019, the farmland of 4,950 ha (over 30,000 fields) had been decontaminated in the coastal region (MEJ Citation2020), and the evacuation order in these decontaminated zones was gradually lifted. In parallel, agricultural activities had been restarted in some fields. Still, many fields will have to be decontaminated in the coming years.
However, the fertility of the decontaminated fields is quite low and within-field heterogeneity is marked. Accordingly, appropriate soil and fertilizer management is needed to restore crop productivity in the decontaminated fields. For example, deep cultivation down to 20–30 cm using rotary tillers and application of manure or soil conditioner has been recommended. Variable-rate application of organic materials or fertilizers based on diagnostic spatial information is promising for efficient use of materials and labor in the scheme of smart farming (Inoue Citation2017, Citation2020; Inoue, Darvishzadeh, and Skidmore Citation2019).
Appropriate diagnostic information on soil fertility is essential for effective soil management toward recovery of crop productivity. Soil carbon (or humus) content is the most effective indicator of soil fertility (Diacono and Montemurro Citation2010). Remote sensing can play a critical role in rapid spatial assessment of soil fertility (Ben-Dor, Inbar, and Chen Citation1997; Angelopoulou et al. Citation2019). Many studies have suggested that spectral data are related to soil properties such as soil texture and soil organic carbon (Ladoni et al. Citation2010; Zhi and Inoue Citation2012; Rodionov et al. Citation2014).
Nevertheless, the predictive ability is highly dependent on the dataset or sensor, and accuracy and wider applicability can be unsatisfactory (Stevens et al. Citation2008; Bellon-Maurel et al. Citation2010; Angelopoulou et al. Citation2019; Vaudour et al. Citation2019). Accurate assessment of soil fertility, especially in low-fertility soils such as in the decontaminated fields, is still challenging. Therefore, we investigated the potential of hyperspectral sensing for assessing soil fertility in decontaminated fields in Fukushima. This paper reports the preliminary analytical results regarding predicting the spatial heterogeneity of soil carbon in decontaminated fields.
2. Materials and methods
2.1. Soil data
In 2018, 60 soil samples were collected from a paddy field (0.5 ha) in Tomioka-machi, Fukushima Prefecture (37°20ʹ39.35”N, 141°0ʹ0.20”E). The residents were evacuated from the area after the Fukushima Daiichi Nuclear Power Plant disaster in 2011. The farmland in the area was polluted by radionuclides, particularly radioactive cesium. Subsequently, the heavily polluted fields were decontaminated by replacing the surface soil layer (5–10 cm) with new soil from nearby mountainous areas.
The original soil in the field was categorized as Skeletal Haplic Gray Lowland Soil (Obara et al. Citation2011), while the dressed soil was sandy soil. Before the soil sampling, the paddy had been cultivated several times per year by using a rotary cultivator to a depth of 20 cm without growing any crops. Accordingly, the impact of decontamination on the rice growth in the field is unknown, but serious heterogeneity and inferior yield was observed in nearby decontaminated fields. Soil samples were taken from 0–5 cm depth at 3 m × 3 m grids within the field. Samples were air-dried, ground, passed through a 2-mm sieve, and used for chemical analyses. The moisture content of the air-dried soils was around 15% in average. The total soil carbon (SC) and soil nitrogen (SN) were determined using a C/N analyzer (CN coder MT-700MK-2, Yanako, Japan).
2.2. Hyperspectral measurements
Spectral measurements were made in a controlled laboratory environment using a portable spectroradiometer (FieldSpec-FR, ASD, USA). The spectral range was 350–2500 nm with a resolution (full-width at half maximum) of 3 nm for the 350–1000 nm region and 10 nm for 1000–2500 nm. The sampling interval was 1.4 and 2 nm for the respective regions. These signatures were used to generate reflectance spectra at 3-nm intervals using cubic spline interpolation, and the dataset of 700 bands from 401 nm to 2498 nm was used for the analyses.
Each soil sample was prepared in a 12-cm-diameter, 1.5-cm-deep Petri dish that formed a uniform surface for the spectral measurements. The soil surface was illuminated using four 200-W tungsten lamps, with an incidence angle of 45°. The reflectance spectrum of each soil sample was obtained using an optical-fiber probe which was positioned perpendicular to the soil surface. The field of view of the fiber probe was 25° and the distance between the probe end and the soil surface was 15 cm. Five spectra were collected for each soil sample and averaged for analyses. A white reference panel (Spectralon, Labsphere, USA) was measured before and after measuring every five soil samples to derive the absolute reflectance of the soils.
2.3. Analytical methods
The relationship between spectral reflectance and SC values was analyzed using the normalized spectral index (SI) approach and multivariate regression.
2.3.1. Spectral index approach
The SI approaches such as using the normalized difference vegetation index (NDVI) have been widely used to assess land-surface parameters. Normalization using multiple wavebands has proved effective in reducing the influence of various errors. Simple algorithms that use a few wavebands are also desirable for better applicability of low-cost sensors and rapid data processing. Therefore, we applied the ratio spectral index (RSI) map and normalized difference spectral index (NDSI) map approaches to explore the optimal indices for assessing SC values using all of the hyperspectral wavebands (EquationEquations (1(1)
(1) ) and (Equation2
(2)
(2) ); Inoue et al. Citation2008, Inoue et al. Citation2012). The RSI is defined as
where x and y are the reflectance (Ri and Rj) values at i and j nm over the entire hyperspectral region (Liu et al. Citation2003; Mutanga and Skidmore Citation2004; Inoue et al. Citation2008, Citation2012). Similarly, NDSI is defined as
The RSI and NDSI maps are contour maps of statistical indicators, such as the coefficient of determination (r2) between the target variable and spectral indices (RSI or NSDI).
2.3.2. Multivariate regression methods
To increase the accuracy by making the most of a large number of hyperspectral wavebands, we applied chemometric algorithms, i.e., partial least-squares regression (PLSR) and interval PLSR (iPLSR). PLSR reduces the multi-collinearity problem for hyperspectral data without losing information about the contribution of individual wavebands; iPLSR is an improved version of PLSR that uses iterative waveband selection to minimize the residual error (Norgaard et al. Citation2000).
The theoretical expression of the PLSR is as follows:
where yi is the target variable (dependent variable), xij is the spectral reflectance (independent variables), m is the number of spectral bands, n is the number of samples, ei is the error, βk is the regression coefficient, Tik is the latent variable (LV), r is the number of latent variables, and ckj is the coefficient of the LV. These calculations were conducted using MATLAB (R2018a, MathWorks) and PLS toolbox (R8.7, Eigenvector).
2.3.3. Comparative assessment of model performance
Statistical indicators such as the coefficient of determination (r2) and root mean square error (RMSE) were used to compare the predictive ability of the spectral algorithms and models using the SI, PLSR, and iPLSR methods. Because our main purpose was to investigate the potential of hyperspectral remote sensing for estimating the within-field heterogeneity of SC in the decontaminated fields, a cross-validation method was used to assess their relative capabilities.
3. Results and discussion
3.1. Soil properties of the decontaminated field
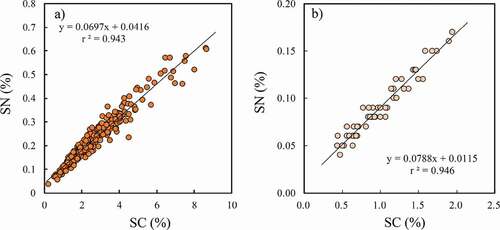
In the decontaminated field, SC values were 0.43–1.94% and SN values were 0.04–0.17%. These values are low compared to the overall range of SC values for soil samples from the Fukushima coastal region (SC = 0.22–8.63%; SN = 0.04–0.61%; n = 368) obtained in 2011 by the Fukushima Agricultural Technology Center. The coefficients of variation (CVs) of the SC and SN values in the field were 39.2% and 35.3%, respectively, indicating significant within-field heterogeneity. A part of such spatial heterogeneity was observable by eye to some extent because the color of the added soil was somewhat whiter than the original soil. However, the degree of difference could only be observed qualitatively and the spatial heterogeneity looked non-systematic. SC and SN values were closely correlated in both the paddy field (r2 = 0.95; n = 60) and regional datasets (r2 = 0.94; n = 368) (). Because nitrogen released from the soil is important for crop growth, these results imply that SC values are an indirect, but reasonable, indicator of soil fertility.
Figure 1. Relationship between carbon (SC) and nitrogen (SN) in the soil of crop fields. (a) Data for soil samples taken in the entire area in 2011, the year of the tsunami and nuclear disaster, and (b) data for soil from a decontaminated paddy field in 2018
3.2. Reflectance spectra of the sample soils
shows the reflectance spectra of all soil samples. The overall pattern of spectral reflectance was typical of lowland gray soils. The strong absorption around 1400 and 1940 nm is due to water, hydroxyls, and clay (Ben-Dor, Inbar, and Chen Citation1997). The spectral curves and CV of each waveband clearly show the significant spatial variability of the reflectance within the decontaminated field. Overall, CVs were relatively high in the visible (VIS) to near-infrared (NIR) wavelength regions (500–900 nm) compared to the shortwave infrared (SWIR) region (1300–2500 nm). The highest CVs were found at around 600 nm. This high variability in the VIS region is due to the differences in soil color related to the electronic transitions in chromophores. In general, soil becomes darker with increasing SC (Ladoni et al. Citation2010).
Figure 2. Reflectance spectra of 60 soil samples from a decontaminated paddy field and their relations with soil properties (SC, SN, and C/N ratio)
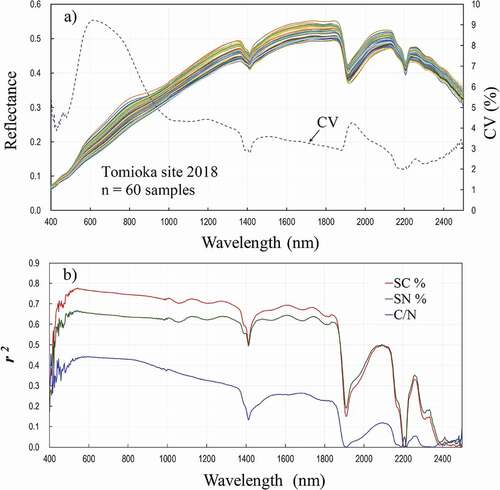
In the NIR and SWIR regions, some weak absorption occurred due to stretching and bending of the N–H, O–H, and C–H bonds; such spectral changes are related to SC values via the differences in lignin, cellulose, and other carbohydrates (Stuart Citation2004). Accordingly, even with a relatively small CV, the spectral changes in some narrow bands are closely related to SC values. This is the basis for the cellulose absorption index (CAI) proposed for discriminating crop residues on soil (Daughtry Citation2001). Derivative spectra can be useful for detecting such weak changes in narrow wavebands (Zhi and Inoue Citation2012).
Accordingly, the correlation between the reflectance of individual wavelengths and SC values was relatively high (r2 = 0.60–0.78) in the 500–1850-nm spectral region compared to the 400–500 and 1850–2500-nm regions (). There was an absorption peak of cellulose at around 2100 nm. Nevertheless, the correlation was not as high as in the 500–1850-nm region. Of note, the 500–700-nm region correlated best with SC values for this soil type. The correlation of reflectance with SN values showed a similar spectral pattern, but the correlation coefficient was somewhat lower than that for SC. This significant correlation with SN can be attributed to the high correlation between SN and SC ().
3.3. Spectral indices for assessing SC
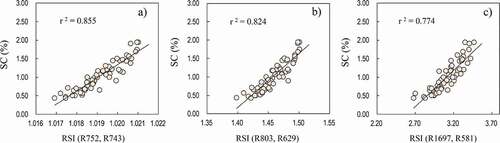
The analytical results imply that some RSIs and NDSIs are promising (). shows a contour map of r2 between SC and RSI (Ri, Rj) using the reflectance values (Ri and Rj nm) for all combinations of two wavebands. The highest r2val (0.844) was found in the red-edge region, i.e., RSI (R752, R743), although the peak was narrow. The second-best region (r2val = 0.809) was a broad area around RSI (R803, R629), which implied robustness against a wavelength shift or applicability to broadband sensors. The third-best index used SWIR band R1697 with R581, which was also a broad spectral region, but the predictive ability was lower (r2val = 0.755). The scatterplots show the close relationship and overall linearity between these spectral indices and SC values (, ).
Table 1. Comparison of the fitting and predictive ability of the generalized spectral index method (NDSI and RSI) and multivariate regression methods (PLSR and iPLSR)
Figure 3. RSI map of the relationship between SC values and RSI (Ri, Rj) using the combination of two wavebands (Ri, Rj) from the entire reflectance spectra. This contour map shows the predictive ability (r2) of SC values by RSI (Ri, Rj) (n = 60)
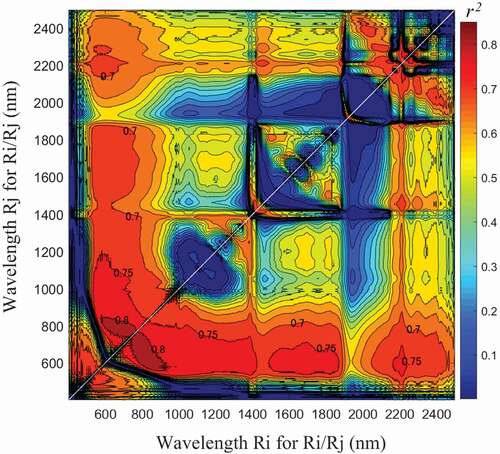
Figure 4. Relationship between SC values and some promising spectral indices selected from the RSI map
The results of another spectral index NDSI (Rj, Ri) implied that similar waveband combinations to those for RSI are significant. While the overall predictive ability of NDSIs was somewhat lower than that of RSIs, NDSI (R743, R753) was best (r2val = 0.843) and NDSI (R581, R1697) was second best (r2val = 0.730).
The results imply that the VIS and NIR wavebands are useful for assessing within-field variability of SC values in this soil. Based on the selected wavebands, the spectral absorption of soil components such as lignin, cellulose, and carbohydrate, which are directly related to SC, may not contribute strongly to the overall soil spectra. Conversely, the changes in soil color, which are closely related to these constituents, contribute more significantly to indirect assessment of SC values. This implies that the predictive ability of spectral indices is highly dependent on soil type, because the relative significance of wavebands is affected by the integrated effects of the absorptive features of SC components, as well as their relationships with soil color and soil texture. These results accord with the general insights from preceding studies indicating that useful wavebands and models are diverse, depending on soil types and locations (Stevens et al. Citation2008; Zhi and Inoue Citation2012; Bellon-Maurel et al. Citation2010; Angelopoulou et al. Citation2019; Castaldi et al. Citation2019).
3.4. PSLRs for assessing SC
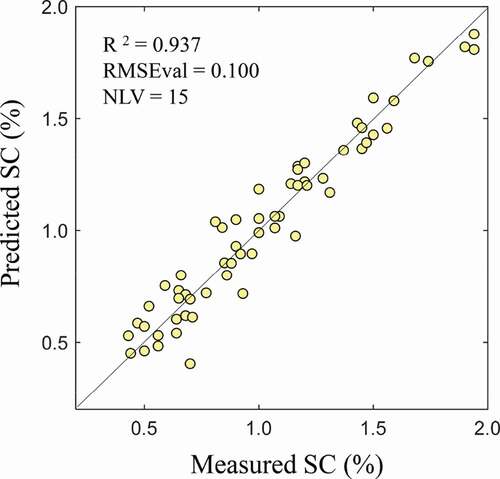
The predictive ability of iPLSR for this dataset is shown in (r2val = 0.937); it was superior to PLSR (r2val = 0.802). Note that PLSR using all 700 bands had lower predictive ability than iPLSR using 412 wavebands. This might have resulted from the influence of useless or disturbing wavebands. By contrast, the discrepancy between calibration and validation accuracy was much larger for PLSR (18%) than for iPLSR (5.5%), presumably because of stronger multicollinearity in PLSR. Accordingly, iPLSR may be more powerful than PLSR for assessing SC values, as reported for hyperspectral assessment of plant ecophysiological variables (Inoue et al. Citation2016). The 412 bands selected in iPLSR were summarized into 15 latent variables that consisted of multiple wavebands in the VIS, NIR, and SWIR regions. The majority of the selected wavebands had high correlations with SC values, but some were not always strongly correlated with SC values. As suggested by previous studies (Bartholomeus et al. Citation2008; Bellon-Maurel and McBratney Citation2011; Ladoni et al. Citation2010; Xu et al. Citation2018), the model structure (combinations and contributions of wavebands) is highly dataset dependent. Accordingly, in addition to sufficient calibration and validation, a careful application strategy in terms of soil types, surface conditions, and sensor specifications is required.
Figure 5. Predictive ability of the iPLSR model using 412 of the 700 wavebands
3.5. Comparison of the predictive methods
compares the predictive ability and necessary wavebands of all algorithms. The multivariate models (iPLSR and PLSR) had higher predictive accuracy compared to the other methods. However, the robustness or applicability of multivariate models is often uncertain, even if the fitting to individual datasets is excellent. In fact, the discrepancy between r2val and r2cal was largest for PLSR (18%), while it was 1.3 to 5.5% for the other algorithms. Care should be taken regarding the multicollinearity and over-fitting issues of multivariate methods (Inoue et al. Citation2012). In addition, note that the applicability of PLSR models is constrained by the sensor specifications of individual systems (number, position, and width of wavebands). This would be a case for machine learning methods (Ali et al. Citation2015).
The CAI using three SWIR bands, including the absorption peak of cellulose (2100 nm), was moderately correlated with SC values (r2val = 0.663). CAI is thought to be able to discriminate or quantify crop residues on the soil surface, and has proven to be useful (Daughtry Citation2001; Nagler et al. Citation2003). The CAI may be robust, in principle, because it is based on the spectral features of a soil component (cellulose) with reasonable normalization. However, the predictive accuracy is not always high because the signature may be disturbed by other soil physicochemical factors.
The optimized spectral indices with the RSI and NDSI formulations proved to have good potential for spectral assessment of the spatial variability of SC despite using only two wavebands. The simplicity and wide applicability of spectral indices, particularly with broad wavebands, is of significant merit. The influence of disturbing factors such as moisture content and measuring environments would be reduced by spectral normalization using multiple wavebands (Inoue et al. Citation2016). In this preliminary case study, several spectral indices using VIS to NIR wavelength regions proved promising, but their close relationship with SC values was attributed mainly to changes in soil color associated with the decontamination procedures (removal of contaminated soil and dressing with new soil). These results imply that changes in soil color can provide sufficient information on SC values, as the chemical components of SC in soil are closely related to soil color. Note that the capability of spectral methods is highly dependent on the intimate relationship between the reflectance spectra and the major carbon constituents of a target soil.
These approaches would be useful for on-the-go sensing of within-field variability of SC values, as attempted by Tabatabai et al. (Citation2019). Most such attempts have applied PLSR, but the selection of a suitable method is essential for operational use of spectral sensing aimed at improving soil fertility. The operational demands for spatial resolution, simplicity of spectral calculation, moving speed of platform (e.g., tractors and drones), and cost have to be considered (Inoue and Yokoyama Citation2019). By contrast, for regional-scale assessment of SC values in individual fields, high-resolution satellites (~5 m) are promising, as suggested by Inoue (Citation2017, Citation2020) and Gholizadeh et al. (Citation2018). The spectral range of such optical satellite sensors is presently limited to the VIS–NIR region, and they are equipped with a limited number of broad wavebands. However, our results show that several spectral indices can be applied to such sensor specifications. Several error sources related to soil-surface conditions have to be considered, as suggested by Vaudour et al. (Citation2019), but our results imply the potential of this method.
Nevertheless, as mentioned above, the predictive accuracy and applicability of models are affected by several conditions (soil moisture, roughness, disturbance by residues, or vegetation) and the limitations inherent to calibration datasets (Bogrekci and Lee Citation2006; Lobell and Asner Citation2002; Udelhoven, Emmerling, and Jarmer Citation2003; Nocita et al. Citation2013; Rodionov et al. Citation2014). In fact, most previous studies based on different datasets in different study areas (soil types) suggested that predictive algorithms and their applicability are site specific, depending on individual calibration datasets (Stevens et al. Citation2008; Vaudour et al. Citation2019).
In this particular application aimed at recovery of the soil fertility of decontaminated fields in the Fukushima region, careful calibration/validation with sufficient in situ data for the region is essential. A large number of soil samples will be collected from the region, and they will facilitate the development of ground-, drone-, and satellite-based remote sensing methods for assessing soil fertility. In order to ensure the sufficient predictive accuracy and wider applicability, it is reasonable to derive a few algorithms for several groups of soil types with similar physicochemical characteristics. For example, Zhi and Inoue (Citation2012) showed that the predictive accuracy was much improved by dividing the diverse types of soils into Andisols and non-Andisol groups. Since the information on soil types (series group) is available online for all farmland in Japan (Obara et al. Citation2011), the present approach would be applicable to any location by using several sets of algorithms determined for several groups of soil types.
4. Conclusions
This preliminary case study investigated the potential of spectral methods for assessing soil fertility after decontamination of fields that were polluted by the Fukushima Nuclear Power Plant disaster in 2011.
Our hyperspectral analyses using in situ measurements proved that several spectral indices (RSIs and NDSIs) and multivariate methods (iPLSR) are promising for assessing SC values. The RSI map (or NDSI map) provided useful information for creating optimal algorithms for assessing SC using various sensors, including high-resolution optical-satellite and drone-based remote sensors. Systematic collection of hyperspectral data for diverse soils would play an critical role. Based on careful calibration/validation with in situ data for the region, spectral methods can enable accurate, robust, and rapid assessment of SC values. Additionally, note that the predictive accuracy, robustness (wider applicability), and simplicity (cost of sensors and systems) should be balanced in operational applications.
Currently, agricultural activities have restarted only in some decontaminated fields. However, many fields will be decontaminated in the coming years. Because the SC value is a good indicator of soil fertility, these spectral methods should contribute to the diagnosis and management of the recovery of crop productivity in decontaminated fields in the Fukushima region.
Acknowledgments
We are grateful to Mr. Noboru Watanabe for allowing our soil sampling in his decontaminated fields. This work was supported in part by MAFF-FIC program by Japanese Government.
Disclosure statement
No potential conflict of interest was reported by the authors.
References
- Ali, I., F. Greifeneder, J. Stamenkovic, M. Neumann, and C. Notarnicola. 2015. “Review of Machine Learning Approaches for Biomass and Soil Moisture Retrievals from Remote Sensing Data.” Remote Sensing 7: 16398–16421. doi:https://doi.org/10.3390/rs71215841.
- Angelopoulou, T., N. Tziolas, A. Balafoutis, G. Zalidis, and D. Bochtis. 2019. “Remote Sensing Techniques for Soil Organic Carbon Estimation: A Review.” Remote Sensing 11: 676. doi:https://doi.org/10.3390/rs11060676.
- Bartholomeus, H. M., M. E. Schaepman, L. Kooistra, A. Stevens, W. B. Hoogmoed, and O. S. P. Spaargaren. 2008. “Spectral Reflectance Based Indices for Soil Organic Carbon Quantification.” Geoderma 145: 28–36. doi:https://doi.org/10.1016/j.geoderma.2008.01.010.
- Bellon-Maurel, V., E. Fernandez-Ahumada, B. Palagos, J.-M. Roger, and A. McBratney. 2010. “Critical Review of Chemometric Indicators Commonly Used for Assessing the Quality of the Prediction of Soil Attributes by NIR Spectroscopy.” Trends in Analytical Chemistry 29 (9): 1073–1081. doi:https://doi.org/10.1016/j.trac.2010.05.006.
- Bellon-Maurel, V., and A. B. McBratney. 2011. “Near-infrared (NIR) and Midinfrared (MIR) Spectroscopic Techniques for Assessing the Amount of Carbon Stock in Soils - Critical Review and Research Perspectives.” Soil Biology and Biochemistry 43: 1398–1410. doi:https://doi.org/10.1016/j.soilbio.2011.02.019.
- Ben-Dor, E., Y. Inbar, and Y. Chen. 1997. “The Reflectance Spectra of Organic Matter in the Visible Near-infrared and Short Wave Infrared Region (400–2500 Nm) during Controlled Decomposition Process.” Remote Sensing of Environment 61: 1–15. doi:https://doi.org/10.1016/S0034-4257(96)00120-4.
- Bogrekci, I., and W. S. Lee. 2006. “Effects of Soil Moisture Content on Absorbance Spectra of Sandy Soils in Sensing Phosphorus Concentrations Using UV–VIS–NIR Spectroscopy.” Transactions ASABE 49: 1175–1180. doi:https://doi.org/10.13031/2013.21717.
- Castaldi, F., S. Chabrillat, A. Don, and B. van Wesemael. 2019. “Soil Organic Carbon Mapping Using LUCAS Topsoil Database and Sentinel-2 Data: An Approach to Reduce Soil Moisture and Crop Residue Effects.” Remote Sensing 11: 2121. doi:https://doi.org/10.3390/rs11182121.
- Daughtry, C. S. T. 2001. “Discriminating Crop Residues from Soil Shortwave Infrared Reflectance.” Agronomy Journal 93: 125–131. doi:https://doi.org/10.2134/agronj2001.931125x.
- Diacono, M., and F. Montemurro. 2010. “Long-term Effects of Organic Amendments on Soil Fertility: A Review.” Agronomy for Sustainable Development 30: 401–422. doi:https://doi.org/10.1051/agro/2009040.
- Gholizadeh, A., D. Žižala, M. Saberioon, and L. Boruvka. 2018. “Soil Organic Carbon and Texture Retrieving and Mapping Using Proximal, Airborne and Sentinel-2 Spectral Imaging.” Remote Sensing of Environment 218: 89–103. doi:https://doi.org/10.1016/j.rse.2018.09.015.
- Inoue, Y. 2017. “Remote Sensing of Plant and Soil Information by High-resolution Optical Satellite Sensors and Its Applications to Smart Agriculture.” Journal of the Remote Sensing Society of Japan 37: 213–223.
- Inoue, Y. 2020. “Satellite- and Drone-based Remote Sensing of Crops and Soils for Smart Farming: A Review.” Soil Science and Plant Nutrition. doi:https://doi.org/10.1080/00380768.2020.1738899.
- Inoue, Y., R. Darvishzadeh, and A. Skidmore. 2019. “Hyperspectral Assessment of Ecophysiological Functioning for Diagnostics of Crops and Vegetation.” In Hyperspectral Remote Sensing of Vegetation, 2nd ed. Vol. 3. edited by P. S. Thenkabail, J. Lyon, and A. Huete, 25–72. London:CRC Press-Taylor and Francis group.
- Inoue, Y., M. Guérif, F. Baret, A. Skidmore, A. Gitelson, M. Schlerf, R. Darvishzadeh, and A. Olioso. 2016. “Simple and Robust Methods for Remote Sensing of Canopy Chlorophyll Content: A Comparative Analysis of Hyperspectral Data for Different Types of Vegetation.” Plant, Cell & Environment 39: 2609–2623. doi:https://doi.org/10.1111/pce.12815.
- Inoue, Y., J. Peñuelas, A. Miyata, and M. Mano. 2008. “Normalized Difference Spectral Indices for Estimating Photosynthetic Efficiency and Capacity at a Canopy Scale Derived from Hyperspectral and CO2 Flux Measurements in Rice.” Remote Sensing of Environment 112: 156–172. doi:https://doi.org/10.1016/j.rse.2007.04.011.
- Inoue, Y., E. Sakaiya, Y. Zhu, and W. Takahashi. 2012. “Diagnostic Mapping of Canopy Nitrogen Content in Rice Based on Hyperspectral Measurements.” Remote Sensing of Environment 126: 210–221. doi:https://doi.org/10.1016/j.rse.2012.08.026.
- Inoue, Y., and M. Yokoyama 2019. “Drone-based Optical, Thermal, and 3D Sensing for Diagnostic Information in Smart Farming - Systems and Algorithms.” Proceedings of International Geoscience and Remote Sensing Symposium (IGARSS) 2019, 7266–7269. Yokohama.
- Ladoni, M., H. L. Bahrami, S. K. Alavipanah, and A. A. Norouzi. 2010. “Estimating Soil Organic Carbon from Soil Reflectance: A Review.” Precision Agriculture 11: 82–99. doi:https://doi.org/10.1007/s11119-009-9123-3.
- Liu, W., F. Baret, X. Gu, B. Zhang, Q. Tong, and L. Zheng. 2003. “Evaluation of Methods for Soil Surface Moisture Estimation from Reflectance Data.” International Journal of Remote Sensing 24: 2069–2083. doi:https://doi.org/10.1080/01431160210163155.
- Lobell, D. B., and G. P. Asner. 2002. “Moisture Effects on Soil Reflectance.” Soil Science Society of America Journal 66: 722–727. doi:https://doi.org/10.2136/sssaj2002.0722.
- MAFFJ (Ministry of Agriculture, Forestry and Fisheries, Japan). 2013. “Manual of Decontamination of Farmlands.” 1: 1–69. vol. 4, 1-144. (in Japanese).
- MEJ (Ministry of Environment, Japan). 2019. “General Project Specification for Decontamination Processes.” 12: 1–135. (in Japanese).
- MEJ (Ministry of Environment, Japan), 2020. “Environmental Remediation - Results and Effects of Decontamination.” Accessed 20 March 2020. http://josen.env.go.jp/en/decontamination/
- Mutanga, O., and A. K. Skidmore. 2004. “Narrow Band Vegetation Indices Overcome the Saturation Problem in Biomass Estimation.” International Journal of Remote Sensing 25: 3999–4014. doi:https://doi.org/10.1080/01431160310001654923.
- Nagler, P. L., Y. Inoue, E. P. Glenn, A. L. Russ, and C. S. T. Daughtry. 2003. “Cellulose Absorption Index (CAI) to Quantify Mixed Soil - Plant Litter Scenes.” Remote Sensing of Environment 87: 310–325. doi:https://doi.org/10.1016/j.rse.2003.06.001.
- Nocita, M., A. Stevens, C. Noon, and B. van Wesemael. 2013. “Prediction of Soil Organic Carbon for Different Levels of Soil Moisture Using Vis-NIR Spectroscopy.” Geoderma 199: 37–42. doi:https://doi.org/10.1016/j.geoderma.2012.07.020.
- Norgaard, L., A. Saudland, J. Wagner, J. P. Nielsen, L. Munck, and S. B. Engelsen. 2000. “Interval Partial Least-squares Regression (Ipls): A Comparative Chemometric Study with an Example from Near-infrared Spectroscopy.” Applied Spectroscopy 54: 413–419. doi:https://doi.org/10.1366/0003702001949500.
- Obara, H., T. Ohkura, Y. Takata, K. Kohyama, Y. Maejima, and T. Hamazaki. 2011. “Comprehensive Soil Classification System of Japan - First Approximation.” Bulletin of National Institute for Agro-Environmental Sciences 29: 1–73. (in Japanese with English summary).
- Rodionov, A., S. Pätzold, G. Welp, R. C. Pallares, L. Damerow, and W. Amelung. 2014. “Sensing of Soil Organic Carbon Using Visible and Near-infrared Spectroscopy at Variable Moisture and Surface Roughness.” Soil Science Society of America Journal 78: 949–957. doi:https://doi.org/10.2136/sssaj2013.07.0264.
- Stevens, A., B. van Wesemael, H. Bartholomeus, D. Rosillon, B. Tychon, and E. Ben-Dor. 2008. “Laboratory, Field and Airborne Spectroscopy for Monitoring Organic Carbon Content in Agricultural Soils.” Geoderma 144: 395–404. doi:https://doi.org/10.1016/j.geoderma.2007.12.009.
- Stuart, B. H. 2004. Infrared Spectroscopy: Fundamentals and Applications. Hoboken, NJ: John Wiley & Sons.
- Tabatabai, S., M. Knadel, A. Thomsen, and M. H. Greve. 2019. “On-the-Go Sensor Fusion for Prediction of Clay and Organic Carbon Using Pre-processing Survey, Different Validation Methods, and Variable Selection.” Soil Science Society of America Journal 83: 300–310. doi:https://doi.org/10.2136/sssaj2018.10.0377.
- Udelhoven, T., C. Emmerling, and T. Jarmer. 2003. “Quantitative Analysis of Soil Chemical Properties with Diffuse Reflectance Spectrometry and Partial Least-square Regression: A Feasibility Study.” Plant and Soil 251: 319–329. doi:https://doi.org/10.1023/A:1023008322682.
- Vaudour, E., C. Gomez, T. Loiseau, N. Baghdadi, B. Loubet, D. Arrouays, L. Ali, and P. Lagacherie. 2019. “The Impact of Acquisition Date on the Prediction Performance of Topsoil Organic Carbon from Sentinel-2 for Croplands.” Remote Sensing 11: 2143. doi:https://doi.org/10.3390/rs11182143.
- Xu, S., Y. Zhao, M. Wang, and X. Shi. 2018. “Comparison of Multivariate Methods for Estimating Selected Soil Properties from Intact Soil Cores of Paddy fields by Vis–NIR Spectroscopy.” Geoderma 310: 29–43. doi:https://doi.org/10.1016/j.geoderma.2017.09.013.
- Zhi, X., and Y. Inoue 2012. “Hyperspectral Assessment of Soil Carbon Content in Diverse Ecosystems - Comprehensive Analysis of Spectral-index and Multivariable Regression Approaches.” Proceedings of 53rd Conference of the Remote Sensing Society of Japan, 177–178. Tokyo.